doi: 10.3389/feart.2017.00098
Edited by: Samuel Abiven, University of Zurich, Switzerland Reviewed by: Philippa Louise Ascough, Scottish Universities Environmental Research Centre, United Kingdom Caitlin E. Hicks Pries, Dartmouth College, United States *Correspondence: Caroline M. Preston caroline.preston@canada.ca
Specialty section: This article was submitted to Biogeoscience, a section of the journal Frontiers in Earth Science Received: 31 July 2017 Accepted: 10 November 2017 Published: 29 November 2017 Citation: Preston CM, Simard M, Bergeron Y, Bernard GM and Wasylishen RE (2017) Charcoal in Organic Horizon and Surface Mineral Soil in a Boreal Forest Fire Chronosequence of Western Quebec: Stocks, Depth Distribution, Chemical Properties and a Synthesis of Related Studies. Front. Earth Sci. 5:98. doi: 10.3389/feart.2017.00098
Charcoal in Organic Horizon and
Surface Mineral Soil in a Boreal
Forest Fire Chronosequence of
Western Quebec: Stocks, Depth
Distribution, Chemical Properties
and a Synthesis of Related Studies
Caroline M. Preston1*, Martin Simard2, Yves Bergeron3, Guy M. Bernard4and
Roderick E. Wasylishen4
1Pacific Forestry Centre, Natural Resources Canada, Victoria, BC, Canada,2Department of Geography, Centre for Forest Research and Centre for Northern Studies, Laval University, Québec, QC, Canada,3Centre for Forest Research, Institut de Recherche sur les Forêts and Chaire Industrielle CRSNG-UQAT-UQAM en Aménagement Forestier Durable, Université du Québec en Abitibi-Témiscamingue, Rouyn-Noranda, QC, Canada,4Department of Chemistry, University of Alberta, Edmonton, AB, Canada
Wildfires are a major driver of carbon stocks and ecosystem development in Canadian boreal forests, but there is little information on amounts and properties of the charcoal produced. Using data and samples available from a previous study, we determined amounts, depth distribution and chemical properties of visually-determined charcoal (>2 mm) in a boreal chronosequence in the Abitibi region of Quebec, Canada. Sites ranged from 24 to 2,355 years since fire (ysf) and originated from low- and high-severity soil burns (>5 or <5 cm organic horizon unburned, respectively). Two or three pits were sampled at 1-cm depth intervals from 20 jack pine (Pinus banksiana) sites (one low severity and 19 high severity) and 31 black spruce (Picea mariana) sites (12 low severity and 19 high severity). Site-level charcoal stocks ranged from 50 to 5,527 kg ha−1with high within-site variability and lower stocks for the oldest sites. Depth distributions typically peaked around the organic-mineral interface, but some low-severity sites also had charcoal layers within the organic horizon. Means from 30 charcoal samples were 569 mg g−1 total C, 4.1 mg g−1 total N and 140 C/N (molar), with total C and C/N showing a trend of decline with time since fire, and total N showing an increase. Solid-state13C CPMAS NMR spectra of nine samples showed high variability among the younger samples, but a trend to higher aromaticity for the older ones. A literature survey focusing on boreal forests similarly showed highly variable stocks and chemical properties of charcoal in organic horizon and upper mineral soil, with reduction of variance and lower stocks after several hundred years. This initial variation was also consistent with reports of highly variable temperatures and duration of charring in wildfires. Adding reports available for char production, and considering that most studies of char stocks and production are limited to the organic horizon (forest floor), suggests that initial production of charred material from boreal wildfires might be around 5–10 tons ha−1.
INTRODUCTION
Fire is the major disturbance in boreal forests and thus a major driver of C cycling and ecosystem function (de Groot et al., 2013; Boulanger et al., 2014). In the Canadian north, for example, in the absence of fire, stands of black spruce [Picea mariana (Mill.) BSP] on poorly drained sites undergo gradual paludification, with increasing thickness of organic horizons and dominance of sphagnum moss and ericaceous shrubs (Lecomte et al., 2005, 2006; Simard et al., 2007). From a C cycling perspective, pyrogenic C (PyC) is expected to have a longer lifetime than other pools of soil organic matter, and thus contribute to long-term C sequestration by partially offsetting C losses due to fire (Bird et al., 2015; Santín et al., 2015, 2016a; Reisser et al., 2016), although this scenario has been challenged (Landry and Matthews, 2017). Recent studies have investigated stocks and properties of PyC in boreal forests of Canada (Bélanger et al., 2004; Hart and Luckai, 2014; Soucémarianadin et al., 2014, 2015a,b) and Alaska (Kane et al., 2010), but there is still insufficient information to develop an integrated picture of the production, stocks, longevity, chemical properties and ecological role of boreal PyC.
PyC is a general term for materials with a wide range of chemical properties and resistance to decomposition, due to variation in the degree of thermal transformation of living biomass or organic matter. This range is often described as the “black carbon (BC) continuum” (Preston and Schmidt, 2006; Bird et al., 2015). The defining characteristic of PyC is the presence of fused aromatic rings (polycyclic aromatic hydrocarbons, PAHs), culminating in graphene sheets and spherical soot structures almost entirely composed of C. Enhanced chemical resistance to decomposition is associated with PAH clusters greater than seven (Bird et al., 2015; McBeath et al., 2015), but much PyC has a smaller average cluster size and considerable substitution by N and O functional groups (Knicker, 2011).
A further complexity arises from the variety of methods used to quantify PyC (Reisser et al., 2016). In general, BC is often used to define the yield of C-containing fractions resistant to various chemical/thermal/photochemical oxidation procedures, or from their yield of benzene polycarboxylic acids (BPCAs) (Preston and Schmidt, 2006; Hammes et al., 2007), as well as from molecular modeling of 13C nuclear magnetic resonance (NMR) spectra
(Kane et al., 2010; Soucémarianadin et al., 2015a). On the other hand, the term “charcoal” typically defines PyC identified visually and often picked out by hand, especially in paleoecology. Results from a milder oxidation procedure specifically developed to capture PyC in forest soil and organic horizon (Kurth et al., 2006; Soucémarianadin et al., 2014; Maestrini and Miesel, 2017) have been variously reported as charcoal or BC. Methods comparison has been undertaken for BC (Hammes et al., 2007), but in general there is little interaction between research groups using chemical vs. visual methods. The chemical methods are more commonly
Abbreviations:BC, black carbon; CP, cross polarization; DP, direct polarization; HI, site originating from a high-severity soil burn; LO, site originating from a low-severity soil burn; ICP, inductively coupled plasma; MAS, magic-angle spinning; NMR, nuclear magnetic resonance; PyC, pyrogenic carbon; Ysf, years since fire.
associated with geochemistry or soil science, and the visual with forest ecology and paleobotany.
The charred material visually apparent after wildfire comprises a continuum of structures and inherent recalcitrance, likely skewed toward lower transformation (Knicker, 2011). To build a complete understanding of the role of PyC in boreal forests requires a wide array of information, including inputs and stocks of different forms of PyC in above- and below-ground pools. Linking initial production, stocks and chemical properties of charcoal, which have often been determined in the organic horizon, and those of BC mostly determined in mineral soil, is essential in closing the gaps in our understanding of the PyC cycle for boreal forests. With a dearth of information available from targeted studies designed to quantify, characterize and link these pools, much relevant information may be gleaned from studies designed for other purposes, mainly paleoecology and forest fire history. Our study utilizes an opportunity that emerged from extensive studies of fire history in the Abitibi region of Quebec, Canada. As reported inLecomte et al. (2005, 2006), charcoal fragments (>2 mm) were picked out and weighed by 1-cm increments in the organic horizon and upper mineral soil in 51 black spruce and jack pine (Pinus banksiana Lamb) chronosequence plots [24–2,355 years-since-fire (ysf)], but area-based results were not included in the original papers focusing on fire frequency. Our first objective was to use these data to examine in more detail the amounts, depth distribution and spatial variability of charcoal in these plots, and to determine chemical characteristics of selected samples. The second objective was to place these results in a broader review of published data on charcoal stocks and properties in boreal forests.
MATERIALS AND METHODS
Site Selection
Detailed information has been published previously (Lecomte et al., 2005, 2006; Simard et al., 2007), including descriptions of the forest region, understory vegetation dynamics since fire, plot selection and classification, determination of ysf by dendrochronology or by radiocarbon dating of charcoal (when post-fire stand age was greater than maximum tree longevity), soil sampling separation of charcoal, and determination of fire severity. Briefly, the fire chronosequence study area (49◦
-51◦20′N; 78◦30′–79◦50′W) is located in the Clay Belt of
northeastern Ontario and northwestern Quebec, within the Picea mariana-feathermoss bioclimatic domain, with mean annual temperature around 0◦C and mean annual precipitation around
900 mm. Most of the area is covered by forests dominated by black spruce or jack pine, with fire as the main disturbance. Due to complex interactions of climate variability, human influence and forest composition, fire cycle length has increased from 101 y before 1850 to 398 y since 1920, with a mean stand age of 148 y at present (Bergeron et al., 2004).
We used a stand initiation map developed for the study area byBergeron et al. (2004)to select black spruce- and jack pine-dominated stands of different post-fire age (ysf). The stand initiation map was created by mapping recent (approximately <100 years ago) fires using aerial photos and archives, and then
assigning a fire date using archives and dendroecological data (fire scars and dating of post-fire cohorts). To date older fires, whose extent could not be delimited using archives and aerial photographs, the study area was divided into a grid of 100-km2
sections where at least one site would be visited and sampled for dendroecological analyses. When the post-fire cohort could not be identified (at least five trees of pioneer species having a germination date within 10 years of each other), a minimum stand age was given, corresponding to the age of the oldest tree (Bergeron et al., 2004). In sites that were selected for the chronosequence but that were assigned a minimum stand age, charcoal fragments collected at the mineral-organic soil interface were radiocarbon-dated to obtain postfire stand age (Simard et al., 2007).
Each black spruce or jack pine stand selected for study had to be on fine-textured mineral deposits, on a slight incline, and free of any sign of anthropogenic disturbance. The thickness of the organic horizon not consumed by the last fire (residual organic layer) was used to distinguish sites originating from high- or low-severity soil burns (defined as <5 or >5 cm organic horizon remaining, respectively), abbreviated HI or LO. Ideally, soil burn severity is quantified as the amount of organic horizon consumed. Nonetheless, as it is impossible to know organic layer depth of the pre-fire stand, fire severity was defined as the depth of the organic layer not consumed by the fire (Lecomte et al., 2005, 2006; Simard et al., 2007). From an ecological perspective, residual organic layer thickness is also more meaningful than organic layer burned because it influences seed germination and tree growth and therefore post-fire succession and stand structure. Seed germination is hindered when the residual organic layer is thicker than 5 cm (Johnstone and Chapin, 2006), which is the threshold that we used to separate low and high-severity soil burns. Residual organic layer thickness was determined by two methods: by meticulous laboratory examination of the monoliths sampled from each site (see next paragraph), and by in situ observation of charcoal layers within numerous pits and trenches dug into the organic horizon. The residual organic layer is easy to identify because it is located between the mineral soil and the uppermost charcoal layer within the organic layer. Above that charcoal layer is the organic soil that accumulated after the fire, which is also much less decomposed than the residual organic layer. The 51 plots (Table 1) include 1 LO and 19 HI jack pine sites, and 12 LO and 19 HI black spruce sites. Forty-eight of these plots correspond to those listed in Appendix 1 ofLecomte et al. (2005, 2006); the three additional plots included in this study are a LO jack pine site of 24 ysf, a LO black spruce site of 24 ysf, and a HI black spruce site of 88 ysf.
Soil Sampling
At each site, two to four 10 cm × 10 cm monoliths of the organic layer, in most cases extending some cm into the mineral soil, were collected. The monoliths were frozen and sliced into 1-cm sections. Subsamples (50 1-cm3) from the organic and mineral
horizons were defloculated with a solution of 2% NaOH or KOH for 24 h at 60◦C. They were neutralized with 10–20% HCl during
which the supernatant turned pale, then passed through sieves (2, 1, and 0.250 mm) for paleobotanical analysis. The mineral
soil/organic matter interface was established where the mineral soil represented <25% of the particles retained in the 2 mm mesh. Charcoal fragments were only recovered from the >2 mm material. If no charcoal was seen in the >2 mm material, but it was seen in the >1 mm material, the amount of charcoal was set at 0.0001 g. The recovered charcoal fragments were dried at 70◦C.
The experimental design to recover charcoal from the >2 mm material was based on the original objectives of the ecological studies (Lecomte et al., 2005, 2006; Simard et al., 2007) for which the recovered fragments were identified as to plant component and species. Similarly, the original study’s plan was to sample the organic horizon only, but in most cases, this extended some variable distance into the mineral soil. Unusual for such retrospective paleobotanical studies, the decision to quantify the mass of charcoal on an area basis and to save the samples enabled us to carry out the study reported here. More recent studies have shown the common occurrence of charcoal/PyC at the interface of the organic and mineral layers in these boreal forests (Cyr et al., 2005; Ohlson et al., 2009; Hart and Luckai, 2014; Soucémarianadin et al., 2015a), consistent with the authors’ field experience. Thus with a few exceptions, our sampling depths would have captured most of the charcoal in the organic horizon (sometimes also referred to as “forest floor” or “organic layer”) and upper mineral soil. Investigation of charcoal or other forms of PyC in deeper mineral horizons was beyond the scope of our study.
Inspection of the depth profiles showed that for some monoliths, sampling was probably not deep enough to capture the charcoal peak at the organic/mineral interface (e.g., JP-HI-76B and JP-HI-135B). To quantify how likely charcoal abundance was underestimated, we identified (star-shaped symbols in
Figure 2) all monoliths whose deepest 1-cm horizon contained a significant proportion (>10%) of the total charcoal mass and that also had a significant amount of charcoal: >10 g m−2: 1 star; >15 g m−2: 2 stars; >20 g m−2: 3 stars; >25 g m−2: 4 stars.
Monoliths that most likely under-sampled the charcoal (4 stars) are identified as open bars in Figure 1.
Chemical Analysis
From a large number of mostly very small samples, 30 samples for chemical analysis were obtained by selecting the largest samples and also by making composites. Examination of the depth distribution showed that most charcoal, especially from high-severity fires, was concentrated in one layer at or near the organic-mineral interface. In most cases, composites were made of 2–4 samples representing the peak of charcoal content for a single monolith. In a few cases where sample amount was very limited, composites were assembled from two monoliths of the same site but from similar points in the charcoal vs. depth profile. In all cases, samples used for composites were similar in color and morphology. Samples were then ground by hand using a mortar and pestle, and dried at 70◦C.
Because of the need for a reasonable amount of sample for chemical analysis, samples largely represent monoliths with >800 kg ha−1 charcoal, although some very small samples were taken to capture older sites and layers from low-severity fires.
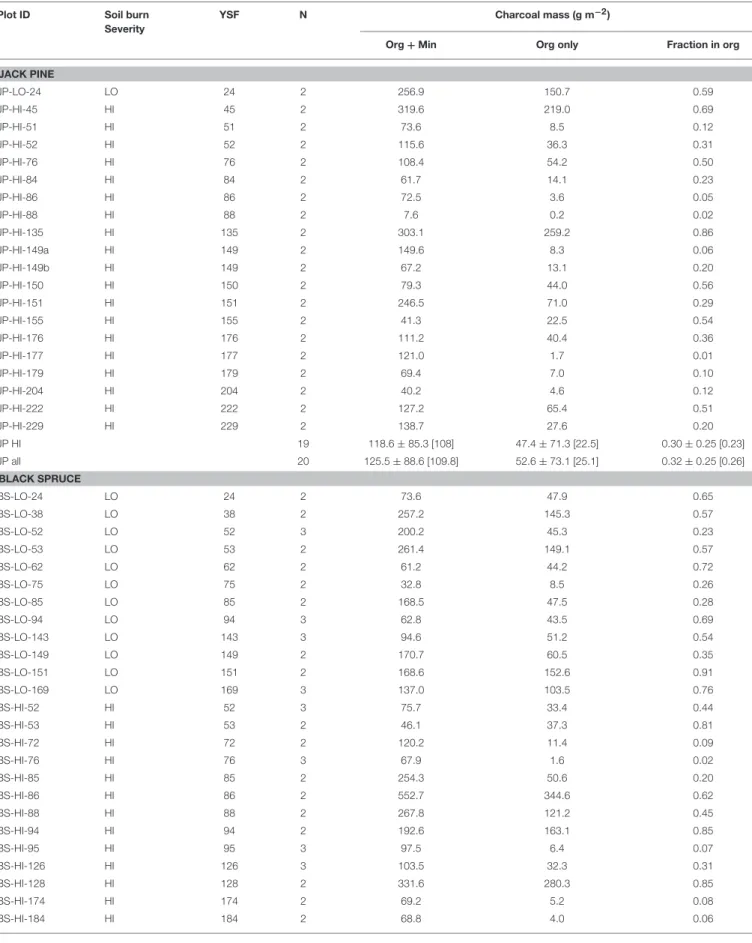
TABLE 1 | Characteristics of the chronosequence stands.
Plot ID Soil burn
Severity
YSF N Charcoal mass (g m−2)
Org + Min Org only Fraction in org
JACK PINE JP-LO-24 LO 24 2 256.9 150.7 0.59 JP-HI-45 HI 45 2 319.6 219.0 0.69 JP-HI-51 HI 51 2 73.6 8.5 0.12 JP-HI-52 HI 52 2 115.6 36.3 0.31 JP-HI-76 HI 76 2 108.4 54.2 0.50 JP-HI-84 HI 84 2 61.7 14.1 0.23 JP-HI-86 HI 86 2 72.5 3.6 0.05 JP-HI-88 HI 88 2 7.6 0.2 0.02 JP-HI-135 HI 135 2 303.1 259.2 0.86 JP-HI-149a HI 149 2 149.6 8.3 0.06 JP-HI-149b HI 149 2 67.2 13.1 0.20 JP-HI-150 HI 150 2 79.3 44.0 0.56 JP-HI-151 HI 151 2 246.5 71.0 0.29 JP-HI-155 HI 155 2 41.3 22.5 0.54 JP-HI-176 HI 176 2 111.2 40.4 0.36 JP-HI-177 HI 177 2 121.0 1.7 0.01 JP-HI-179 HI 179 2 69.4 7.0 0.10 JP-HI-204 HI 204 2 40.2 4.6 0.12 JP-HI-222 HI 222 2 127.2 65.4 0.51 JP-HI-229 HI 229 2 138.7 27.6 0.20 JP HI 19 118.6 ± 85.3 [108] 47.4 ± 71.3 [22.5] 0.30 ± 0.25 [0.23] JP all 20 125.5 ± 88.6 [109.8] 52.6 ± 73.1 [25.1] 0.32 ± 0.25 [0.26] BLACK SPRUCE BS-LO-24 LO 24 2 73.6 47.9 0.65 BS-LO-38 LO 38 2 257.2 145.3 0.57 BS-LO-52 LO 52 3 200.2 45.3 0.23 BS-LO-53 LO 53 2 261.4 149.1 0.57 BS-LO-62 LO 62 2 61.2 44.2 0.72 BS-LO-75 LO 75 2 32.8 8.5 0.26 BS-LO-85 LO 85 2 168.5 47.5 0.28 BS-LO-94 LO 94 3 62.8 43.5 0.69 BS-LO-143 LO 143 3 94.6 51.2 0.54 BS-LO-149 LO 149 2 170.7 60.5 0.35 BS-LO-151 LO 151 2 168.6 152.6 0.91 BS-LO-169 LO 169 3 137.0 103.5 0.76 BS-HI-52 HI 52 3 75.7 33.4 0.44 BS-HI-53 HI 53 2 46.1 37.3 0.81 BS-HI-72 HI 72 2 120.2 11.4 0.09 BS-HI-76 HI 76 3 67.9 1.6 0.02 BS-HI-85 HI 85 2 254.3 50.6 0.20 BS-HI-86 HI 86 2 552.7 344.6 0.62 BS-HI-88 HI 88 2 267.8 121.2 0.45 BS-HI-94 HI 94 2 192.6 163.1 0.85 BS-HI-95 HI 95 3 97.5 6.4 0.07 BS-HI-126 HI 126 3 103.5 32.3 0.31 BS-HI-128 HI 128 2 331.6 280.3 0.85 BS-HI-174 HI 174 2 69.2 5.2 0.08 BS-HI-184 HI 184 2 68.8 4.0 0.06 (Continued)
TABLE 1 | Continued
Plot ID Soil burn
Severity
YSF N Charcoal mass (g m−2)
Org + Min Org only Fraction in org
BS-HI-365 HI 365 2 64.7 0.1 0.00 BS-HI-710 HI 710 3 252.7 58.9 0.23 BS-HI-790 HI 790 2 5.8 0.0 0.00 BS-HI-1225 HI 1225 3 16.4 1.6 0.10 BS-HI-1585 HI 1585 2 5.0 0.5 0.10 BS-HI-2355 HI 2355 2 82.2 2.1 0.03 BS LO 12 140.7 ± 76.7 [152.7] 74.9 ± 49.3 [49.5] 0.54 ± 0.22 [0.57] BS HI 19 140.8 ± 138.3 [82.2] 60.8 ± 99.5 [11.4] 0.28 ± 0.30 [0.10] BS all 31 140.8 ± 116.7 [97.5] 66.3 ± 83.0 [44.2] 0.38 ± 0.30 [0.31] All sites 51 134.8 ± 105.9 [103.5] 60.9 ± 78.8 [37.3] 0.36 ± 0.28 [0.29]
Plot identification (Plot ID) includes stand type (BS, black spruce; JP, jack pine), soil burn severity (HI, high; LO, low), and years since fire (YSF). N is the number of monoliths sampled per plot. Charcoal mass (mean ± standard deviation [median]) is given for the organic layer only (Org only) and for the whole profile, which includes the organic and mineral horizons (Org + Min). The fraction of charcoal in the organic layer is also given.
Total C and N were determined on a Fisons NA1500 (Thermo Fisher Scientific Inc., Waltham MA) combustion analyzer using Costech EAS32 software (Costech Analytical Technologies Inc., Valencia, CA) for data collection and processing. Typically, 10– 15 mg of finely ground sample was sealed into tin cups containing 3–4 mg of ACS grade vanadium pentoxide as combustion accelerant. The methods were validated by using NIST certified reference materials, which for plant tissue and high organic soils are NIST 1515 (Apple), 1575 (Pine), 1547 (Peach) and 1567a (Wheat Flour). Ash was determined by heating at 600◦C in a
muffle furnace for 18 h.
For analysis by ICP (inductively coupled plasma) spectrometry, samples were digested in 10 mL concentrated nitric acid spiked with Y and/or Sc internal standards using the SCP Science (Baie D’Urfé, Quebec, Canada) NovaWave closed-vessel microwave system with quartz tubes sealed with teflon caps. Samples were then finished with the addition of 4 mL concentrated hydrochloric acid and deionized water to approximately 50 mL. This procedure was developed with minor modifications from previous studies showing that the nitric acid digestion without H2O2 captures most macro and micro
nutrients in plants, soils and related materials (Wu et al., 1997; Araújo et al., 2002; Sandroni and Smith, 2002). A 100% complete digestion is not possible, mainly due to the inability for the acid mixture to digest silicates, so that elements such as Al and Fe may not be fully released without inclusion of HF. Good agreement was found for two plant reference materials, and in an inter-laboratory proficiency testing program, results were close to the median (n = 27) for all reported elements. The ICP analysis was carried out on a Thermo Duo 6500 ICP equipped with CETAC autosampler and controlled by Thermo iTEVA instrument control and data acquisition software (Thermo Fisher Scientific Inc., Waltham MA). Instrument calibration was performed and verified by independent mixed NIST-traceable ICP standards prior to every analytical run using analyte/internal standard intensity ratios.
C-13 NMR
Solid-state carbon-13 NMR spectra were obtained for samples selected to represent different stand types, ysf and fire severity, the choices being limited by the large amount of time required to run samples, and also by the need for sufficient sample quantity. Spectra were acquired with variable-amplitude cross-polarization (VACP,Peerson et al., 1993) and magic-angle spinning (MAS) on a 4.7 T Chemagnetics CMX Infinity 200 NMR spectrometer (Agilent, Loveland CO, formerly Varian, Ft. Collins CO) at 50.3 MHz with MAS at 14 kHz in a rotor of 4.0 mm outside diameter. The spectra were acquired with two-pulse phase modulation (TPPM) decoupling (Preston et al., 2014a), a1H 90◦pulse of 2.5
µs, 1 ms contact time, 34 ms acquisition time, 3 s recycle delay, and acquisition of 27,000 to 32,000 transients. After background correction, spectra were processed with 100 Hz line-broadening and baseline correction (Preston et al., 2014a).
Spectra were divided into the following chemical-shift areas: 0–47 ppm, alkyl C; 47–110 ppm, O, N-alkyl and di-O-alkyl C; 110–165 ppm, aryl C comprising aromatic and phenolic C; 165– 210 ppm, carboxyl, amide and ester C. The di-O-alkyl signal typical of C-1 of carbohydrates was not separated from the broad aryl C peak, and was sometimes only a broad residual shoulder. Thus, rather than using a vertical boundary, a baseline for the di-O-alkyl region was sketched in to allow a more accurate estimate of this region. Relative areas were determined by copying the spectra, and cutting and weighing the spectral regions, an old technique that is still useful for spectra with low signal-to-noise ratios (Preston, 2014; Preston et al., 2014a). Aromaticity was calculated as the ratio of intensities 110–165 ppm/0–165 ppm. Relative areas and aromaticity were treated qualitatively to show trends, as CP efficiency varies for different C structures and environments. The VACP technique helps to overcome this, but compared to quantitative direct-polarization (DP) spectra, CP spectra underestimate aromatic C without attached hydrogens although as samples become almost completely aromatic the effect is diminished (Preston, 2014).
FIGURE 1 | Charcoal content for the two or three individual monoliths sampled at each site. Open bars indicate monoliths where the charcoal content was likely underestimated (indicated with 4 stars in Figure 2). Refer to Table 1 for explanation of plot identification (Plot ID).
RESULTS
Amounts and Depth Distribution
Charcoal content ranged over 100-fold, from 5 to 553 g m−2for the whole profiles and 0.01 to 345 g m−2 for the organic layer
only (site means; Table 1). The older sites generally had lower charcoal stocks, but only a few sites were older than 400 ysf. There was also very high variability in charcoal content between monoliths within each plot (Figure 1).The depth profiles for individual pits showed a peak in charcoal concentration close to the organic-mineral interface, typically around −2 to 2 cm (Figure 2) but a few profiles showed a deeper peak (e.g., plot BS-HI-52A at −5 cm). In addition to the charcoal peak at the organic-mineral interface, LO black spruce sites also had charcoal layers in the residual organic layer (Figure 2C). Because the soils were sampled with the original intent of reconstructing fire history and not charcoal stocks and depth distribution, the maximum sampling depth in the mineral soil was variable. As a result, some charcoal peaks may have been missed in some sites (indicated by stars in Figure 2), leading to an underestimation of charcoal stocks in those sites (indicated by open bars in Figure 1).
Chemical Properties
In charcoal samples taken in organic and mineral horizons, total C ranged from 429 to 700 mg g−1(mean = 569), total N from 1.0
to 8.4 mg g−1(mean = 4.1) and the C/N ratio (molar) from 71 to
646 (mean = 140; Table 2). Due to the small amounts of sample available, ash was not determined on the four oldest samples, but for the others (n = 26) ranged from 46 to 311 mg g−1. On an ash-free basis, means were 676 mg g−1for total C and 4.5 mg g−1
for total N. Our field data indicated weak trends for decreases in charcoal C (P = 0.1021), and increases in charcoal N (P = 0.0084) and ash (not shown), as well as a more distinct decline of the C/N ratio (P = 0.0150) with ysf (Figure 3).
Concentrations of other elements in charcoal, except for the four oldest samples, are shown in Table 3. Highest values were generally found for potassium, calcium, aluminum and iron and lowest for zinc, copper and boron. There appeared to be little variation in concentration with ysf, although iron and aluminum tended to increase with ysf.
C-13 NMR
Interpretation of the NMR spectra is based on previous studies of wood, organic matter and effects of charring (Baldock and Smernik, 2002; Czimczik et al., 2002; McBeath et al., 2011; Merino et al., 2015; Santín et al., 2016b). All of the13C CPMAS
spectra have broad peaks for aromatic C at approximately 127 ppm and at 31–34 ppm for alkyl C (Figure 4). There is considerable variation in the O/N- and di-O-alkyl regions, with some samples retaining sharp peaks characteristic of cellulose. These are most distinct for sample JP-HI-45, at 63 and 66 ppm for C6, 75 ppm for C2, C3, and C5, 84 and 89 ppm for C4, and 106 ppm for C1. Samples BS-HI-128 and BS-HI-88 also retain sharp features at 75, 88, and 106 ppm, but lack the splitting due to more crystalline and more disordered cellulose. Other samples show less intensity due to cellulose or carbohydrate, especially the two oldest samples (BS-HI-710 and BS-HI-2355). The phenolic region mostly appears as a weak shoulder of the aromatic signal around 150 ppm but even this cannot be seen for the oldest sample BS-HI-2355. Carboxyl signals are generally broad and weak, with samples BS-LO-151 and BS-HI-2355 having the most distinct peaks at 176 ppm.
FIGURE 2 | Depth distributions of charcoal by 1-cm increments for each monolith in (A) jack pine, (B) low-severity black spruce, and (C) high-severity black spruce sites. The black horizontal bars represent charcoal mass up to a value of 125 g m−2; when charcoal mass exceeds this value, the exact value is indicated in small white characters. The green area above the organic-mineral interface (dashed line at depth = 0) represents the organic layer, and the gray area below the interface represents the mineral soil that was sampled. For some monoliths, sampling was probably not deep enough to capture the charcoal peak (e.g., JP-HI-76B and JP-HI-135B). To quantify how likely charcoal abundance was underestimated, we identified (star-shaped symbols) all monoliths whose deepest 1-cm horizon contained a significant proportion (>10%) of the total charcoal mass and that also had a significant amount of charcoal: >10 g m−2: 1 star; >15 g m−2: 2 stars; >20 g m−2: 3 stars; >25 g m−2: 4 stars. Monoliths that most likely under-sampled the charcoal (4 stars) are identified as open bars in Figure 1.
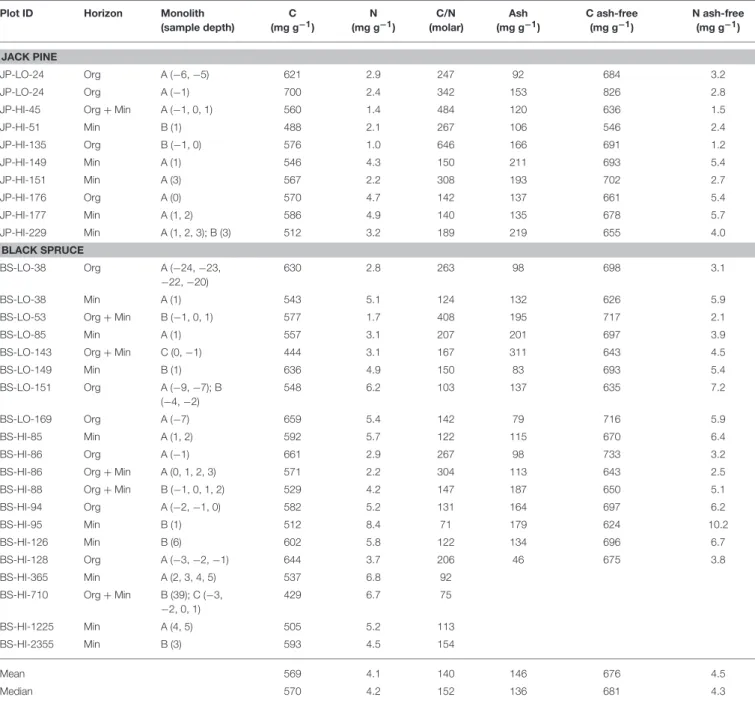
TABLE 2 | Chemical composition of charcoal samples >2 mm extracted from organic (Org) or mineral (Min) horizons.
Plot ID Horizon Monolith
(sample depth) C (mg g−1) N (mg g−1) C/N (molar) Ash (mg g−1) C ash-free (mg g−1) N ash-free (mg g−1) JACK PINE JP-LO-24 Org A (−6, −5) 621 2.9 247 92 684 3.2 JP-LO-24 Org A (−1) 700 2.4 342 153 826 2.8
JP-HI-45 Org + Min A (−1, 0, 1) 560 1.4 484 120 636 1.5
JP-HI-51 Min B (1) 488 2.1 267 106 546 2.4 JP-HI-135 Org B (−1, 0) 576 1.0 646 166 691 1.2 JP-HI-149 Min A (1) 546 4.3 150 211 693 5.4 JP-HI-151 Min A (3) 567 2.2 308 193 702 2.7 JP-HI-176 Org A (0) 570 4.7 142 137 661 5.4 JP-HI-177 Min A (1, 2) 586 4.9 140 135 678 5.7 JP-HI-229 Min A (1, 2, 3); B (3) 512 3.2 189 219 655 4.0 BLACK SPRUCE BS-LO-38 Org A (−24, −23, −22, −20) 630 2.8 263 98 698 3.1 BS-LO-38 Min A (1) 543 5.1 124 132 626 5.9
BS-LO-53 Org + Min B (−1, 0, 1) 577 1.7 408 195 717 2.1
BS-LO-85 Min A (1) 557 3.1 207 201 697 3.9
BS-LO-143 Org + Min C (0, −1) 444 3.1 167 311 643 4.5
BS-LO-149 Min B (1) 636 4.9 150 83 693 5.4 BS-LO-151 Org A (−9, −7); B (−4, −2) 548 6.2 103 137 635 7.2 BS-LO-169 Org A (−7) 659 5.4 142 79 716 5.9 BS-HI-85 Min A (1, 2) 592 5.7 122 115 670 6.4 BS-HI-86 Org A (−1) 661 2.9 267 98 733 3.2
BS-HI-86 Org + Min A (0, 1, 2, 3) 571 2.2 304 113 643 2.5
BS-HI-88 Org + Min B (−1, 0, 1, 2) 529 4.2 147 187 650 5.1
BS-HI-94 Org A (−2, −1, 0) 582 5.2 131 164 697 6.2
BS-HI-95 Min B (1) 512 8.4 71 179 624 10.2
BS-HI-126 Min B (6) 602 5.8 122 134 696 6.7
BS-HI-128 Org A (−3, −2, −1) 644 3.7 206 46 675 3.8
BS-HI-365 Min A (2, 3, 4, 5) 537 6.8 92
BS-HI-710 Org + Min B (39); C (−3, −2, 0, 1) 429 6.7 75 BS-HI-1225 Min A (4, 5) 505 5.2 113 BS-HI-2355 Min B (3) 593 4.5 154 Mean 569 4.1 140 146 676 4.5 Median 570 4.2 152 136 681 4.3
The younger samples (38–229 ysf) show a wide range in intensity distribution (Table 4), whereas the two oldest samples (710 and 2,355 ysf) are higher in aromatic C, with a loss of other structures. The oldest sample (2,355 ysf) has the highest proportion of aryl C (71%) and aromaticity (0.79). The CP spectra underestimate aromatic C without attached hydrogens; this effect is more important for samples high in O and di-O-alkyl C including carbohydrate but becomes less important as the proportion of aromatic C increases (Baldock and Smernik, 2002; Czimczik et al., 2002; Ascough et al., 2008; McBeath et al., 2011; Preston, 2014; Preston et al., 2014a,b). Our spectra indicate a trend to higher aromaticity with increasing ysf (not shown), but obviously, the low sample size, especially at higher ysf and the
qualitative aspect of the NMR areas does not allow us to establish statistical inference.
DISCUSSION
C and N in Field Charcoal Samples
Our values for total C concentrations in charcoal are in keeping with those compiled from the literature (Table S1) for field samples from temperate and boreal regions. A survey of sites sampled from immediately after fire to >500 ysf gave a mean value of 584 mg g−1for C, with a lower mean of 534 mg g−1for
field sites ≥28 ysf. Some of the highest values, around 800 mg g−1, come from wood and bark burned outside to provide a
FIGURE 3 | Trends in charcoal C, N, and C/N ratio (molar) with ysf for this study (solid symbols) and for field data taken from the literature (open symbols). Linear regression on log-transformed ysf+1 is shown for all data (A–C) and for the time period (20–1,000 ysf) common to both datasets (D–F). Data fromSchiffman and Johnson (1989),Eckmeier et al. (2007),Ohlson et al. (2009)plus pers comm.,Alexis et al. (2010),Clay and Worrall (2011),Briggs et al. (2012),Finkral et al. (2012),
Buma et al. (2014),Hart and Luckai (2014),Santín et al. (2015, 2016b)plus pers comm.,Soucémarianadin et al. (2015b).
baseline sample (Ohlson et al., 2009) and from burning of slash piles (Finkral et al., 2012), both of which are likely to generate more extensive transformation than in most wildfires. Total N values in this study (mean 4.1 mg g−1) were at the lower end
of those reported in the literature, which are on average 7.4 mg g−1 for all years (0 to >500 ysf) and 6.2 mg g−1 for sites 28
years and older (Table S1). Charcoal C, N, and C/N values from the literature are very variable immediately and soon after fire, but converge with increasing ysf (Figures 3A–C). Trends in N with ysf in the literature appear to be opposite of the trend found in this study (Figure 3B); however, both datasets showed the same trend when only their common ysf period (20–1,000) was considered (Figure 3E). Trends of increasing N
concentration and decreasing C/N ratio are similar to those seen in decomposition of foliar litter (Moore et al., 2011) and wood over both short time scales of ca. 20 years (Preston et al., 2012) and centuries (Preston et al., 1998) corresponding to the timescales in this study.
C and N Comparison with Laboratory Char
Studies
To gain some insight into factors influencing field samples, we compiled total C and N values for a range of laboratory charring experiments of coniferous substrates (Table S2). Despite the wide range of substrates (mostly clean wood, sometimes including bark), and the resulting differences in ash content, as
TABLE 3 | Elemental composition of charcoal samples >2 mm determined by ICP (A) for this study and (B) in the literature.
Plot ID Ca Mg K Na Fe Al P Mn Zn Cu B S
(g kg−1) (g kg−1) (g kg−1) (g kg−1) (g kg−1) (g kg−1) (mg kg−1) (mg kg−1) (mg kg−1) (mg kg−1) (mg kg−1) (mg kg−1)
(A) THIS STUDY Jack pine JP-LO-24a 4.69 0.48 52.7 1.01 0.28 0.39 102 195 39 84 47 446 JP-LO-24b 10.7 0.53 66.8 0.88 0.32 0.52 60 47 59 10 1.1 205 JP-HI-45 2.58 0.40 59.9 0.38 1.09 1.34 142 44 30 35 1.0 244 JP-HI-51 2.79 0.33 57.0 0.48 1.29 2.70 132 133 33 26 3.9 314 JP-HI-135 4.99 0.49 82.7 0.38 0.96 0.93 158 136 37 9.8 <0.4 285 JP-HI-149 1.89 0.39 87.3 0.50 4.78 2.16 160 12 42 7.8 4.9 195 JP-HI-151 2.84 0.46 85.4 0.43 2.60 6.22 212 16 19 7.9 <0.4 302 JP-HI-176 4.27 0.61 45.8 0.15 5.06 3.81 271 73 35 11 3.6 291 JP-HI-177 2.31 0.55 48.3 0.32 5.53 3.79 292 25 31 25 10 382 JP-HI-229 3.65 1.22 53.8 0.39 11.1 5.38 147 58 34 75 3.9 246 Black spruce BS-LO-38a 4.90 0.44 54.9 0.19 0.47 1.14 194 85 33 6.0 1.4 368 BS-LO-38b 25.8 1.65 32.8 0.12 12.5 5.38 408 182 37 6.3 7.0 787 BS-LO-53 3.70 0.30 88.7 0.34 2.37 1.26 107 14 23 8.9 <0.4 182 BS-LO-85 2.16 0.53 82.6 0.47 5.19 3.57 189 39 23 14 <0.4 296 BS-LO-143 5.45 2.83 57.3 0.48 21.1 16.3 335 66 40 61 1.8 313 BS-LO-149 1.88 0.35 37.4 0.30 1.34 1.54 586 325 26 14 2.4 360 BS-LO-151 32.6 1.78 20.1 15.5 2.62 4.08 172 223 6.9 186 1.2 353 BS-LO-169 15.1 1.24 28.4 0.11 5.16 0.64 147 61 28 9.8 9.5 303 BS-HI-85 6.91 1.26 23.7 0.19 10.4 5.58 266 43 16 10 6.8 498 BS-HI-86a 2.10 0.24 52.4 0.30 0.15 0.63 131 149 77 22 1.8 235 BS-HI-86b 2.43 0.43 56.9 0.38 2.43 2.43 152 86 39 18 1.4 243 BS-HI-88 23.2 2.12 46.1 0.30 8.20 5.36 258 1192 42 14 1.2 407 BS-HI-94 1.91 0.39 79.9 0.29 3.60 2.12 230 86 19 14 0.5 245 BS-HI-95 1.44 0.61 0.53 62.2 3.77 3.24 347 55 41 13 3.4 281 BS-HI-126 2.13 0.58 0.55 13.1 2.54 1.66 110 95 47 20 2.6 243 BS-HI-128 2.13 0.41 0.66 7.52 0.22 0.36 71 98 31 18 1.9 230 Mean 6.72 0.79 50.1 4.11 4.43 3.17 207 136 34 28 4.7 317 Median 3.24 0.51 53.2 0.38 2.61 2.29 166 79 34 14 1.9 293 (B) PUBLISHED STUDIES
aBiochar, maple/spruce sawdust,
773 g kg−1C
2.42 0.29 1.24 75 200
bBiochar, lodgepole pine chips, 802 g
kg−1C
10.9 1.79 6.72 525 230
cFresh char, Larix decidua wood,
760 g kg−1C
5.91 1.52 2.91 0.21 308
dFresh wood and bark (unspecified) 1.78 0.21 0.71 0.02 0.085 0.083 87 298 21 2.1
eBlack spruce stemwood 1.41 0.19 0.43 70
eBlack spruce branch 0.75 0.40 1.34 400
eBlack spruce bark 1.39 0.42 1.54 470
eJack pine stemwood 0.68 0.13 0.45 50
eJack pine branch 2.16 0.40 1.55 290
eJack pine bark 4.61 0.42 1.15 260
Location (horizon: organic vs. mineral) and depth of samples are the same as in Table 2.
aSackett et al. (2015);bRobertson et al. (2012);cCriscuoli et al. (2017);dBaernthaler et al. (2006);eParé et al. (2013).
well as variation in substrate size, charring apparatus, duration and oxygen exposure, resulting total C values follow a fairly consistent trend (Figure 5A). Trends in total N (not shown) and
C/N (Figure 5B) were more difficult to discern, partly due to fewer reports of total N in studies, as well as large variations in N concentrations in starting materials. Two of the series (Baldock
FIGURE 4 | Solid-state13C CPMAS NMR spectra of representative samples.
and Smernik, 2002; Hart and Luckai, 2014) show similar values and a trend of decreasing C/N with increasing temperature, whereas data from other studies (Soucémarianadin et al., 2013; Wolf et al., 2013; Hatton et al., 2016; Pingree et al., 2016) show little change as the initial C/N values were much lower. The value fromBriggs et al. (2012)is unusually high but with only a single point in their study, we do not know how C/N evolved with charring. The laboratory charring data are thus consistent with field observations which show wide variation in C/N for younger samples, likely resulting from both variations in substrate composition and heating exposure. The few values for older field samples suggest convergence to lower C/N values; this could result from a multiplicity of factors, including lower C/N values in the initial fuel, longer survival of fuel charred under hotter temperatures or absorption of N during field exposure.
Overlaying our total C concentrations onto Figure 5A shows that most of the values fall between 490 and 660 g kg−1,
corresponding to laboratory chars produced at <300◦C. Most
of the laboratory chars were lower in ash, and the bulk of our ash-free C values fall in with those produced around 350–450◦C
(Figure 5A). These are within the temperature ranges suggested from attempts to develop a “molecular thermometer” based on the ratio of BPCA products with 5 vs. 6 carboxyl groups (B5CA/B6CA;Wolf et al., 2013).Wolf et al. (2013)classified three typical fire temperature regimes: grass and forest groundfires at 285 ± 143◦C, shrubland fires at 503 ± 211◦C, and domestic fires
at 797 ± 165◦C. However, other field observations, especially for
crown fires, show that substrates may experience much higher temperatures, albeit briefly. In an experimental crown fire near Fort Providence NWT, Canada, dataloggers showed a pattern of
TABLE 4 | Relative intensity of chemical-shift regions of solid-state13C CPMAS NMR spectra of char samples.
Plot ID Chemical shift region (ppm) Aromaticitya
% of total area 0–47 47–110 110–165 165–210 JP-HI-45 24 35 38 3 0.39 JP-HI-135 22 22 51 4 0.54 JP-HI-229 21 20 50 8 0.55 BS-LO-38 18 20 54 8 0.58 BS-LO-151 8 17 62 13 0.72 BS-HI-88 21 24 48 6 0.52 BS-HI-128 27 30 40 4 0.42 BS-HI-710 19 19 56 7 0.60 BS-HI-2355 8 11 71 10 0.79
aRatio of intensities in ppm regions: 110–165/0–165.
a very steep initial temperature rise followed by a slower rate of cooling, which was very difficult to reproduce in a subsequent laboratory charring experiment (Santín et al., 2013). Maximum temperatures in the organic horizon ranged from 550 to 976◦C,
with average durations of 150, 100, and 60 s above 370, 470, and 570◦C, respectively. Similar results were found in experimental
burns of open savanna woodland in northern Australia (Saiz et al., 2014). Physical and chemical properties of charred pitch pine (Pinus rigida) wood collected after a prescribed burn in New Jersey were also consistent with charring conditions of a quick rise (650◦C h−1) to a final temperature of 500–600◦C (Brown et al., 2006). Thermosensitive paints recorded temperatures from 371 to 760◦C with a mean of 493◦C during prescribed burning
of a Florida scrub-oak site (Alexis et al., 2007). Righi et al. (2009)noted that many aluminum plates used for tagging stems melted during their slash-and-burn fire, indicating that the temperatures must have exceeded 660◦C. Thus, even though total
C concentrations of our charcoal samples are consistent with fairly low formation temperatures in the laboratory, it is likely that at least some fuel may have been exposed to much higher temperatures, (see further discussion of NMR).
Chemistry—Other Elements
No comparable multi-element compositional data were located for wildfire char. Many studies of wood and/or bark ash are available (e.g., Ingerslev et al., 2011; Omil et al., 2013; Brais et al., 2015; Hansen et al., 2016) but these show highly variable properties, and are lower in total C than our samples. They also tend to be higher in elements such as Ca, Fe, Al and heavy metals, due to factors such as soil contamination of logging waste, mixing of sand or soil in fluidized bed combustion and presumably contact with heated metal surfaces. Three biochar preparations (primarily from softwood;Robertson et al., 2012; Sackett et al., 2015; Criscuoli et al., 2017) had Ca, Mg, P, and S concentrations comparable to our median values, but our K concentrations were much higher (Table 3B). Additional expectation of the composition of wildfire chars may be found by comparison of fresh biomass, and of element recoveries
FIGURE 5 | Chemical properties reported from laboratory charring experiments for coniferous substrates: (A) charcoal total C and (B) C/N ratio (molar). Data in (A) fromBaldock and Smernik (2002),Czimczik et al. (2002),
Gundale and DeLuca (2006),Ascough et al. (2008),Briggs et al. (2012),
Bergeron et al. (2013),Kasin and Ohlson (2013),Soucémarianadin et al. (2013),Wolf et al. (2013),Hart and Luckai (2014),McBeath et al. (2015)plus pers comm.,Hatton et al. (2016), andPingree et al. (2016). Our data for charcoal total C (whole sample and ash-free basis) are overlaid to give a general indication of how they might correspond to those of char samples produced under laboratory conditions.
in ash of heating plants. A study of “ash-forming elements” in an unspecified wood/bark mixture showed that the highest concentrations were for Ca, K, Mn, and Mg (Baernthaler et al., 2006, Table 3B), and reasonably similar values were reported for Ca, Mg, and P in stemwood, branches and bark of black spruce and jack pine (Paré et al., 2013, Table 3B). Recovery of nutrients in bottom and fly ash of a heating plant was quite high (Ingerslev et al., 2011), with >75% for P, Ca, Mg, Mn, and Cu, > 50% for K, Al, and Fe, and >30% for S and Na. Thus, compositions of our samples, especially of the younger chars, are in line with reasonable trajectories of formation and change with time. Our K concentrations (median 53.2 g kg−1)
are much higher than might be expected from these studies, although some similarly high K values are reported elsewhere for ash (Ingerslev et al., 2011; Hansen et al., 2016). Char samples from our sites could be a source of major and minor nutrient elements.
NMR
Similar to C and N values determined on a larger sample set, the nine NMR spectra obtained show a wide variation in appearance and intensity distribution for the younger samples, whereas the oldest samples generally have higher aromaticity and simpler features, with greater dominance of the aryl C signal around 130 ppm. These structural variations are consistent with observations of increasing aromaticity with temperature in laboratory charring studies (Baldock and Smernik, 2002; Czimczik et al., 2002; Ascough et al., 2008; Soucémarianadin et al., 2013; Hart and Luckai, 2014). Organic horizon/biomass char produced in field settings (wildfire or prescribed fire) also shows a range of intensity distributions depending on fire severity, from little alteration to high aromaticity (Nocentini et al., 2010; Miesel et al., 2015; Soucémarianadin et al., 2015b). Similar to laboratory charring, samples referenced to actual temperatures documented in the field show increasing aromaticity with temperature (Alexis et al., 2010; Santín et al., 2016b), and illustrate the variability in formation conditions.
There is little information on NMR characteristics of boreal forest char with varying ysf. Most similar to our study is a series of five13C CPMAS NMR spectra (Hart and Luckai, 2014),
which also shows considerable variation in the younger samples (14, 28, and 90 ysf), whereas the two oldest samples (140 and 208 ysf) have the highest proportions of aromatic C (we do not compare relative areas or aromaticity directly due to the different conditions used to acquire spectra which influence the relative areas, especially for CP spectra).Soucémarianadin et al. (2015a) also found that aromatic C was higher in the highly humified H (American Oa) horizon and where it could be separated, in “historical” PyC which sometimes formed a distinct layer at the interface with the mineral soil. Similarly, charcoal fragments picked out from the black spruce organic horizon in northern Manitoba were much more aromatic than the bulk material, especially when characterized by quantitative DP rather than CP NMR (Preston et al., 2014b). In addition to complexities in direct comparison of NMR data, perusal of the various studies of laboratory and field charring indicate that increase in aromaticity and loss of other spectra features may occur at lower temperatures for clean wood compared to the more complex substrates such as organic horizon or bark-wood mixtures (Baldock and Smernik, 2002; Czimczik et al., 2002; McBeath et al., 2011; Merino et al., 2015; Santín et al., 2016b). Also, laboratory chars are often produced by pyrolysis in an inert atmosphere and with long duration, compared to the short exposure, oxygen availability and rapid temperature change more characteristic of a fast-moving field event (Santín et al., 2013; Saiz et al., 2014). For example, samples subjected to maxima of 683◦C and even 950◦C during an experimental crown fire
still had considerable intensity in other NMR regions (Santín et al., 2016b), whereas laboratory chars produced at 600◦C were
completely aromatic. They concluded that structural changes in field fire situations may have required higher temperatures than corresponding changes induced during laboratory charring.
These issues aside, data on charcoal total C, N, and organic C composition for a range of field and laboratory studies indicate wide variation in the initial properties of
charred material, due to both initial material type and to heating conditions. With time, however, properties become more consistent, including a trend to higher aromaticity. This could be due to longer survival of more highly transformed components, or possibly to loss of more labile structures with time, leaving the more aromatic and polycondensed components. All of these questions should be fodder for further investigation.
Comparison of Amounts
Our results for amounts of charcoal are underestimates as they included only fragments <2 mm and sampling of mineral soil was inconsistent. However, our data are unique in the large number of sites, the length of the chronosequence, and the fine resolution by depth. Comparison with other studies is challenging, as sampling protocols varied, including the range of charcoal size extracted, the exact definition of “charcoal” used in each study, and whether the sampling included upper mineral soil, or only organic horizon. These studies were similarly focused on fire and vegetation history, so that experimental design would not have been optimized to quantify charcoal stocks. However, in the absence of completely comparable studies, much insight can be gained from this imperfect exercise. Data were located for five studies (Table S3), four of which were located in boreal and predominantly coniferous forests in Norway and Sweden (Zackrisson et al., 1996; Ohlson et al., 2009; Kasin et al., 2013) and northern Ontario (Hart and Luckai, 2014). Another study of temperate and deciduous forests was included because it is close to the transition to the boreal in Quebec (Bélanger et al., 2004). In each study, charcoal or charred biomass were determined by visual criteria and picked out from organic horizon only (Zackrisson et al., 1996; Bélanger et al., 2004), in organic horizon plus some upper mineral soil (Ohlson et al., 2009; Kasin et al., 2013; Hart and Luckai, 2014), and in our study, sometimes from organic horizon only, but usually penetrating a short distance into the mineral soil. As shown in Figure 6A, our results for charcoal stocks vs. ysf are quite similar to those from five disparate studies. Also in line with the data in Figure 6A, a more recent study of Norway spruce (Ohlson et al., 2017), also of charcoal from organic horizon and upper mineral soil, showed an average stock of 930 kg ha−1in 10 plots, with charcoal having
an average radiocarbon age of 570 ± 102 y. Figure 6A shows widely variable charcoal stocks (0–5,000 kg ha−1) in the first
centuries after fire followed by lower values (0–2,000 kg ha−1)
afterwards. This sharp decline in maximum stock values in the first centuries after fire could be due in part to the decomposition of the less-transformed and thus most labile components of the visually-determined charcoal; the remaining, more recalcitrant components, would form a relatively stable charcoal stock in the following centuries.
Similar to our results, high spatial variability has been observed elsewhere (Ohlson et al., 2006, 2009, 2017; Kasin et al., 2017), as well as the common occurrence of charcoal/PyC at the interface of the organic and mineral layers (Cyr et al., 2005; Ohlson et al., 2009; Hart and Luckai, 2014; Soucémarianadin et al., 2015a). Our depth profiles also show charcoal layers within the organic horizon of some LO plots. These widespread trends
FIGURE 6 | Charcoal stocks (kg ha−1) for this study compared with data from five studies of mainly boreal, coniferous forest sites (A). The expansion (B) shows data from individual studies up to 800 ysf. The outer envelope of the data cloud (dashed line) was defined by selecting the 5% highest charcoal mass values for each 100-yr classes (up to 399 ysf: 0–99, 100–199, 200–299, and 300–399 ysf), and passing a logarithmic regression curve through these data points (R2: 0.80). Sources for (A) as shown in (B) plus pers. comm. from Stephen Hart.
can inform design of sampling strategies to optimize charcoal capture in boreal forests.
The more detailed comparison of stocks up to 790 ysf (Figure 6B) gives a better insight into the effects of sampling protocols. The lowest values are from Bélanger et al. (2004), which were for charcoal >2 mm in organic horizon only. Overlapping but somewhat higher values were found for organic horizon only, but without size exclusion on charcoal extraction (Zackrisson et al., 1996). The other three published studies included some mineral soil, with the higher values found for Kasin et al. (2013) and Hart and Luckai (2014). Data from Ohlson et al. (2009) included mineral soil of variable depth, with rigorous extraction of charcoal particles >125 µm; results span a wide range. Our data are for charcoal >2 mm, and mineral soil was not always sampled; they tend to fall among the lower values. Data from these disparate studies show that stocks can be highly variable, and that higher values are found when charcoal is not restricted to larger sizes, and also when upper mineral soil is included.
Our data are thus in reasonable agreement with published results; our stocks would have been higher if smaller size classes of charcoal had been extracted, and if all cores had been consistently sampled into the mineral soil. Like many studies, our results are only for charcoal on the ground, but fire also produces charred biomass on woody debris and standing stems (see below). With the passage of time, some of this char is transferred to the organic horizon as snags fall, or charred bark falls off (Boulanger and Sirois, 2006; Aakala et al., 2008; Angers et al., 2010, 2012; Boulanger et al., 2011) the process can cover several decades. Similarly to the dynamics of CWD production from snags and branches, sampling at longer ysf would include higher proportions of char originally produced above-ground.
Linking Estimates of Production
Can this assemblage of charcoal stocks be related to estimates of production? For Figure 6B, a logarithmic regression curve drawn through the 5% highest values defines an outer envelope that intersects the y-axis around 6,000 kg ha−1. This range is
not out of line with studies of charcoal production (Table S4). Studies on aerial deposition from experimental crown fires (Clark et al., 1998; Ohlson and Tryterud, 2000; Lynch et al., 2004) report low charcoal values (top of Table S4); however, these values do not represent production of charcoal from experimental crown fires, although they have often been cited as such. Rather, they represent the mass of charcoal particles captured in trays that were mainly outside the burned block, resulting in relatively low values. The objective of these studies was to understand transfer processes of airborne charcoal from a wildfire to nearby sediments.
Five studies from the Amazon region (Fearnside et al., 1993, 1999, 2001; Gráça et al., 1999; Righi et al., 2009) present a very different scenario; in keeping with local practice of slash-and-burn cultivation, most trees were felled, left to dry for some months and then burned. While this may seem remote from boreal wildfires, the comparison is not completely unreasonable, as wildfires also burn much down wood and stems close to the ground. The Brazilian studies were also thoroughly documented, with measurements of biomass before the fires, and a complete accounting of charcoal produced on the ground and on woody stems. The slash-and-burn study byEckmeier et al. (2007)was quite different, as it aimed to emulate Neolithic practices, so that stems >10 cm in diameter were removed before burning, and the plot was raked during the burn to encourage fuel consumption. The two prescribed fires were quite different, with Schiffman and Johnson (1989) representing operational conditions after harvest of loblolly pine (Pinus taeda), whereasAlexis et al. (2007)
describe burning of an oak shrubland in Florida (stems 2–3 m high) to reduce the danger of wildfire. The only experimental crown fire study, carried out near Fort Providence (NWT, Canada) in 2012 (Santín et al., 2015), reported a value of 7900 kg ha−1of charcoal and, like the Brazilian slash-and-burn studies,
was a complete accounting of charred biomass in organic horizon (including ash), down wood, burned bark on stems, and charred canopy needles. Lastly, two studies exclusively determined char produced on down wood, the higher value (6,400 kg ha−1) being
TABLE 5 | Reported distribution of charcoal produced in fires conducted for research purposes.
Source* Location Type of fire** Total (kg ha−1) Percent of total
On ground Stems, total Stems, >10 cm Stems, <10 cm Stems, <5 cm Stems, 5–10 cm Downed wood Canopy needles
1 Amazonia (Brazil) S&B 2,200 68.2
2 Amazonia (Brazil) S&B 4,300 27.9 72.1 51.2 20.9
3 Amazonia (Brazil) S&B 6,400 48.4
4 Amazonia (Brazil) S&B 8,670 37.4 62.6 54.3 8.3 1.9 6.5
5 Florida (USA) PB 2,369 57.5 42.9 42.9
6 NWT (Canada) ECF 7,900 41.9 29.1 22.1 7.0
*1,Fearnside et al. (1999); 2,Fearnside et al. (2001); 3,Gráça et al. (1999); 4,Righi et al. (2009); 5,Alexis et al. (2007); 6,Santín et al. (2015). **S&B, slash and burn; PB, prescribed burn; ECF, experimental crown fire.
from a wildfire in Yellowstone National Park (Tinker and Knight, 2000), and the two lower values from lodgepole pine sites that had burned once (394 kg ha−1) and twice (865 kg ha−1) in Oregon
(Donato et al., 2009).
Results from the above studies of total char production (all of the slash-and-burn, the shrubland prescribed fire, and the experimental crown fire) show a wide variation, from approximately 2,000–9,000 kg ha−1. The two studies of down wood show a similar, but somewhat lower range (approximately 400–6,400 kg ha−1), and the organic horizon charcoal from the
operational postharvest prescribed fire (Schiffman and Johnson, 1989) is 7,400 kg ha−1. Clearly, char production will depend
on the amount and nature of both the fuels and the fire, but these rather disparate studies nonetheless suggest that a complete accounting of surface and aboveground char from boreal wildfires might reasonably lie around the range of 5,000– 10,000 kg ha−1. Of the few studies partitioning distribution of
char from a single event, the four Brazilian studies reported 48–68% on wood >10 cm diameter, similar to the 43% reported by Alexis et al. (2007) on standing stems from his prescribed burn study (Table 5). Santín et al. (2015) reported 42% on the ground, 22% on down wood, 29% on burned stems (bark) and 7% as charred canopy needles, and the more detailed breakdown of data from Righi et al. (2009)
shows a similar proportion of 38% of char produced on the ground and the rest distributed among three size classes of wood.
Thus, it could be reasonably suggested that in boreal wildfires, around half to two-thirds of char production might initially be found on the organic horizon or forest floor and down wood, and most of the remainder on standing stems. Whereas charred needles presumably will fall within a short time and become part of the organic horizon or exposed mineral soil, charred wood and bark on standing trees may take several years to fall to the ground. This could explain in part the temporal patterns of charcoal stocks in organic horizon and surface mineral soil found in our postfire chronosequence, which show high variability and no distinct trend with time in the first 200 years or so (Figure 6). In the first few years after a fire, much of the char may still remain on snags or downed coarse wood and is thus not captured in organic horizon surveys, especially those designed to
study fire and vegetation history. As time goes on, bark flakes off, snags fall to the ground, and various sizes of down wood collapse and thus these pools are transferred to the organic horizon. On the other hand, charcoal and all forms of PyC are subject to losses by various mechanisms, including microbial decomposition, chemical and photo-oxidation, and transport downward or away from the site (Preston and Schmidt, 2006; Bird et al., 2015; Santín et al., 2016a). Surveys of organic horizon charcoal taken several decades or centuries after fire would thus capture varying amounts of the char originally present on the ground, on coarse down wood or on standing stems, minus whatever has been lost to microbial or chemical degradation, erosion, or downward transport. The high variability in charcoal stocks in the first 200 years could thus result in part from the variable timing of char transfer from the aboveground pool to the ground surface pool, which is itself influenced by a series of abiotic and biotic factors such as stand structure, weather, and topography. Char is of course not BC, and likely only a small proportion of charred biomass will have the polycondensed structure to resist decomposition (Preston and Schmidt, 2006; McBeath et al., 2011; Bird et al., 2015; Santín et al., 2016a; Maestrini and Miesel, 2017). However, charred biomass is the starting pyrogenic input, and we can hardly start to model BC as a component of the forest C cycle without this basic input.
CONCLUSIONS
We investigated amounts, depth distribution and chemical properties of visually determined charcoal (>2 mm) in the organic horizon and upper mineral soil in a boreal forest fire chronosequence in Quebec, and combined our results with those from a general survey of reported data. The latter also were visually reported charcoal, although studies varied in their sampling protocols, including organic layer only or inclusion of upper mineral soil, and some instructive cases were included from warmer regions. We found very wide variation in charcoal production by wildfires, and also in charcoal stocks up to around 200 years. Charcoal stocks showed high spatial variability and tended to be concentrated near the organic/mineral soil interface. Chemical properties of wildfire charcoal also show
considerable variation for younger samples, and with some caveats, can be sensibly connected with results from laboratory studies. With increasing time since fire (several hundred years), both stocks and properties tend to converge, with much lower stocks reported in older plots. We speculate that the general trends of increasing aromaticity, decreasing C/N ratio, and decreasing maximum stocks in the first centuries after fire may result from the decomposition of the more labile forms of the visually-determined charcoal, leaving the more recalcitrant forms of charcoal as a relatively stable stock. This statement should be taken with caution however because our study was not designed to test this hypothesis and because very few sites older than 500 ysf were analyzed. While reports of charcoal production are even scarcer than of charcoal stocks, our initial survey indicates a rough match, suggesting that initial charcoal production on stems, downed coarse wood and forest floor might reasonably be supposed to fall around 5,000–10,000 kg ha−1. In
order to develop models of PyC for boreal forests, clearly more studies are required, including total initial production, more data on sites at least several hundred ysf, and consideration of all components of PyC production, including the fate of PyC formed on standing stems and downed coarse wood. There is also need for more interdisciplinary studies to allow conversion of visually determined charcoal to the proportion of more resistant BC likely to contribute to more persistent soil C stocks.
AUTHOR CONTRIBUTIONS
CP designed the study and acquired the chemical data. Field data and char samples were provided by MS and YB. MS especially contributed to data analysis. GB acquired the NMR data. All authors contributed to writing the manuscript.
FUNDING
RW and YB thank NSERC for financial support.
ACKNOWLEDGMENTS
We thank David Dunn for careful laboratory analysis and ICP method development, plus colleagues who generously shared their raw data: Stephen A. Hart, Lakehead University, Thunder Bay, ON, Canada; Mikael Ohlson, Norwegian University of Life Sciences, Ås, Norway; Anna V. McBeath, James Cook University, Cairns Australia; Cristina Santín, Swansea University, Swansea UK. RW and YB thank NSERC for financial support.
SUPPLEMENTARY MATERIAL
The Supplementary Material for this article can be found online at: https://www.frontiersin.org/articles/10.3389/feart. 2017.00098/full#supplementary-material
REFERENCES
Aakala, T., Kuuluvainen, T., Gauthier, S., and De Grandpré, L. (2008). Standing dead trees and their decay-class dynamics in the northeastern boreal old-growth forests of Quebec. For. Ecol. Manage. 255, 410–420. doi: 10.1016/j.foreco.2007.09.008
Alexis, M. A., Rasse, D. P., Rumpel, C., Bardoux, G., Péchot, N., Schmalzer, P., et al. (2007). Fire impact on C and N losses and charcoal production in a scrub oak ecosystem. Biogeochemistry 82, 201–216. doi: 10.1007/s10533-006-9063-1 Alexis, M. A., Rumpel, C., Knicker, H., Leifeld, J., Rasse, D., Péchot, N., et al. (2010).
Thermal alteration of organic matter during a shrubland fire: a field study. Org. Geochem. 41, 690–697. doi: 10.1016/j.orggeochem.2010.03.003
Angers, V. A., Bergeron, Y., and Deapeau, P. (2012). Morphological attributes and snag classification of four North American boreal tree species: relationships with time since death and wood density. For. Ecol. Manage. 263, 138–147. doi: 10.1016/j.foreco.2011.09.004
Angers, V. A., Drapeau, P., and Bergeron, Y. (2010). Snag degradation pathways of four North American boreal tree species. For. Ecol. Manage. 259, 246–256. doi: 10.1016/j.foreco.2009.09.026
Araújo, G. C. L., Gonzalez, M. H., Ferreira, A. G., Nogueira, A. R. A., and Nóbrega, J. A. (2002). Effect of acid concentration on closed-vessel microwave-assisted digestion of plant materials. Spectrochim. Acta Part B 57, 2121–2132. doi: 10.1016/S0584-8547(02)00164-7
Ascough, P. L., Bird, M. J., Wormald, P., Snape, C. E., and Apperley, D. (2008). Influence of production, variables and starting material on charcoal stable isotopes and molecular characteristics. Geochim. Cosmochim. Acta 72, 6090–6102. doi: 10.1016/j.gca.2008.10.009
Baernthaler, G., Zischka, M., Haraldsson, C., and Obernberger, I. (2006). Determination of major and minor ash-forming elements in solid biofuels. Biomass Bioenergy 30, 983–997. doi: 10.1016/j.biombioe.2006.06.007 Baldock, J. A., and Smernik, R. J. (2002). Chemical composition and bioavailability
of thermally altered Pinus resinosa (Red pine) wood. Org. Geochem. 33, 1093–1109. doi: 10.1016/S0146-6380(02)00062-1
Bélanger, N., Côté, B., Fyles, J. W., Courchesne, F., and Hendershot, W. H. (2004). Forest regrowth as the controlling factor of soil nutrient availability 75 years after fire in a deciduous forest of Southern Quebec. Plant Soil 262, 363–372. doi: 10.1023/B:PLSO.0000037054.21561.85
Bergeron, S. P., Bradley, R. L., Munson, A., and Parsons, W. (2013). Physico-chemical and functional characteristics of soil charcoal produced at five different temperatures. Soil Biol. Biochem. 58, 140–146. doi: 10.1016/j.soilbio.2012.11.017
Bergeron, S. P., Gauthier, S., Flannigan, M., and Kafka, V. (2004). Fire regimes at the transition between mixedwood and coniferous boreal forest in northwestern Quebec. Ecology 85, 1916–1932. doi: 10.1890/02-0716 Bird, M. I., Wynn, J. G., Saiz, G., Wurster, C. M., and McBeath, A. (2015).
The pyrogenic carbon cycle. Ann. Rev. Earth Planet. Sci. 43, 273–298. doi: 10.1146/annurev-earth-060614-105038
Boulanger, Y., Gauthier, S., and Burton, P. (2014). A refinement of models projecting future Canadian fire regimes using homogeneous fire regime zones. Can. J. For. Res. 44, 365–376. doi: 10.1139/cjfr-2013-0372
Boulanger, Y., and Sirois, L. (2006). Postfire dynamics of black spruce coarse woody debris in northern boreal forest of Quebec. Can. J. For. Res. 36:1770–1780. doi: 10.1139/x06-070
Boulanger, Y., Sirois, L., and Hébert, C. (2011). Fire severity as a determinant factor of the decomposition rate of fire-killed black spruce in the northern boreal forest. Can. J. For. Res. 41, 370–379. doi: 10.1139/X10-218
Brais, S., Bélanger, N., and Guillemette, T. (2015). Wood ash and N fertilization in the Canadian boreal forest: Soil properties and response of jack pine and black spruce. For Ecol. Manage. 348, 1–14. doi: 10.1016/j.foreco.2015.03.021 Briggs, C., Breiner, J. M., and Graham, R. C. (2012). Physical and chemical
properties of Pinus ponderosa charcoal: implications for soil modification. Soil Sci. 177, 263–268. doi: 10.1097/SS.0b013e3182482784
Brown, R. A., Kercher, A. K., Nguyen, T. H., Nagle, D. C., and Ball, W. P. (2006). Production and characterization of synthetic wood chars for use as surrogates for natural sorbents. Org. Geochem. 37, 321–333. doi: 10.1016/j.orggeochem.2005.10.008