Cellular Bases of Brain Energy
Metabolism and Their Relevance to
Functional Brain Imaging: Evidence for a
Prominent Role of Astrocytes
Pierre J. Magistretti and Luc Pellerin
Institut de Physiologie, Faculte de Medecine, Universite de Lausanne, CH-1005 Lausanne, Switzerland
Survey of Brain Energy Metabolism at the Organ and Regional Levels Organ Level
Fundamental observations on brain energy metabolism at the organ level culminated over 40 years ago, in particular through the pioneering work of Schmidt and Kety (1948). By determining arteriovenous (A-V) differences of a number of metabolic substrates the view emerged that, except under certain nonphysiological conditions, glucose is the obligatory energy substrate for the brain (Edvinsson et al., 1993). Glu-cose utilization by the brain is 31 u.mol/100 gm/min, while oxygen consumption is 160 (i.mol/100 gm/min; since CO2
production is almost identical, the respiratory quotient (RQ) • of the brain is nearly 1, indicating that carbohydrates are the substrates for oxidative metabolism (Sokoloff, I960). With a global blood flow of 57 ml/100 gm/min, the brain extracts approximately 50% of oxygen and 10% of glucose from the arterial blood. Given a theoretical stoichiometry of 6 n.mol of oxygen consumed for each |i.mol of glucose, the expected brain glucose utilization should in theory be 26.6 fi.mol/100 gm/min rather than the measured 31 |imol/100 gm/min; thus, an excess of 4.4 |jt,mol/100 gm/min of glucose follows other metabolic fates. These include the production of lactate and pyruvate which do not necessarily enter the tricarboxylic acid cycle, but rather, can be released into the circulation. Glucose can also be incorporated into lipids, proteins, and glycogen, and it is the precursor of certain neurotransmitters such as GABA, glutamate, and acetylcholine (Sokoloff, 1989; Edvinsson et al., 1993).
It should also be noted that a limited proportion of oxygen is actually utilized for purposes other that direct energy gen-eration. Neural cells contain oxydases and hydroxylases, which are key regulatory enzymes in the metabolic pathways of a number of neuroactive molecules. Examples of such ox-ygen-requiring enzymes are cyclooxygenases and lipoxygen-ases involved in the synthesis of eicosanoids from arachidonic acid, tyrosine and tryptophan hydroxylases, dopamine-B-hy-droxylase, and monoamine oxidase, •which are all enzymes that regulate the metabolism of monoamine neurotransmit-ters (Keevil and Mason, 1978). The recendy discovered NO synthase pathway also consumes oxygen (Klatt et al., 1993). Certain metabolic intermediates, under particular condi-tions, can substitute for glucose as alternative substrates for brain energy metabolism (Sokoloff, 1989)- Thus starvation, di-abetes, or breast-feeding in neonates all lead to increased plas-ma levels of the ketone bodies acetoacetate and D-3-hydrox-ybutyrate, which can be used by the brain as metabolic sub-strates (Sokoloff, 1989). Mannose, which is not normally pres-ent in die blood and cannot therefore be considered a physiological substrate, can sustain normal brain function in the absence of glucose. Lactate and pyruvate can sustain syn-aptic activity in vitro (Mcllwain and Bachelard, 1985; Schurr et al., 1988). Because of their limited permeability across the blood-brain barrier, they cannot adequately substitute for plasma glucose to maintain brain function (Pardridge and
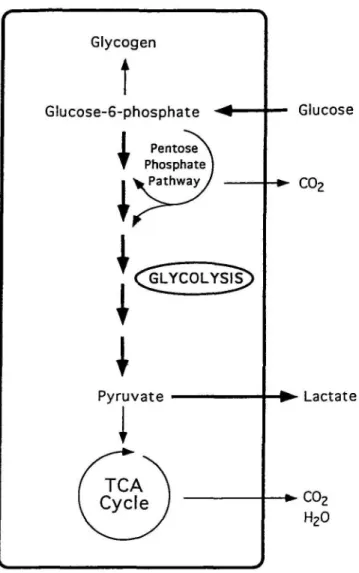
Old-endorf, 1977). However, if formed inside the brain parenchy-ma, they are useful metabolic substrates for neural cells (Mcllwain, 1953; Ide et al., 1969; Teller et al., 1977). Net re-lease of lactate and pyruvate (negative A-V difference) is oc-casionally measured in normal individuals, and more frequent-ly in aged subjects or during convulsions (Kety, 1957; Cohen et al., 1967; Folbergrova, 1974). Since steady-state arteriove-nous (A-V) differences provide indirect evidence that a sub-stance can be either used as a substrate by die brain (positive A-V difference) or produced by the brain (negative A-V dif-ference) diese observations indicate a variable degree of gly-cohtic glucose processing by the brain (Fig. 1).
Regional Level
Studies at the organ level, while revealing the global substrate requirements for the brain and their stoichiometry, failed to provide the appropriate level of resolution to appreciate two major features of brain energy metabolism: (1) its regional heterogeneity, and (2) its tight relationship with the function-al activation of specific pathways. A major technicfunction-al advance that brought die regional resolution to studies of brain energy metabolism and tiiat laid die ground for visualization of neural activity, is the autoradiographic 2-deoxyglucose mediod (2-DG) developed by Sokoloff and colleagues. Widi this tech-nique, local rates of glucose utilization (LCMRglu) can be de-termined with a spatial resolution of approximately 50-100
\xm (Sokoloff et al., 1977; Sokoloff, 1981).
Using die 2-DG autoradiographic technique, LCRMglu have been determined in virtually all structurally and functionally defined brain regions during various physiological and patiio-logical states. Activation of padiways subserving specific mo-dalities, such as visual, auditory, olfactory, or somatosensory stimulations as well as motor activity has also been revealed in the pertinent brain structures by die 2-DG technique (Sharp et al., 1975; Kennedy et al., 1976; Wolf et al., 1983; Melzer et al., 1985; Ginsberg et al., 1987). A consistent finding has been diat the increase in 2-DG uptake linked to functional activation occurs in die neuropil, diat is, in regions diat are enriched in axon terminals, dendrites, and synapses ensheadi-ed by astrocytic processes, and not where neuronal perikarya are located (Kadekaro et al., 1985; Sokoloff, 1991). Given die complex intertwining of neural processes in die nervous sys-tem, this observation is particularly apparent in diose circuits in which a clear-cut polarization of neural process exists (Ro-land, 1993). Thus, a striking example was provided by a study of Sokoloff and colleagues showing diat when die sciatic nerve of anesdietized rats is stimulated, a frequency-depen-dent increase in 2-DG uptake occurs in die dorsal horn of die spinal cord (where afferent axon terminals make synaptic contacts widi second order neurons) but not in die dorsal root ganglion, where die cell body of die sensory neurons is localized (Kadekaro et al., 1985). As anotiier example, increas-es in glucose utilization in die well-laminated monkey pri-mary visual cortex elicited by appropriate visual stimuli, are most pronounced in layer IV, which is poor in perikarya but
Glycogen
t
G!ucose-6-phosphate 1 Pentose\ T Phosphate ) Pentose Phosphate , Pathway • yPathway / GLYCOLYSIS: PyruvateI
(
T C A1
I Cycle J
Glucose •+* C O2 - • Lactate H20Figure 1. Metabolic pathways for glucose. Glycolysis is shown with thick arrows.
| Neuron |
Figure 2. Schematic representation of the cytological relationships between astrocytes,
neurons, and blood vessels. Astrocyte end-feet form the first cellular barrier encoun-tered by glucose entering the brain parenchyma and are therefore a likely prevalent uptake site. They are also ideally located to sense synaptic activity, since one of their main function is to remove excess glutamate and potassium from the extracellular space upon neuronal activation. Hnally, they can provide neurons with metabolic intermediates such as lactate, which is an adequate energy substrate.
where the terminals of axons projecting from the lateral ge-niculate engage in synaptic contacts (Kennedy et ah, 1976). A similar observation was made in the whisker barrel field of rat somatosensory cortex where the increase in glucose uti-lization during activation is greatest in layers in and IV (Hand et al., 1978). Consistent with this finding, activation studies of specific functional pathways using PET determination of ce-rebral blood flow indicate that the increases in energy de-mands occur in the projection areas, that is, where axon ter-minals are found (Zeki et al., 1991; Deiber et al., 1993).
This set of observations, •while providing a focus on syn-aptic terminals and their associated astrocytic processes as the principal sites of activation-dependent increases in energy metabolism, lack the cellular resolution required to determine the relative contribution of neurons and glial cells as well as the nature of metabolic exchanges occurring between these two cell types. Studies in cellularly homogeneous prepara-tions in conjunction with others on well compartmentalized and simple nervous tissues have provided strong indications for a prevalent glial localization of die activation-induced in-crease in glucose utilization. These evidences and their rele-vance to functional brain imaging are reviewed in the follow-ing paragraphs.
Cellular Localization of Metabolic Events during Activation Cytological Relationships between Neurons and Astrocytes
When considering brain energy metabolism the focus is pre-dominantly, if not exclusively, placed on neuronal energy me-tabolism. However, other cell types, namely glia and vascular endothelial cells, play an active role in the flux of energy substrates to neurons. The arguments are both quantitative and qualitative. First, while it is arduous to provide a definitive ratio between neurons and non-neuronal cells, given the vari-ability in figures obtained in various species, brain areas, and developmental ages using often methods that are not easily comparable, it is clear that neurons contribute at most 50% of cerebral cortical volume (O'Kusky and Colonnier, 1982; Ki-melberg and Norenberg, 1989; Bignami, 1991). Estimates of astrocyte:neuron ratios of 10:1 have been put forward (Big-nami, 1991). In addition, there is clear evidence indicating that the astrocyte:neuron ratio increases with increasing brain size (Tower and Young, 1973); this is an important consideration when considering the cellular bases of brain energy metabo-lism in humans. Second, particular astrocytic profiles, die end-feet, surround intraparenchymal capillaries, which are the source of glucose. This cytoarchitectural arrangement implies that astrocytes form the first cellular barrier that glucose en-tering the brain parenchyma encounters, and it makes them a likely site of prevalent glucose uptake (Fig. 2). This latter structural feature has long been suggested as evidence indi-cating a role of astrocytes in the distribution of substances from blood to other brain cells (Sala, 1891; Andriezen, 1893). Finally, astrocyte processes are wrapped around synaptic con-tacts, implying that they are ideally positioned to sense and be functionally coupled to increased synaptic activity. In fact, two well-established functions of astrocytes are the clearance of potassium and the uptake of glutamate, both of which in-crease in the extracellular space in conjunction with synaptic activation (Barres, 1991).
Comparison of Glucose Utilization by Astrocytes and Neurons
Basal Glucose Utilization
Basal glucose utilization of the gray matter as determined by the 2-DG technique varies, depending on the brain structure,
1OOOr .X upt a O Q
E
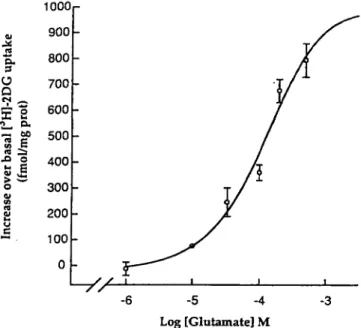
sai l n er b CO ro t d. 60 fmo l 900 800 700 600 500 400 300 200 100 0 --5 -4 Log [Glutamate] M -3Figure 3. Concentration-response curve of the stimulation by glutamate of 3H-206 up-take by astrocytes. The ECM of this effect is 80 JIM (up-taken with permission from Pellerin and Magistretti, 1994).
between 50 and 150 (imol/100 gm wet weight/min in the rat (Sokoloff et al., 1977). If a protein content of 10% of wet weight is assumed, a value of 5-15 nmol/mg prot/min is ob-tained. These values are approximately 50% lower in the pri-mate brain (Kennedy et al., 1978). Physiological activation of specific pathways results in a 1.5-3-fold increase in LCMRglu, as determined by the 2-DG technique (Miyaoka et al., 1979; McCulloch et al., 1980). Glucose utilization can be determined with the 2-DG technique in cellularly homogeneous prepa-rations of astrocytes or neurons such as primary cultures pre-pared from neonatal or embryonic mouse cerebral cortex. The basal rate of glucose utilization in astrocytes is higher than in neurons, with a rate in astrocytes of 22.3 nmol/mg prot/min and in neurons of 6.3 nmol/mg prot/min. These val-ues are of the same order as those determined in vivo for cortical gray matter, with the 2-DG autoradiographic tech-nique (Sokoloff et al., 1977). Thus, in view of this difference and of the quantitative preponderance of astrocytes com-pared to neurons in the gray matter, these data reveal a sig-nificant contribution of astrocytes to basal glucose utilization as determined by 2-DG autoradiography or PET.
Glucose Utilization during Activation
The contribution of astrocytes to glucose utilization during activation is even more striking. Thus, since during activation of a given cortical area the concentration of glutamate in the extracellular space increases considerably due to its release from the axon terminals of activated pathways (Fonnum, 1984), the effect of glutamate application on glucose utiliza-tion by astrocytes and neurons in culture •was examined. As shown in Figure 3, L-glutamate stimulates 2-DG uptake and phosphorylation by astrocytes in a concentration-dependent manner, with an EC*, of 80 |LM (Pellerin and Magistretti, 1994; Takahashi et al., 1995). This effect is not mediated by specific glutamate receptors known to be present on astrocytes (Pear-ce, 1993), since it is not inhibited by any of the specific an-tagonists tested nor is it mimicked by agonists specific for each receptor subtype such as NMDA, AMPA, quisqualate, or f-ACPD. The effect of glutamate is stereospecific, with only the L-isomer being active, and dependent on the presence of extracellular sodium. This pharmacological profile is
charac-teristic of the glutamate transporter (Kanner, 1993). Indeed, the increase in glucose utilization evoked by glutamate is completely abolished by preincubation of the cultures with the potent glutamate transporter inhibitor DL-&bm>P-hydrox-yaspartate (THA; Pellerin and Magistretti, 1994). These results clearly indicate a tight coupling between Na+-dependent
glu-tamate uptake and glucose utilization by astrocytes (Fig. 4). The intracellular molecular mechanism(s) of this coupling are presently being investigated; a critical involvement of the Na+/K+-ATPase is likely, since ouabain completely inhibits the
glutamate-evoked 2-DG uptake by astrocytes (Pellerin and Magistretti, 1994). The astrocytic Na+/K+-ATPase responds
predominantly to increases in intracellular Na+ for which it
shows a Km of about 10 HIM (Kimelberg et al., 1978; Erecinska, 1989). Since in cultured astrocytes, the (Na+), concentration
ranges between 10 and 20 rtiM (Kimelberg et al., 1993), NaV K+-ATPase is set to be readily activated when (Na+), raises
concomitantly with glutamate uptake (Bowman and Kimel-berg, 1984). In this context, it is important to note that in
vivo, the main mechanism that accounts for the
activation-induced 2-DG uptake is represented by the activity of the Na+/K+-ATPase (Mata et al., 1980).
In contrast to what is observed in astrocytes, glutamate does not stimulate 2-DG uptake in cultured neurons, despite the feet that glutamate can elicit functional responses in these cells, which are mediated by ionotropic and metabotropic re-ceptors. Examples of functional responses in these neuronal cultures, which are totally devoid of glial markers, are the NMDA and AMPA/kainate-mediated increases in intracellular calcium (Stella et al., 1995), stimulation of arachidonic acid formation (Stella et al., 1995), and induction of c-fos expres-sion (Pellegri et al., 1994), as well as the metabotropic recep-tor-mediated stimulation of phospholipase C (Stella et al., 1995). Cultured neurons also possess an active glutamate reuptake system, •which has, however, a maximal capacity al-most 80 times inferior to that of astrocytes (Vm,x in neurons 0.74 nmol/mg prot/min; V^, in astrocytes 57.4 nmol/mg prot/min).
A similar compartmentalization of glucose uptake has been described in a series of elegant experiments carried out by Marcos Tsacopoulos and his colleagues in the honeybee drone retina and, more recently, in the guinea pig retina. The honeybee drone retina is a crystal-like structure that is struc-turally and metabolically compartmentalized (Tsacopoulos and Veuthey, 1993). Thus, in this highly organized nervous tissue preparation, photoreceptor cells form rosette-like struc-tures that are surrounded by glial cells. In addition, mitochon-dria are exclusively present in the photoreceptor neurons. Upon activation of the photoreceptors by light, an increase in 2-DG uptake can be visualized in the glial cells surrounding the rosettes, but not in the photoreceptors (Tsacopoulos et al., 1988). An increase in O2 consumption is,
nonetheless,mea-sured in photoreceptors. These experiments suggest that fol-lowing activation of photoreceptors by light, glucose is pre-dominantly taken up by glial cells, which then release a met-abolic substrate to be oxidized by photoreceptor cells. Similar results have been observed in guinea pig retina, in which 2-DG uptake is visualized by autoradiography only in Miiller cells (Poitry-Yamate and Tsacopoulos, 1992).
Lactate Released by Astrocytes Is a Metabolic Substrate for Neurons
The fact that during activation the increase in glucose uptake can be ascribed predominantly, if not exclusively, to astro-cytes, implies that energy substrates other than glucose must be released by astrocytes. As indicated earlier, lactate and py-ruvate are adequate substrates for brain tissue in vitro (Mc-Ilwain, 1953; Ide et al., 1969; Teller et al. 1977; Mcllwain and
Glutamatergic synapse Astrocyte Capillary
V
mMetabotropic lonotropic Glutamate receptors
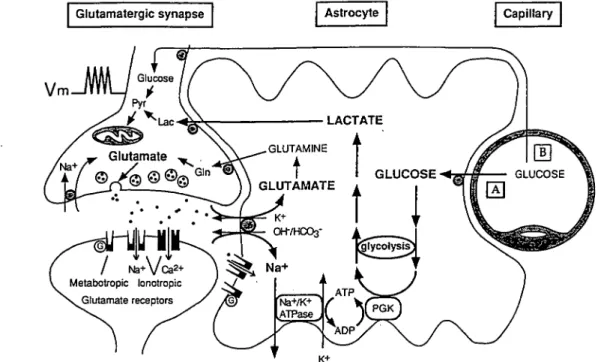
figure 4. Schematic representation of the mechanism for glutamate-induced glycolysis in astrocytes during physiological activation. At glutamatergic synapses, glutamate depolarizes
neurons by acting at specific receptor subtypes. The action of glutamate is terminated by an efficient glutamate uptake system located primarily in astrocytes. Glutamate is cotransported with Na*, resulting in an increase in the intracellular concentration of Na», leading to an activation of the Na*/K* ATPase. The pump, fueled by ATP provided by membrane-bound gfycolytic enzymes (possibly phosphoglycerate kinase, PGK; see Proverbio and Hoffman, 1977), activates glycolysis, that is, glucose utilization and lactate production, in astrocytes. Lactate, once released, can be taken up by neurons and serve as an adequate energy substrate. For graphic clarity, only lactate uptake into presynaptic terminals is indicated. However, this process could also occur at the postsynaptic neuron. This model, which summarizes in vitro experimental evidences indicating glutamate-induced glycolysis, is taken to reflect cellular and molecular events occurring during activation of a given cortical area [arrow labeled A activation). Direct glucose uptake into neurons under basal conditions is also shown [arrow labeled ft basal conditions). Pyr, pyruvate; Lac, lactate; Gin, glutamine; G, G-protein (taken with permission from Pellerin and Magistretti, 1994).
Bachelard, 1985; Schurr et al., 1988). In fact, synaptic activity can be maintained in cerebral cortical slices with only lactate or pyruvate as a substrate (Mcllwain, 1953; Mcllwain and Bachelard, 1985; Schurr et al., 1988). Recently, neurodegener-ation in the hippocampal slice preparneurodegener-ation induced by glu-cose deprivation has been shown to be prevented by inclu-sion of lactate in the perfusing medium (Izumi et al., 1994). Indeed, recent evidences obtained in cellularty homogeneous or well compartmentalized preparations indicate that astro-cytes process glycolytically glucose by converting it to lactate. Thus, lactate is quantitatively the main metabolic intermediate released by cultured astrocytes at a rate of 15 to 30 nmol/mg prot/min (Walz and Muckerji, 1988; Dringen and Hamprecht, 1993; Sorg et al., 1993). This rate of release correlates well with the rate of glucose uptake by the gray matter (Sokoloff et al., 1977) or by astrocytes in culture (Yarowsky et al., 1986; Yu et al., 1993), which is between 5 and 15 nmol/mg prot/ min. Other, quantitatively less important intermediates re-leased by astrocytes are pyruvate (approximately 10 times less than lactate), ot-ketoglutarate, citrate, and malate (Shank and Campbell, 1984; Selak et al., 1985; Sonnewald et al., 1991; Shank et al., 1993)- Furthermore, fluxes of endogenous lactate between astrocytes and neurons have been quantified in
vitro showing lactate utilization even in the presence of
glu-cose (Larrabee, 1983, 1992). However, in order for lactate (or pyruvate) to be an adequate metabolic substrates for neurons, particularly during activation, two additional conditions have to be fulfilled. First, that, indeed, during activation lactate re-lease by astrocytes increases; second, lactate uptake by neu-rons must be demonstrated. Both mechanisms have been re-cently shown. Thus, when activation is mimicked in in vitro conditions by exposing cultured astrocytes to glutamate, a marked release of lactate, and to a lesser degree, pyruvate, is observed (Pellerin and Magistretti, 1994). This
glutamate-evoked lactate release shows the same pharmacology and time course as the glutamate-evoked glucose utilization, thus indicating that glutamate stimulates the processing of glucose through glycolysis (Pellerin and Magistretti, 1994). Consistent with the notion of activation-induced glycolysis are studies indicating increases in lactate levels in the rat somatosensory cortex following forepaw stimulation (Hossmann and linn, 1987; Ueki et al., 1988). In addition, when lactate was mea-sured in vivo by microdialysis in freely moving rats, similar increases in hippocampus and striatum following somatosen-sory stimulation were demonstrated (Schasfoort et al., 1988; Fellows et al., 1993). Interestingly, the rate of lactate clearance from the extracellular space was markedly slowed in the pres-ence of tetrodotoxin, a specific blocker of the neuronal volt-age-sensitive sodium channels responsible for the generation of action potentials (Fellows et al., 1993). This latter obser-vation implies that during actiobser-vation, lactate may normally be taken up by neurons as an energy fuel. Indeed, recent evi-dence obtained in purified neuronal cultures indicates the presence of a saturable and specific transport system for lac-tate (Dringen et al., 1993b).
Thus, a metabolic compartmentation whereby glucose taken up by astrocytes is metabolized glycolytically to lactate, which is then released in the extracellular space to be utilized by neurons, is consistent with the available biochemical and electrophysiological observations. This array of in vitro and
in vivo experimental evidence supports the model of
cell-specific metabolic regulation illustrated in Figure 4. In partic-ular, as far as glutamate-induced glycolysis is concerned, this model is taken to reflect cellular and molecular events occur-ring duoccur-ring activation of a given cortical area. Direct neuronal glucose uptake could still take place under these conditions, as it does in the basal state. It should also be noted that a reciprocal relationship appears to exist between aerobic
colysis and glutamate uptake. Thus, glutamate uptake into trocytes is markedly decreased by inhibition of glycoly; while being only moderately affected by hypoxia (Swans< 1992). These results suggest the existence of a cooperati mechanism whereby glutamate uptake triggers aerobic g colysis, which in turn, is necessary to maintain proper trai membrane glutamate and Na+ gradients to direct glutaira
transport into astrocytes.
Studies in the well-compartmentalized honeybee dro; retina and in isolated preparations of guinea pig retina cc taming photoreceptors attached to Miiller cells corrobors such metabolic fluxes between glia and neurons. Thus, in s dition to the glial localization of glucose uptake during ac vation, the release of glycolytic products has also been show In particular, during activation, glial cells in the honeyb drone retina release alanine produced from pyruvate by trai amination; the released alanine is taken up by photorecept neurons which, after reconversion to pyruvate, can enter ti tricarboxylic acid cycle to yield ATP through oxidative ph( phorylation (Tsacopoulos et al., 1994). In the guinea pig n ina, lactate, formed glycolytically from glucose, is released I the Muller cells to fuel photoreceptor neurons (Poitry-Yama 1994).
. In summary, while plasma lactate cannot fully substitu for glucose as a metabolic substrate for brain because of : limited permeability across the blood-brain barrier (Pardrid; and Oldendorf, 1977). lactate formed within the brain pare chyma, e.g., through glutamate-activated glycolysis in asti cytes, can fulfill the energetic needs of neurons. Lactate, aft conversion to pyruvate via a reaction catalyzed by lactate de-hydrogenase (LDH), can provide on a molar basis 18 ATP through oxidative phosphorylation. Five isozymes of LDH ex-ist, with at one end the M4 (muscle) isozyme favoring the
formation of lactate from pyruvate, while the H< (heart) iso-zyme drives the reaction preferentially in the opposite direc-tion. The other three isozymes are tetramers composed of different combinations of the two subunits (M and H) and have intermediate properties. There is some evidence that the M subunit is predominant in astrocytes, while neurons are enriched with the H subunit (Tholey et al., 1981), an obser-vation consistent with lactate production by astrocytes and utilization by neurons. Interestingly, a similar metabolic ex-change between cell types has been described in the testis (Mita and Hall, 1982). In this case, active glycolysis in Sertoli cells produces lactate, which is the preferred metabolic sub-strate for round spermatids.
Gfycogenofysis Occurs during Activation and Is Localized in Astrocytes
Grycogen is the single largest energy reserve of the brain; it is mainly localized in astrocytes, although ependymal and cho-roid plexus cells, as well as certain large neurons in the brain stem contain glycogen (Magistretti et al., 1993). When com-pared to liver or muscle, the grycogen content of the brain is exceedingly small, about 100 and 10 times inferior, respec-tively. However, the brain can hardly be considered a grycogen storage organ and here the function of glycogen should be viewed as that of providing a metabolic buffer during physi-ological activity. Indeed, glycogen turnover in the brain is ex-tremely rapid and glycogen levels are finely coordinated with synaptic activity (Magistretti et al., 1993). Thus, for example, during barbiturate anesthesia, a condition in which synaptic activity is markedly attenuated, glycogen levels raise sharply (Phelps, 1972); interestingly however, the glycogen content of cultures containing exclusively astrocytes is not increased by general anesthetics (Swanson et al., 1989); this observation indicates that the in vivo action of barbiturates on astrocytic glycogen is due to the inhibition of neuronal activity, stressing
noradrenergic afferent
efferent
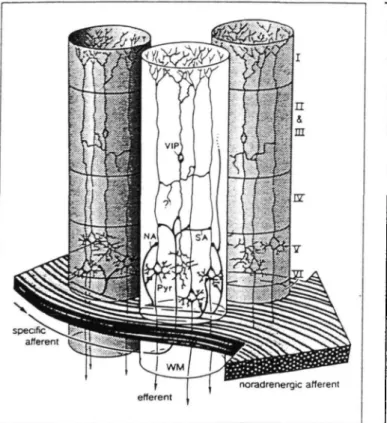
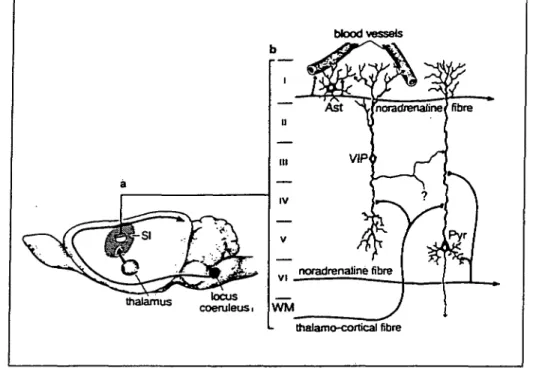
Figure 5. Columnar organization of VIP-containing neurons. VIP, VIP-containing bipolar
cells; NA, noradrenergic afferent; Pyr, pyramidal cells furnishing major afferent projec-tions; SA, specific afferent (from the thalamus or from other cortical regions); WM, subcortical white matter. Cortical layers denoted by roman numerals (reprinted from Magistretti and Morrison, 1988, with kind permission from Elsevier Science Ltd, The Boulevard, Langford Lane, Kidlington 0X5 1GB, UK).
the existence of a tight coupling between synaptic activity and astrocytic glycogen. In addition, reactive astrocytes, which develop in areas where neuronal activity is decreased or ab-sent as a consequence of injury, contain high amounts of gly-cogen (Shimizu and Hamuro, 1958; Wolfe et al., 1962; Watan-abe and Passonneau, 1974). Glycogen levels are tightly regu-lated by various neurotransmitters (Magistretti et al., 1993). Thus, we have shown that Vasoactive Intestinal Peptide (VIP), a neurotransmitter contained in a homogeneous population of bipolar, radially oriented neurons (Magistretti and Morrison, 1988) could promote a cAMP-dependent glycogenolysis in mouse cerebral cortical slices (Magistretti et al., 1981). In view of the morphology and arborization pattern of VIP-containing neurons (Fig. 5), we proposed that these cells could regulate the availability of energy substrates locally, within cortical col-umns (Magistretti et al., 1981; Magistretti and Morrison, 1988). A similar effect had been previously described for NA (Quach et al., 1978), serotonin and histamine (Quach et al., 1980,1982). The noradrenergic system is organized according to principles strikingly different from those of VIP neurons: the cell bodies of NA-containing neurons are localized in the locus coeruleus in the brain stem from where axons project to various brain areas including the cerebral cortex; here, they enter the rostral end and progress caudally with a predominantly horizontal tra-jectory, across a vast rostrocaudal expanse of cortex (Morrison et al., 1978). Given these morphological features we suggested that, in contrast to VIP-containing intracortical neurons, the noradrenergic system could regulate energy homeostasis glob-ally, spanning across functionally distinct cortical areas (Magis-tretti et al., 1981; Magis(Magis-tretti and Morrison, 1988; Fig. 6).
The glycogenolytic effect of VIP and NA is exerted in as-trocytes, as indicated by studies in primary astrocyte cultures
bloodvessels
thalamus coeruleusilocus
noradrenaline fibre
WM
thalamo-cortical fibre
Figure 6. Anatomical organization and putative targets of the NA- and VlP-con-taining neuronal circuits in rat cerebral cortex a, Noradrenergic fibers originate in locus ceruleus and project to the ce-rebral cortex, where they adopt a hori-zontal trajectory parallel to pial surface. 6, VIP neurons are intrinsic to the ce-rebral cortex and are oriented vertically, perpendicular to the pial surface. Astro-cytes [Asti, intraparenchymal blood ves-sels, and neurons such as certain pyra-midal cells [PyA are potential target cells for VIP neurons. Roman numerals indi-cate cortical layers. VIP neurons can be activated by specific afferents (e.g., thai-amocortical fibers). SI, primary sensory cortex; WM, white matter (reprinted from Magistretti and Morrison, 1988, with kind permission from Elsevier Science Ltd, The Boulevard, Langford Lane, Kidlington 0X5 1GB, UK).
(Magistretti et al., 1983; Sorg and Magistretti, 1991) as well as by the fact that glycogen is primarily localized in this cell type (Peters et al., 1991). Thus, VIP and NA promote a concentra-tion- and time-dependent glycogenolysis in astrocytes, with EC50 of 3 and 20 nM, respectively (Magistretti et al., 1983; Sorg
and Magistretti, 1991). The effect of NA is mediated by both P and a, receptors. In addition to VIP and NA, adenosine and ATP are also glycogenolytic in astrocytes (Table 1). The initial rate of glycogenolysis activated by VIP and NA is between 5 and 10 nmol/mg prot/min (Sorg and Magistretti, 1991),a value that is remarkably close to glucose utilization of the gray mat-ter, as determined by the 2-DG autoradiographic method (So-koloff et al., 1977). This correlation indicates that the glycosyl units mobilized in response to the two glycogenolytic neu-rotransmitters can provide quantitatively adequate substrates for the energy demands of the brain parenchyma. At this stage, it is not yet clear whether the glycosyl units mobilized through glycogenolysis are used by astrocytes to face their energy demands during activation, or whether they are me-tabolized to a substrate such as lactate (Dringen et al., 1993a), which is then released for the use of neurons. A well-estab-lished fact is that glucose is not released by astrocytes, at least
in vitro (Dringen et al., 1993a), supporting the view that the
activity of glucose-6-phosphatase in astrocytes is very low (So-koloff et al., 1977; Fishman and Karnovsky, 1986).
Table 1
Glycogenolytic neurotransmitters in primary cultures of mouse cortical astrocytes
Substance EC.M VIP PHI Secretin PACAP Noraderenaline Isoproterenol (p) Metfioxamine (a,) Adenosine ATP 0.5 0.08 20 20 600 800 1300
PHI, Peptide histidine isoleucine; PACAP, pituitary adenyfate cyclase activating peptide.
Another action of NA on energy metabolism is the marked stimulation of 2-DG uptake in primary astrocyte cultures (Yu et al., 1993). This action is functionally coordinated with gly-cogenolysis, since the same extracellular signal (NA) results in an increased availability of glycosyl units for ATP produc-tion in astrocytes. In contrast to NA, VIP does not influence glucose uptake by astrocytes (Yu et al., 1993).
Glycogenolysis, revealed by a newly developed autoradiog-raphy technique for glycogen, has been demonstrated also in
vivo following physiological activation of a modality-specific
pathway (Swanson et al., 1992). Thus, repeated stimulation of the vibrissae resulted in a marked decrease in the density of glycogen-associated autoradiographic grains in the somatosen-sory cortex of rats (barrel field) as well as in the relevant thalamic nuclei (Swanson et al., 1992). These observations indicate that the physiological activation of specific neuronal circuits results in the mobilization of glial glycogen stores.
Further evidence supporting a role of astrocytic glycogen as a metabolic buffer in the early stages of activation has been provided in hippocampal slices (lipton, 1988). Electrical stim-ulation of the slice results in an immediate and marked in-crease in NADH fluorescence, an index for the activation of glycolysis (Lipton, 1973). This increase in NADH fluorescence is observed in a •well-oxygenated medium containing ade-quate supplies of glucose, and occurs at the onset of synaptic activity. However, the signal disappears when the glycogen content of the slices is depleted by a glycogenolytic pretreat-ment (Lipton, 1973). This observation further suggests that an activation of glycogenolysis occurs at the onset of synaptic activity.
Correlations with Functional Brain Imaging
The data reviewed thus far on the cell-specific metabolic events that take place during activation strongly suggest an activity-dependent glucose uptake into astrocytes, which then release lactate as die metabolic substrate to fuel neuronal en-ergy metabolism. Evidence has also been provided for an ac-tivation-induced glycogen mobilization in astrocytes. This set of observations is consistent with some now well-established but originally unexpected findings obtained in functional
brain imaging studies, for which they provide, in fact, some cellular and molecular bases. With the advent of Positron Emission Tomography (PET) and the use of positron-emitting isotopes such as 18F, local glucose utilization has been studied
in humans with 2-(18F)fluoro-2-deoxyglucose (Phelps et al.,
1979; Raichle, 1979; Reivich et al., 1979; Reivich and Alavi, 1983). Similarly, local oxygen consumption and changes in blood flow can be studied in humans by PET using "O2 and
H2"O (Frackowiak et al., 1980; Raichle et al., 1983). PET
stud-ies in which blood flow, oxygen consumption, and glucose utilization were determined in the same subject have now clearly established that focal physiological cortical activation results in a metabolic uncoupling whereby the increases in blood flow and glucose utilization are not matched by a com-mensurate increase in oxygen consumption, indicating non-oxidative glucose utilization (Fox and Raichle, 1986; Fox et al., 1988). These in vivo observations are consistent with the model of metabolic fluxes summarized in Figure 4, which is based on observations made in purified cellular preparations and in simple and well compartmentalized neural systems. In particular, the glutamate-induced glycolysis recently reported in astrocytes provides a cellular basis for the metabolic un-coupling demonstrated in PET studies, which has led to the notion of activation-induced glycolysis (Fox et al., 1988).
Another important issue that emerges from studies at the cellular level is that glucose utilization, as visualized during physiological activation in humans by PET using 18F-labeled
deoxyglucose or in laboratory animals with the 2-DG autora-diography technique may reflect predominantly uptake of the tracer into astrocytes. This conclusion does not question the validity of deoxyglucose-based techniques to map neuronal activity; rather, it provides a cellular and molecular basis for these in vivo imaging procedures.
Evidence for glycolysis as the principal metabolic pathway operational during activation of a given brain area has also been provided by in vivo 'H-NMR spectroscopy studies (Prichard et al., 1991; Sappey-Marinier et al., 1992). Such anal-yses, which are consistent with the previously reviewed evi-dences obtained in microdialysis studies (Fellows et al., 1993), show increases in the lactate signal in primary visual cortex following physiological activation (Prichard et al., 1991; Sap-pey-Marinier et al., 1992).These in vivo 'H-NMR spectroscopy studies taken together with the PET data indicating a meta-bolic uncoupling, reveal a previously unrecognized preva-lence of glycolysis over oxidative phosphorylation during ac-tivation. One of the possible roles for activation-induced gly-colysis may be to provide ATP to fuel energy-dependent ion transport, in particular the Na+/K+-ATPase, which represents
the main energy-consuming process in neural cells (Siesjo, 1978; Erecinska and Dagani, 1990). In fact, a preferential role of glycolysis-derived ATP for the activity of the Na+/K+
-ATP-ase, has been recognized in various tissues (Proverbio and Hoffman, 1977; Paul et al., 1979, 1989), including the brain (lipton and Robacker, 1983)- Other energy-consuming pro-cesses in the nervous system appear to use preferentially gly-colytically derived ATP (Knull, 1978; Dirks et al., 1980; Raffin et al., 1992; Andersen and Marmarou, 1992).
The conclusions derived from functional brain imaging studies (Fox and Raichle, 1986; Ueki et al., 1988; Prichard et al., 1991; Sappey-Marinier et al., 1992) and from analyses at the cellular level, which indicate that the mammalian brain normally shifts to glycolysis as a source of energy during brief increases in neuronal activity, have formed the basis for the development of the now increasingly popular imaging tech-nique of functional magnetic resonance imaging (MRI; Ogawa et al., 1992; Kwong et al., 1992; Cohen and Bookheimer, 1994; Raichle, 1994). This technique is based on the fact that the magnetic-susceptibility properties of hemoglobin vary with
its degree of oxygen saturation (Ogawa et al., 1990). Physio-logical stimulation results in increased blood flow, implying increased delivery of oxyhemoglobin; however, because of the prevalent glycolytic utilization of glucose in the activated area, oxygen consumption does not increase in parallel. Given this local temporary mismatch between oxygen supply and oxygen consumption, it follows that paradoxically, hemoglo-bin present in the venous blood draining the activated focus is less desaturated than in surrounding areas. The change in oxy-/deoxy hemoglobin ratio due to the presence of an ex-cess oxyhemoglobin yields a distinct signal detected by MRI (Ogawa et al. 1992; Kwong et al., 1992); this is one of the current molecular mechanisms proposed as a basis for func-tional MRI (Cohen and Bookheimer, 1994; Raichle, 1994). Oth-er processes, such as, for example, blood volume increase, may also contribute to the signal (Cohen and Bookheimer, 1994). In fact, the nature of the signal detected by functional MRI has also been recently compared to that of signals obtained using optical imaging techniques at the brain surface during functional activation in laboratory animals (Grinvald et al., 1986; Frostig et al., 1990). The view that has emerged from these studies is that at least one of the signals detected with the particular imaging technique of reflectance is due to the presence of deoxyhemoglobin in the activated area (Bon-hoeffer and Grinvald, 1993), a view that is at odds with the notion of metabolic uncoupling yielding excess
oxyhemoglo-bin during activation. Below, we provide a few considerations
that may offer some useful arguments for the discussion on these contrasting views.
Some Theoretical Considerations on the Nature of the Signals Detected in Optical Imaging Studies during Activation and Their Relationship to Functional MRI
Changes in tissue optical properties that correlated with met-abolic activity were first described almost 70 years ago (Kelin, 1925). Since these intrinsic optical signals were relatively small, it is not until recently that, with the advent of appro-priate amplification procedures, they have been usefully ex-ploited to study brain activation. Although it was shown that transmission of infrared light could be used to monitor blood volume changes and hemoglobin oxygenation state in the in-tact brain (Jobsis, 1977), the technique using the reflectance signal from light at wavelengths between 480 and 940 nm has been more extensively studied and developed (Grinvald et al., 1988). The nature of the events giving rise to the re-flectance signal has not been entirely elucidated, but at least two components have been identified. The first one is the absorption by hemoglobin over almost the entire wavelength range from 480 and 940, which appears to correlate with changes in blood volume. The second, which becomes pre-dominant between 600-630 nm, appears to correspond to the transition of oxyhemoglobin to deoxyhemoglobin, and would thus reflect oxygen delivery (Frostig et al., 1990).
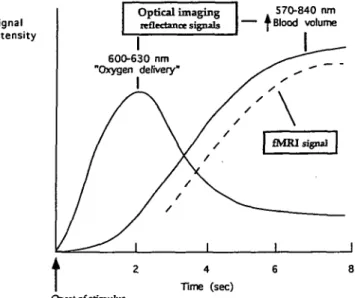
When the time course of the reflectance signal obtained at different wavelengths following activation is compared, it becomes clear that the signal detected at 600 nm precedes the signal at either 570 or 840 nm (Frostig et al., 1990). This was interpreted as an indication that oxygen delivery begins before the increase in blood volume takes place. Since the early signal, which has a latency between 100 and 300 msec is currently used as an index of neuronal activation (Bon-hoeffer and Grinvald, 1993), the notion that the origin of the signal detected in optical imaging studies is deoxyhemoglo-bin has been the prevailing one. A point that is important to note is the fact that, after the initial rise, the signal at 600 nm decreases while the signal at 570 and 840 nm begins to in-crease (Fig. 7). Even more striking is the fact that if the stim-ulus causing the activation is of short duration, the signal at
Signal intensity 570-840 nm —~ • Blood volume Optical imaging reflectance signals Onset of stimulus Time (sec)
Figure 7. Temporal characteristics of reflectance signals obtained by optical imaging
and the fMRI signal. The optical imaging signal recorded at 600-630 nm is taken to reflect primarily the ratio of Hb/HbOr Thus, an increase in signal is interpreted as net "oxygen delivery." However, at these wavelengths the signal could theoretically origi-nate from deoxyhemoglobin (Hb) as well as from either nitrosylhemoglobin (HbNO) or methemoglobin [met(lll)Hb; see text and Fig. 8, for treatment of this point). The optical signal recorded either at 570 or 840 nm is accounted for by the increase in total he-moglobin (Hb + HbO?), a likely consequence of increased blood volume. The fMRI signal is interpreted as an increase in the ratio of HbtyHb, a consequence of the increased blood volume with little or no increase in oxygen consumption by the tissue during activation, which leads to a higher oxyhemoglobin content in the venous blood.
600 nm shows an undershoot (Grinvald et al., 1986). Since the 600 nm signal is taken to reflect predominantly the ratio of deoxyhemoglobin over oxyhemoglobin, the decrease and following undershoot could be interpreted either as the reox-ygenation of hemoglobin, or more likely, as the arrival of large amounts of oxyhemoglobin overcoming the smaller desatur-ation process taking place. This, of course, would be brought about by the increase in blood volume that occurs upon ac-tivation (Fox and Raichle, 1986; Fox et al., 1988). As a net result, during the undershoot phase, it can be predicted that the blood leaving the activated area would have an higher oxygen content than at rest. This is precisely what is observed with functional magnetic resonance imaging (fMRI), a tech-nique based, as noted earlier, on the difference in magnetic susceptibility between oxyhemoglobin and deoxyhemoglo-bin (Cohen and Bookheimer, 1994;Raichle, 1994).The latency of fMRI is longer than optical imaging, that is, a few seconds compared to a few hundred milliseconds (Frostig et al., 1990; Cohen and Bookheimer, 1994; Menon et al., 1994); this would explain why fMRI monitors only the increase in the oxyhe-moglobin signal concomitant with the increase in blood vol-ume (Fig. 7). This interpretation on the origin of the reflec-tance and fMRI signals would agree with PET measurements of blood flow and O2 consumption (Fox and Raichle, 1986;
Fox et al., 1988) which indicate an important increase in blood flow upon activation with only a small increase in O2
consumption.
The mechanism that gives rise to both the early increase in oxygen delivery and to the subsequent increase in blood volume recorded by optical imaging still remains to be fully elucidated. Since the initial proposal by Roy and Sherrington (1890) suggesting that products of cerebral metabolism could be responsible for the coupling of neuronal activity to blood flow, a number of candidates have been identified, including H+, K+ and adenosine (Edvinsson et al., 1993). The latest
po-tential candidate on the list is the gas nitric oxide (NO), al-though variable results were obtained from studies in which inhibition of NO synthesis was achieved to prevent the acti-vation-induced increase in local blood flow (Iadecola et al.,
1994). However, recent evidence has provided indication diat NO, formed through the action of glutamate released during neuronal activation, can, indeed, couple activation to blood flow in the cerebellum (Akgoren et al., 1994).
Much less is known about the mechanism(s) responsible for oxygen delivery. One possibility is that local increases in oxygen consumption by the active neuropil triggers oxygen release from hemoglobin by establishing a pO2 gradient.
How-ever, PET studies show only marginal increases in oxygen con-sumption in activated brain areas (Fox et al., 1988). In pe-ripheral tissues such as muscle, a well-known mechanism re-sponsible for oxygen release during increased metabolic de-mands is the Bohr effect (Stryer, 1988). Actively metabolizing tissues, such as muscle, produce large amounts of CO2 and
H+. Both agents bind to hemoglobin and decrease its affinity
for oxygen, thus causing a local oxygen delivery. A similar mechanism is likely to take place in the brain. In particular, lactate, produced as a consequence of glycolysis-induced ac-tivation (Fox et al., 1988; Prichard et al., 1991; Pellerin and Magistretti, 1994) could provide the necessary H+. One
prob-lem with this mechanism is that it appears too slow to ac-count for the rapid oxygen delivery signal observed with op-tical imaging. Another possibility which, to our knowledge, has not been considered so far, is NO production. This gas is produced during activation (Akgoren et al., 1994; Iadecola et al., 1994) and diffuses rapidly through biological tissues (Van-derkooi et al., 1994). NO has been shown both in free oxy-hemoglobin solutions or in erythrocyte suspensions to react with oxyhemoglobin (Henry et al., 1993). Indeed, based on this well-characterized interaction, hemoglobin is routinely used as an inhibitor of NO's actions since it prevents NO to interact with other molecular targets (Gibson and Roughton, 1957; Martin et al., 1986; Moncada et al., 1991). The interac-tion of NO with hemoglobin can yield two products: methe-moglobin or nitrosylhemethe-moglobin (Henry et al., 1993). Methe-moglobin results from the oxidation of oxyheMethe-moglobin by NO (in this reaction, the iron atom in the heme ring is oxi-dized from Fe2* to Fe3+); indeed, the spectral changes of
ox-yhemoglobin to methemoglobin are used to determine NO formation in tissues (Kelm and Schrader, 1990). In contrast nitrosylhemoglobin results from the binding of NO to the heme ring of either deoxyhemoglobin or methemoglobin (Kanner et al., 1992). NO was also shown to bind with a much greater affinity to the hemoprotein than O2. (Henry et al.,
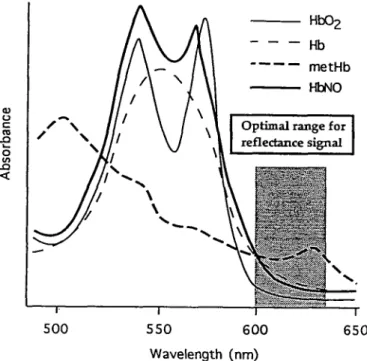
1993). An isosbestic point, that is, the wavelength at which two molecules have identical absorbance properties, exists among nitrosylhemoglobin, methemoglobin, and deoxyhem-oglobin at around 600 nm (Van Assendelft, 1970; Kanner et al., 1992). This is the wavelength at which the signal detected by optical imaging is interpreted as oxygen delivery (Frostig et al., 1990). However, a signal detected at 600 nm can be due to an increase in either nitrosylhemoglobin, methemoglobin, or deoxyhemoglobin, or a combination of them (Fig. 8). Since the early reflectance signal during activation is largest at 605 ± 10 nm (Bonhoeffer and Grinvald, 1993), the possibility should be considered that the optical signal may arise from nitrosylhemoglobin and/or methemoglobin formed by the re-action of NO with hemoglobin. This point is particularly worth considering in view of the feet that PET studies indi-cate only a marginal increase in oxygen consumption upon activation, hence, making the formation of significant amounts of deoxyhemoglobin unlikely. These considerations bring into perspective a possible role of NO in the early signal
O CO Optimal range f or reflectance signal [:••-.-••-::• : 1 500 550 600 650 Wavelength (nm)
Figure 8. Absorption spectra of oxyhemoglobin (HbO2), deoxyhemoglobin (Hb),
methe-moglobin (metHb), and nitrosylhemethe-moglobin (HbNO; adapted from Van Assendelft, 1970, and Kanner et al., 1992).
detected by optical imaging techniques (Grinvald et al., 1986; Frostig et al., 1990).
Concluding Remarks
The focus of this article has been to try to highlight the latest observations of brain energy metabolism at the cellular and molecular levels and their relationships with the recent de-velopments in functional brain imaging. From the conver-gence of in vitro and in vivo observations, a novel emerging concept is that the brain resorts to glycolysis to face increased energy demands during activation. Astrocytes appear to be the predominant cellular locus of this process. The activation-induced glycolysis provides the signal for '"F-2DG studies, 'H-NMR lactate spectroscopy, and, ultimately, fMRl. Therefore, while the cellular and even molecular basis for these three signals appears to be reasonably clarified, the nature of the molecular mechanism(s) that underlie the coupling between activation and increased blood flow is still elusive, even 100 years after the seminal work of Roy and Sherrington (1890). Notes
This article is dedicated to the memory of Amico Bignami, who made fundamental contributions to the field of astrocyte biology. We thank Dr. J.-L. Martin for stimulating discussions and Drs. N. and O. Schaad for useful references concerning NO. This work was supported by Fonds National de la Recherche Scientifique Grant 31-£0565.94 to RJ.M.
Address correspondence to Pierre J. Magistretti, M.D., Ph.D., Insti-rut de Physiologie, Faculte de Medecine, Universite de Lausanne, 7, Rue du Bugnon, CH-1005 Lausanne, Switzerland.
References
Akgoren N, Fabricius M, Lauritzen M (1994) Importance of nitric oxide for local increases of blood flow in rat cerebellar cortex during electrical stimulation. Proc Natl Acad Sci USA 91:5903-5907.
Andersen BJ, Mannarou A (1992) Functional compartmentalization of energy production in neural tissue. Brain Res 585:190-195. Andriezen WL (1893) On a system of fibre-like cells surrounding the
blood vessels of the brain of man and mammals, and its physio-logical significance. Int Monatsschr Anat Physiol 10:532-540.
Barres BA (1991) New roles for glia.J Neurosci 11:3685-3694. Bignami A (1991) Discussions in neuroscience, Vol 8, Glial cells in
the central nervous system, pp 1-45. Amsterdam: Hsevier. Bonhoeffer T, Grinvald A (1993) The layout of iso-orientation
do-mains in area 18 of cat visual cortex: optical imaging reveals a pinwheel-like organization. J Neurosci 13:4157-4180.
Bowman CL, Kimelberg HK (1984) Excitatory amino acids directly depolarize rat brain astrocytes in primary culture. Nature 311:
656-659.
Cohen MS, Bookheimer SY (1994) Localization of brain function us-ing magnetic resonance imagus-ing. Trends Neurosci 17:268-277. Cohen PJ, Alexander SC, Smith FC, Reivich M, Wollman H (1967)
Effects of hypoxia and normocabia on cerebral blood flow and metabolism in conscious man. J Appl Physiol 23:183-189. Deiber MP, Pollak P, Passingham R, Landais P, Gervason C, Cinotti L,
Friston K, Frackowiak R, Mauguiere F, Benabid AL (1993) Thalam-ic stimulation and suppression of parkinsonian tremor. Brain 116: 267-279.
Dirks B, Hanke J, Krieglstein J, Stock R, Wickop G (1980) Studies on the linkage of energy metabolism and neuronal activity in the isolated perfused rat brain. J Neurochem 35:311-317.
Dringen R, Hamprecht B (1993) Differences in glycogen metabolism in astroglia-rich primary cultures and sorbitol-selected astroglial cultures derived from mouse brain. Glia
8:143-149-Dringen R, Gebhardt R, Hamprecht B (1993a) Glycogen in astro-cytes: possible function as lactate supply for neighboring cells. Brain Res 623:208-214.
Dringen R, Wiesinger H, Hamprecht B (1993b) Uptake of L-lactate by cultured rat brain neurons. Neurosci Lett 163:5-7.
EdvinssonL,MacKenzieET,McCullochJ (1993) Cerebral blood flow and metabolism, pp 161-162. New York: Raven.
Erecinska M (1989) Stimulation of the Na*/K* pump activity during electrogenic uptake of acidic amino acid transmitters by rat brain synaptosomes.J Neurochem 52:135-139.
Erecinska M, Dagani F (1990) Relationships between the neuronal sodium/potassium pump and energy metabolism—effects of K*, Na+, and adenosine triphosphate in isolated brain synaptosomes.
J Gen Physiol 95:591-616.
Fellows LK, Boutelle MG, Fillenz M (1993) Physiological stimulation increases nonoxidative glucose metabolism in the brain of the freely moving rat.J Neurochem 60:1258-1263.
Fishman RS, Karnovsky ML (1986) Apparent absence of a translocase in the cerebral glucose-6-phosphatase system. J Neurochem 46: 371-378.
Folbergrova J (1974) Energy metabolism of mouse cerebral cortex during homocysteine convulsions. Brain Res 81:443-454. FonnumF (1984) Glutamate: a neurotransmitter in mammalian brain.
J Neurochem 42:1-11.
Fox PT, Raichle ME (1986) Focal physiological uncoupling of cere-bral blood flow and oxidative metabolism during somatosensory stimulation in human subjects. Proc Nad Acad Sci USA 83:1140-1144.
Fox PT, Raichle ME, Mintun MA, Dence C (1988) Nonoxidative glu-cose consumption during focal physiologic neural activity. Sci-ence 241:462-464.
Frackowiak RSJ, Lenzi GL, Jones T, Heather JD (1980) Quantitative measurement of regional cerebral blood flow and oxygen metab-olism in man using "O and positron emission tomography: theory, procedure and normal values.J Comput Assist Tomogr 4:727-736. Frostig RD, Lieke EE, Ts'o DY, Grinvald A (1990) Cortical functional architecture and local coupling between neuronal activity and the microcirculation revealed by in vivo high-resolution optical im-aging of intrinsic signals. Proc Natl Acad Sci USA 87:6082-6086. Gibson QH, Roughton FJW (1957) The kinetics and equilibria of the
reactions of nitric oxide with sheep haemoglobin. J Physiol (Lond) 136:507-526.
Ginsberg MD, Dietrich WD, Busto R (1987) Coupled forebrain in-creases of local cerebral glucose utilization and blood flow during physiologic stimulation of a somatosensory pathway in the rat: demonstration by doublelabel autoradiography. Neurology 37:11 -19.
Grinvald A, Lieke E, Frostig RD, Gilbert CD, Wiesel TN (1986) Func-tional architecture of cortex revealed by optical imaging of intrin-sic signals. Nature 324:361-364.
Grinvald A, Frostig RD, Iicke E, Hildesheim R (1988) Optical imaging of neuronal activity. Physiol Rev 68:1285-1366.
Hand PJ, Greeberg JH, Miselis RR, Weller WL, Reivich M (1978) A normal and altered column: a quantitative and qualitative (UC>2 deoxyglucose (2DG) mapping study. Soc Neurosci Abstr 4:553. Henry Y, Lepoivre M, Drapier J-C, Ducrocq C, Boucher J-L, Guissani A
(1993) EPR characterization of molecular targets for NO in mam-malian cells and organelles. FASEB J 7:1124-1134.
Hossmann KA, linn F (1987) Regional energy metabolism during functional activation of the brain. J Cereb Blood Flow Metab 7: S297-S29O.
Iadecola C, Pelligrino DA, Moskowitz MA, Lassen NA (1994) Nitric oxide synthase inhibition and cerebrovascular regulation. J Cereb Blood How Metab 14:175-192.
IdeT.SteinkeJ.CahillGFJr (1969) Metabolic interactions of glucose, lactate, and B-hydroxybutyrate in rat brain slices. Am J Physiol 217:784-792.
Izumi Y, Benz AM, Zorumski CF, Olney JW (1994) Effects of lactate and pyruvate on glucose deprivation in rat hippocampal slices. Neuroreport 5:617-620.
Jobsis FF (1977) Noninvasive, infrared monitoring of cerebral and myocardial oxygen sufficiency and circulatory parameters. Sci-ence 198:1264-1267.
Kadekaro M, Crane AM, Sokoloef L (1985) Differential effects of elec-trical stimulation of sciatic nerve on metabolic activity in spinal cord and dorsal root ganglion in the rat. Proc Natl Acad Sci USA 82:6010-6013.
Kanner BI (1993) Glutamate transporters from brain: a novel neu-rotransmitter transporter family. FEBS Lett 325:95-99.
Kanner J, Harel S, Granit R (1992) Nitric oxide, an inhibitor of lipid oxidation by lipoxygenase, cyclooxygenase and hemoglobin. Lip-ids 27:46-49.
Keevil T, Mason HS (1978) Molecular oxygen in biological oxida-tions—an overview. Methods Enzymol 52:3-40.
Kelin D (1925) On cytochrome, a respiratory pigment, common to animals, yeast, and higher plants. Proc R Soc Lond [Biol] 98:312-339.
Kelm M, Schrader J (1990) Control of coronary vascular tone by nitric oxide. Ore Res 66:1561-1575.
Kennedy C, Des Rosiers MH, Sakurada O, Shinohara M, Reivich M, Jehle JW, Sokoloff L (1976) Metabolic mapping of the primary visual system of the monkey by means of the autoradiographic [uC]deoxyglucose technique. Proc Natl Acad Sci USA 73:4230-4234.
Kennedy C, Sakurada O, Shinohara M, Jehle J, Sokoloff L (1978) Local cerebral glucose utilization in the normal conscious macaque monkey. Ann Neurol 4:293-301.
Kety SS (1957) The general metabolism of the brain in vivo. In: The metabolism of the nervous system (Richter D, ed), p 221. London: Pergamon.
Kety SS, Schmidt CF (1948) The nitrous oxide method for the quan-titative determination of cerebral blood flow in man: theory, pro-cedure, and normal values. J Clin Invest
27:476-483-Kimelberg HK, Norenberg MD (1989) Astrocytes. Sci Am 260:44-52.
Kimelberg HK, Biddlecome S, Narumi S, Bourke RS (1978) ATPase and carbonic anhydrase activities of bulk-isolated neuron, glia and synaptosome fractions from rat brain. Brain Res 141:305-323. Kimelberg HK, Jalonen T, Walz W (1993) Regulation of brain
micro-environment: transmitters and ions. In: Astrocytes: pharmacology and function (Murphy S, ed), p 193. San Diego: Academic. Klatt P, Schmidt K, Uray G, Mayer B (1993) Multiple catalytic
func-tions of brain nitric oxide synthase. J Biol Chem 268:14781-14787.
Knull HR (1978) Association of glycolytic enzymes with paniculate fractions of nerve endings. Biochim Biophys Acta 522:1-9. Kwong KK, Belliveau JW, Chesler DA, Goldberg IE, Weisskoff RM,
Pon-celet BP, Kennedy DN, Hoppel BE, Cohen MS, Turner R, Cheng H-M, Brady TJ, Rosen BR (1992) Dynamic magnetic resonance im-aging of human brain activity during primary sensory stimulation. Proc Natl Acad Sci USA 89:5675-5679.
Larrabee MG (1983) Lactate uptake and release in the presence of glucose by sympathetic ganglia of chicken embryos and by neu-ronal and nonneuneu-ronal cultures prepared from these ganglia. J Neurochem 40:1237-1250.
Larrabee MG (1992) Extracellular intermediates of glucose metabo-lism: fluxes of endogenous lactate and alanine through extracel-lular pools in embryonic sympathetic ganglia. J Neurochem 59:
1041-1052.
Lipton P (1973) Effects of membrane depolarization on nicotinami-de nucleotinicotinami-de fluorescence in brain slices. Biochem J 136:999-1009.
Lipton P (1988) Regulation of glycogen in the dentate gyms of the
in vitro guinea pig hippocampus; effect of combined deprivation
of glucose and oxygen. J Neurosci Methods 28:147-154. Lipton P, Robacker K (1983) Glycolysis and brain function: [K+]o
stimulation of protein synthesis and K+ uptake require glycolysis. FASEB J 42:2875-2880.
Magistretti PJ, Morrison JH (1988) Noradrenaline- and vasoactive in-testinal peptide-containing neuronal systems in neocortex: func-tional convergence with contrasting morphology. Neuroscience 24:367-378.
Magistretti PJ, Morrison JH, Shoemaker WJ, Sapin V, Bloom FE (1981) Vasoactive intestinal polypeptide induces gfycogenolysis in mouse cortical slices: a possible regulatory mechanism for the local con-trol of energy metabolism. Proc Natl Acad Sci USA 78:6535-6539. Magistretti PJ, Manthorpe M, Bloom FE, Varon S (1983) Functional receptors for vasoactive intestinal polypeptide in cultured astrog-lia from neonatal rat brain. Regul Pept 6:71-80.
Magistretti PJ, Sorg O, Martin J-L (1993) Regulation of glycogen me-tabolism in astrocytes: physiological, pharmacological, and patho-logical aspects. In: Astrocytes: pharmacology and function (Mur-phy S, ed), pp 243-265- San Diego: Academic.
Martin W, Smith JA, White DG (1986) The mechanisms by which haemoglobin inhibits the relaxation of rabbit aorta induced by nitrovasodilators, nitric oxide, or bovine retractor penis inhibitory factor. Br J Pharmacol 89:563-571.
Mata M, Fink DJ, Gainer H, Smith CB, Davidsen L, Savaki H, Schwartz WJ, Sokoloff L (1980) Activity-dependent energy metabolism in rat posterior pituitary primarily reflects sodium pump activity. J Neurochem 34:213-215.
McCulloch J, Savaki HE, McCuUoch MC, Sokoloff L (1980) Retina-dependent activation by apomorphine of metabolic activity in the superficial layer of the superior colliculus. Science 207:313-315. Mcllwain H (1953) Substances which support respiration and met-abolic response to electrical impulses in human cerebral tissues. J Neurol Neurosurg Psychiatry 16:257-266.
Mcllwain H, Bachelard HS (1985) Biochemistry and the central ner-vous system, Vol 5, p 54. New York: Churchill Livingstone. Melzer P, Van der Loos H, Dorfl J, Welker E, Robert P, Emery D, Berrini
JC (1985) A magnetic device to stimulate selected whiskers of freely moving or restrained small rodents: its application in a deoxyglucose study. Brain Res 348:229-240.
Menon R, Hu X, Mitra P, Ogawa S, Ugurbil K (1994) Signal charac-teristics in functional MRI of the brain upon visual stimulation. Soc Neurosci Abstr 20:148.
Mita M, Hall PF (1982) Metabolism of round spermatids from rats: lactate as the preferred substrate. Biol Reprod 26:445-455. Miyaoka M, Shinohara M, Batipps M, Pettigrew KD, Kennedy C,
So-koloff L (1979) The relationship between the intensity of the stimulus and the metabolic response in the visual system of the rat. Acta Neurol Scand [Suppl] 60:16/014193/
Moncada S, Palmer RMJ, Higgs EA (1991) Nitric oxide: physiology, pathophysiology, and pharmacology. Pharmacol Rev 43:109. Morrison JH,GrzannaR,MolliverM,CoyleJT (1978) The distribution
and orientation of noradrenergic fibers in neocortex of the rat: an immunofluorescence study. J Comp Neurol 181:17-40.
Ogawa S, Lee TM, Kay AR, Tank DW (1990) Brain magnetic reso-nance imaging with contrast dependent on blood oxygenation. Proc Natl Acad Sci USA 87:9868-9872.
Ogawa S, Tank DW, Menon R, Ellermann JM, Kim SG, Merkle H, Ug-urbil K (1992) Intrinsic signal changes accompanying sensory stimulation: functional brain mapping with magnetic resonance imaging. Proc Natl Acad Sci USA 89:5951-5955.
O'Kusky J, Colonnier M (1982) A laminar analysis of the number of neurons, glia and synapses in the visual cortex (area 17) of the adult macaque monkey.J Comp Neurol 210:278-290.
Pardridge WM, Oldendorf WH (1977) Transport of metabolic sub-strates through the blood-brain barrier. J Neurochem 28:5/ 014193/