HAL Id: hal-02522372
https://hal-amu.archives-ouvertes.fr/hal-02522372
Submitted on 25 Jan 2021HAL is a multi-disciplinary open access archive for the deposit and dissemination of sci-entific research documents, whether they are pub-lished or not. The documents may come from teaching and research institutions in France or abroad, or from public or private research centers.
L’archive ouverte pluridisciplinaire HAL, est destinée au dépôt et à la diffusion de documents scientifiques de niveau recherche, publiés ou non, émanant des établissements d’enseignement et de recherche français ou étrangers, des laboratoires publics ou privés.
ISOCAM 3-12 µ m imaging of five galactic compact Hii
regions
Annie Zavagno, V. Ducci
To cite this version:
Annie Zavagno, V. Ducci. ISOCAM 3-12 µ m imaging of five galactic compact Hii regions. Astronomy and Astrophysics - A&A, EDP Sciences, 2001, 371 (1), pp.312-327. �10.1051/0004-6361:20010356�. �hal-02522372�
DOI: 10.1051/0004-6361:20010356
c
ESO 2001
Astrophysics
&
ISOCAM 3–12 µm imaging of five galactic compact H
II
regions
?
A. Zavagno1 and V. Ducci1
Observatoire de Marseille, 2 place Le Verrier, 13248 Marseille Cedex 4, France Received 23 September 1999 / Accepted 7 March 2001
Abstract. We present 3–12 µm ISOCAM observations of the five Galactic compact H ii regions Sh 61, Sh 138, Sh 152, Sh 156 and Sh 186. The unidentified infrared bands (UIBs) centred at 3.3, 6.2, 7.7, 8.6 and 11.2 µm – and underlying continuum – are imaged using the SW1, SW2, LW4, LW6 and LW8 filters. Images are also obtained at 5.985, 6.911, 8.222, 10.520 and 12.000 µm using the circular variable filter (CVF). We show that the 5.985 µm emission represents a true continuum reference for the 6.2 µm band, allowing a derivation of this band’s properties. Due to uncertainties in the continuum estimates, only lower limits can be given for the 3.3, 7.7 and 11.3 µm band fluxes. These limits agree with previous results found in the literature. The distribution of the bands coincide. The 3.3 µm emission is not observed in high extinction zones, suggesting a lower temperature of the carriers and/or a higher abundance of larger molecules in those zones. The 6.2 µm band emission peaks outside the ionized zone, in the photodissociation region. The 6.2 µm band luminosity correlates with the far UV field intensity, suggesting a UV excitation. We also find a correlation between the spatial distribution of the 6.2 µm band emission and zones of strong 2.122 µm H2 emission due to ultraviolet fluorescence. This suggests that both emissions are due to UV
excitation. The 6.2 µm emission is slightly closer to the exciting star. This suggests that the band carriers survive in the H i zone. The 12 µm emission traces the continuum emission from very small grains, when present, and follows well the distribution of UIB emission. This suggests a link between the two emission carriers. The emission peak observed on the star in Sh 61 and Sh 156 indicates that the continuum from very small grains dominates the emission in highly excited regions.
Key words. ISM: H ii regions – Dust ISM: extinction – ISM: lines and bands
1. Introduction
Compact H ii regions are associated with young massive stars and with a large amount of dust. The presence of the unidentified infrared bands (UIBs) in the spectra of these regions is well established (Jourdain de Muizon et al. 1990a; Zavagno et al. 1992). These emission bands are centred at 3.3, 6.2, 7.7, 8.6 and 11.2 µm. Duley & Williams (1981) were the first to note that some UIB wave-lengths are characteristic of the bending and stretching modes of CC and CH bonds in aromatic molecules. Since then, various carriers have been proposed for these bands including the polycyclic aromatic hydrocarbons (PAHs; L´eger & Puget 1984; Allamandolla et al. 1985) and more amorphous materials containing aromatic hydrocarbons (Sakata et al. 1984; Borghesi et al. 1987; Papoular et al. 1989). The ISO mission has greatly enlarged our knowl-edge of mid-IR emission properties over a wide range of
Send offprint requests to: A. Zavagno,
e-mail: [email protected]
?
Based on observations made with the Infrared Space Observatory (ISO). ISO is an ESA project with instruments funded by ESA Member States (especially the PI countries: France, Germany, The Netherlands and the UK) and with the participation of ISAS and NASA.
UV environments. The mid-IR spectrum was found to be insensitive to the radiation field intensity up to 104times
the solar vicinity value (Boulanger et al. 2000). The ob-served constancy of the band positions and profiles dis-agrees with the laboratory spectra of PAH molecules that show important variations (band intensity ratios) as a function of the state of the molecule (ionisation state, hydrogenation degree). The mean PAH ionisation is pre-dicted to increase with the intensity of the UV radiation field, leading to a drastic change in the band intensity ra-tios. Uchida et al. (1998) first pointed out another prob-lem by publishing a “normal” UIB spectrum associated with the reflection nebula vdB 133 in which the UV flux is low. Then, Pagani et al. (1999) found no correlation between the mid-IR and far-UV emission in M 31. The constancy of the UIB spectrum and the presence of UIB emission in UV-poor environments pose problems for the carriers’ identification (Uchida et al. 2000). The observed constancy of the UIB spectrum could indicate that the carriers are aromatic hydrocarbon particles larger than the molecules studied in the laboratory (Boulanger et al. 2000). The observed correlation between the UIB distri-bution and the far-infrared intensity (Onaka et al. 2000) reinforces the idea of larger particles for the UIB carriers. One way to constrain the nature of the UIB carriers is to
Article published by EDP Sciences and available at http://www.aanda.org or http://dx.doi.org/10.1051/0004-6361:20010356
look at their properties as a function of the physical envi-ronment (gas density, excitation conditions). Considering a sample of objects in a similar evolution stage should weaken the impact of dust evolution (Cesarsky et al. 2000) in the interpretation. In order to study the properties of the mid-IR emission as a function of physical conditions, we have carried out an observational programme of direct imaging between 3 and 12 µm using ISOCAM (Cesarsky et al. 1996a) in a sample of five Galactic compact H ii regions. These regions display different properties mainly related to the spectral type of their main exciting star. We report here the first results centred on the distribution of the observed emissions. Section 2 presents the sample of compact H ii regions together with the ISOCAM obser-vations and the data reduction procedure. The observed emissions are presented in Sect. 3 and discussed in Sect. 4. The conclusions are summarized in Sect. 5.
2. Observations and data reduction
2.1. The sample
Five Galactic compact H ii regions have been selected for this programme on the basis of the following criteria:
– high 12 µm brightness (IRAS 12 µm flux ≥10 Jy); – presence of the 7.7, 8.6 and 11.3 µm bands in IRAS low
resolution spectra, together with the absence of silicate absorption at 10 and 18 µm;
– known spectral type for the main exciting star; – small optical size (diameter≤30 in the optical). The main properties of the sources are summarized in Table 1. Columns 1 and 2 give the names of the sources in the Sharpless catalogue (1959) sources and of the associ-ated IRAS sources. The spectral type of the main exciting star is given in Col. 3. The distance is given in Col. 4. The total and far UV (FUV; 91–240 nm) luminosities, both calculated from the models of Schaerer & de Koter (1997) for the given spectral type, are given in Cols. 5 and 6. Note that these values represent lower limits, as the main exciting star is often found associated with a dense cluster in such regions (Smutko & Larkin 1999). The FUV luminosity is given to derive the FUV radiation field intensity, at a given position, in units of the local interstellar radiation field, G0. A value of G0 = 1
corre-sponds to a FUV radiation field of 1.6 10−3erg s−1 cm−2 between 91.2 and 240 nm (Habing 1968). The luminos-ity emitted in the 12, 25, 60 and 100 µm IRAS bands (LIR) was computed by summing the observed flux
densi-ties in the individual IRAS bandpasses using the formula
LIR= 4πD2
X
i
(Sνi∆νi), where D is the distance to the
source, ∆ν is the IRAS bandwidth, and Sν the observed
flux density. This luminosity is given in Col. 7. The co-ordinates of the CAM field centre are given in Col. 8. References for the spectral type and distance are given in footnotes.
Figure 1 presents R-band images of the five sources extracted from the Digitized Sky Survey (DSS-II). The field observed with ISOCAM is shown. When available, the radio emission has been superimposed on the optical images. The radio emission at 6 cm is taken from Felli & Harten (1981) for Sh 138 and Sh 186 and from Birkinshaw (1978) for Sh 156. That for Sh 152 at 11 cm is from the observations of Scott published in Cox et al. (1987). We give hereafter some information about the morphology of the regions. We will see that the distribution of the mid-IR emission is linked with it.
Sh 61 is a compact H ii region ionized by a pre-main-sequence Be star (AS 310) associated with a dense star cluster (Testi et al. 1998). AS 310 is a binary system and high angular resolution observations in the near-IR (Ageorges et al. 1997) revealed four more sources located within 500 of the binary. A 30 M mass of gas is asso-ciated with this source (1.3 mm observations of Henning et al. 1994). The near-IR study in the J HK bands and in the H2 2.122 µm and Brγ 2.166 µm lines by Smutko &
Larkin (1999) reveal the presence of a bright H2region on
the northern edge of the nebula (see their Fig. 1). Ground based spectroscopy reveals the presence of the 3.3 µm band (Brooke et al. 1993). Despite the spectral type given for the main exciting star we will see that its mid-IR emis-sion presents extreme properties. The distance is well determined (Georgelin, private communication) and the spectral type, determined using optical spectroscopy, is reliable.
Sh 138 is a compact H ii region associated with a dense cluster (Deharveng et al. 1999). The core of the associ-ated molecular cloud (Johansson et al. 1994) is locassoci-ated 1000 south-east of the main exciting star. In this zone, ra-dio emission (see Fig. 1) is observed without associated Hα emission. The sharp decrease of the optical emission in this direction suggests the presence of dust.
Sh 152 (Heydari-Malayeri & Testor 1981; Cox et al. 1987) has a well-defined interface between the ionized and neutral media. Two peaks of emission (called α and β in Heydari-Malayeri & Testor 1981) are observed in this re-gion. [O iii] 500.7 nm and He i 587.5 nm emissions coincide with those peaks. The dust is concentrated in a layer lo-cated south-west of the main exciting star (see Fig. 2b in Cox et al. 1987). A bright shell-shaped H2 region is
ob-served at the edge of the ionized zone (see Fig. 8 in Smutko & Larkin).
Sh 156 is a bright H ii region with a horseshoe shape (Heydari-Malayeri et al. 1980). The radio emission peak is slightly displaced to the north-west of the Hα emission peak (cf. Cox et al. 1987) indicating the presence of dust in this zone. Strong [O iii] 500.7 nm emission (Heydari-Malayeri et al. 1980) confirms the high excitation degree of this nebula.
Sh 186 is a compact, low density region (Hunter 1992). The radio and optical emissions coincide well in this case. Near-IR measurements revealed the presence of heated dust (Felli & Harten 1981) but IRAS measurements
Sh 156 Sh 186 Sh 152 Sh 156 Sh 138 Sh 61
Fig. 1. DSS R-band images for the five sources. The inscribed rectangles show the areas observed with ISOCAM. Radio emission is superimposed as contours (see text). The white dot represents the position of the main exciting star. North is up, east is left
Table 1. Main properties of the observed sources
Source IRAS Name ST Distance log LTOT log LFUV log LIR CAM field centre
kpc L L L (J2000) Sh 61 18306−0500 B0e (1) 2.5 (2) 4.77 4.67 3.88 18h33m21.s2 −04◦58002.004 Sh 138 22308+5812 O9V (3) 5 (4) 5.01 4.83 4.55 22h32m45.s9 +58◦28022.000 Sh 152 22566+5830 O9V (5) 3.6 (5) 5.01 4.83 4.40 22h58m41.s3 +58◦46057.004 Sh 156 23030+5958 O7V (6) 5.75 (6) 5.40 4.98 4.91 23h05m10.s6 +60◦14040.006 Sh 186 01056+6251 O9.5V (3) 3.6 (3) 4.94 4.71 3.64 01h08m48.s5 +63◦07018.005
References: (1) Cohen & Kuhi (1979); (2) Georgelin & Georgelin (1970); (3) Felli & Harten (1981); (4) Deharveng et al. (1999); (5) Crampton et al. (1978); (6) Georgelin (1975).
indicate a weak infrared emission (Jourdain de Muizon et al. 1990a; Zavagno et al. 1992).
2.2. Observations and data reduction
The 3–12 µm ISOCAM observations were made with the 3.000 pixel size and the small field mirror. The field covered is 8700×8700 for Sh 61, Sh 152 and Sh 186 and 17400×8700 for Sh 138 and Sh 156 (see Fig. 1). Observations using the SW1 (3.05–4.1 µm), SW2 (3.2–3.4 µm), LW4 (5.5–6.5 µm), LW6 (7–8.5 µm) and LW8 (10.7–12 µm) filters were ob-tained to look at the distributions of the 3.3, 6.2, 7.7 and 11.2 µm emission bands and continuum. Five CVF ob-servations were made at 5.985, 6.911, 8.222, 10.520 and 12.000 µm with a F W HM that varies between 0.156 and 0.295 µm. The elementary observing time was 2.1 s and the gain was set to 2. The same exposure time was used for all the regions and the number of elementary frames varies between 60 for LW filters to 210 for SW filters. About 120 images were taken for each continuum measurement using the CVF. The data were processed with the off-line pipeoff-line version 7 (OLP V7) and were analysed using CAM Interactive Analysis (CIA, Ott et al. 1997) version 3. The standard procedure was applied: dark correction, deglitching, stabilisation, flat field correction and calibra-tion (see Stark et al. 1999 for details). The stabilisacalibra-tion was done using the models developed by Tiph`ene et al. (2000) and Coulais & Abergel (1998) for the SW and LW CAM detectors, respectively. The results of this procedure are robust because the observed sources are bright (12 µm IRAS flux between 10 and 40 Jy) and a large number of elementary frames were taken, allowing the detector to reach stabilisation at the end of an observation. The fi-nal fluxes are given in janskys and the uncertainties are less than 8%. The images were recentred using the USNO-A2.0 catalogue (Monet et al. 1998). We used the stars that are seen both in the visible (on DSS images) and at 3 µm (SW1 images). Then the long wavelength infrared emis-sions (LW and CVF images) are recentred to coincide with the SW emission. The position shift is, at most, of 2 pixels (600).
2.3. What is observed
We describe, hereafter, the observed emissions. When speaking about the UIB and underlying continuum emis-sions we consider that a continuum emission is associated with the bands. Uchida et al. (2000) discussed this prob-lem. The derived band and continuum fluxes are quite sensitive to how one fits the UIBs, i.e. using Gaussian or Lorentzian profiles, and chooses the continuum. In partic-ular, Boulanger et al. (1998) fit the bands of NGC 7023 with a Lorentzian profile, so the apparent continuum is due to the wings of the band. Note that in this case there is little continuum contribution from very small grains af-ter fitting the UIBs with Lorentzians. An alaf-ternative is to consider that there is a continuum associated with the bands and linked with the band carriers. In this case the continuum is estimated from measurements outside the band (see Uchida et al. 2000). Tran (1998) has shown that the UIB fluxes derived for NGC 7023 using Gaussian or Lorentzian fit are well correlated, differing only by a multiplicative constant. Because of this, comparisons must be made between results derived with the same method. The band integration limits are also important (Uchida et al. 2000).
The SW1 filter (3.05–4.1 µm) contains both the 3.3 µm emission band and the satellite bands observed between 3.35 and 3.8 µm (see Jourdain de Muizon et al. 1990b). The contribution of these bands to the SW1 emission is less than 10%. Near the exciting star, hydrogen recom-bination lines (Pfδ at 3.296 µm and Brα at 4.05 µm) are present but become negligible outside the ionized zone (see Fig. 1 in Verstraete et al. 1996). The SW2 filter (3.2– 3.4 µm) is centred on the 3.3 µm band. We used the SW1 emission to estimate the 3.3 µm band continuum. We des-ignate the SW1 and the SW2 width by ∆ν1and ∆ν2. The
difference, in intensity, between the SW1 and SW2 emis-sion gives an estimate of the continuum emisemis-sion through a filter of equivalent width (∆ν1−∆ν2). This value is then
normalised to the SW2 filter width and subtracted from the total SW2 emission. The continuum is clearly overesti-mated in the ionized zones due to the presence of hydrogen recombination lines but the agreement found between our derived values and previous results (see Sect. 4.1) indicates that the continuum estimate is correct outside the ionized zones.
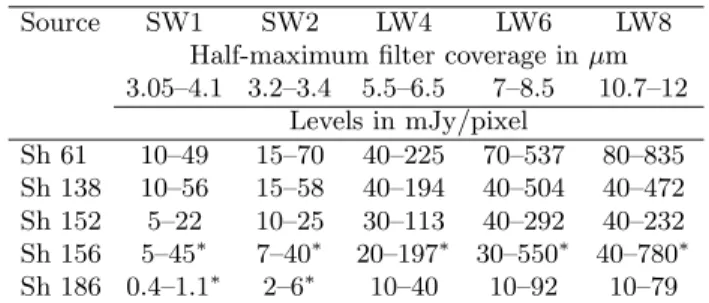
Table 2. Range of levels in Fig. 2 (in mJy/pixel) for the filters
Source SW1 SW2 LW4 LW6 LW8
Half-maximum filter coverage in µm 3.05–4.1 3.2–3.4 5.5–6.5 7–8.5 10.7–12 Levels in mJy/pixel Sh 61 10–49 15–70 40–225 70–537 80–835 Sh 138 10–56 15–58 40–194 40–504 40–472 Sh 152 5–22 10–25 30–113 40–292 40–232 Sh 156 5–45∗ 7–40∗ 20–197∗ 30–550∗ 40–780∗ Sh 186 0.4–1.1∗ 2–6∗ 10–40 10–92 10–79
∗Not regularly spaced levels.
The 6.2 µm band emission is obtained by subtracting the 5.985 µm CVF emission from the LW4 emission.
The 6.911 µm emission is affected by the [Ar ii] emis-sion line at 6.983 µm in the ionized region due to the low ionisation potential (15.7 eV) of argon (see Fig. 1 in Roelfsema et al. 1996). This emission traces well the ionized region (Cesarsky et al. 2000b).
The LW6 filter (7–8.5 µm) includes the 7.7 µm band and part of the 8.6 µm band. At 8.222 µm, the wings of these two bands create part of the measured emission and part may be due to small grains (see Chap. 2 in Tran 1998). We used a linear interpolation between the 6.911 and 8.222 µm to estimate the continuum associated with the 7.7 µm band. The 7.7 µm band emission is obtained by subtracting this continuum from the LW6 emission.
[S iv] emission at 10.52 µm requires a high ionisation potential (35 eV) and, if present, should peak near the ionizing star.
The LW8 filter (10.7–12 µm) includes the 11.04 and 11.2 µm bands, the emission “plateau” (Allamandola et al. 1989) together with the short wavelength part of the strong rising continuum observed in compact H ii regions (see Fig. 3 in Roelfsema et al. 1998). This continuum probably corresponds to emission from very small grains (Tran 1998). The exact nature of this grain population, suggested by D´esert et al. (1990) to explain the 25 µm emission excess observed by IRAS, remains unclear. The contribution of very small grains’ emission to the 6–12 µm continuum depends on the peak wavelength of the small grains’ emission (the shorter the peak wavelength, the higher its contribution to the 6–12 µm continuum). The 12 µm measurement can be used to study this contin-uum emission, if present. The 11.3 µm band emission is obtained by subtracting a continuum estimated using a linear interpolation between the two surrounding CVF measurements at 10.5 and 12 µm.
3. Observed emissions
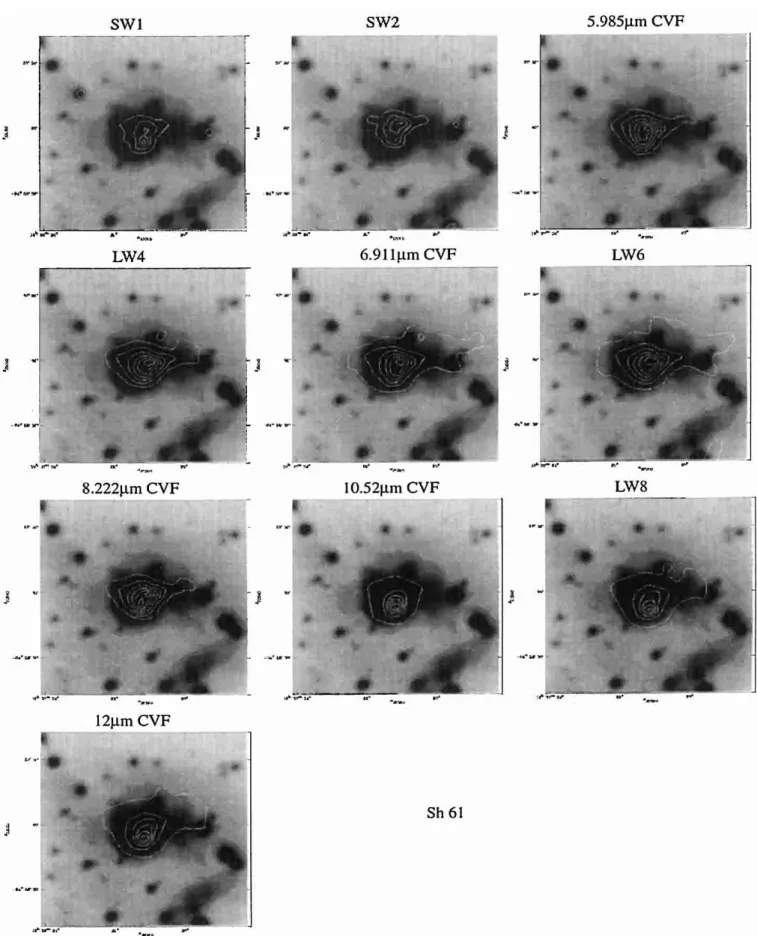
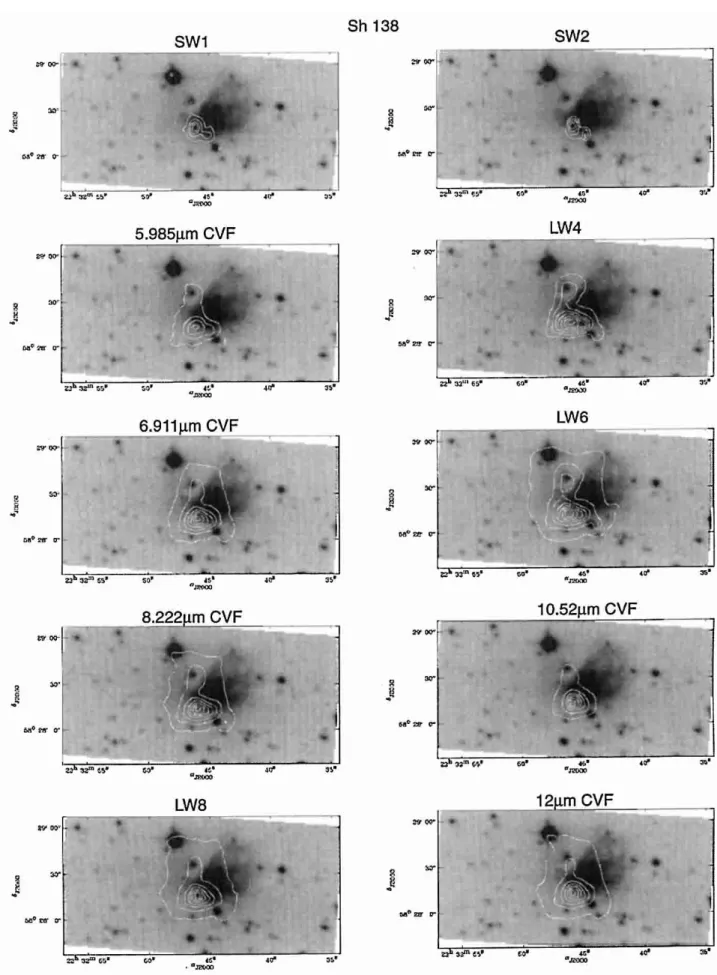
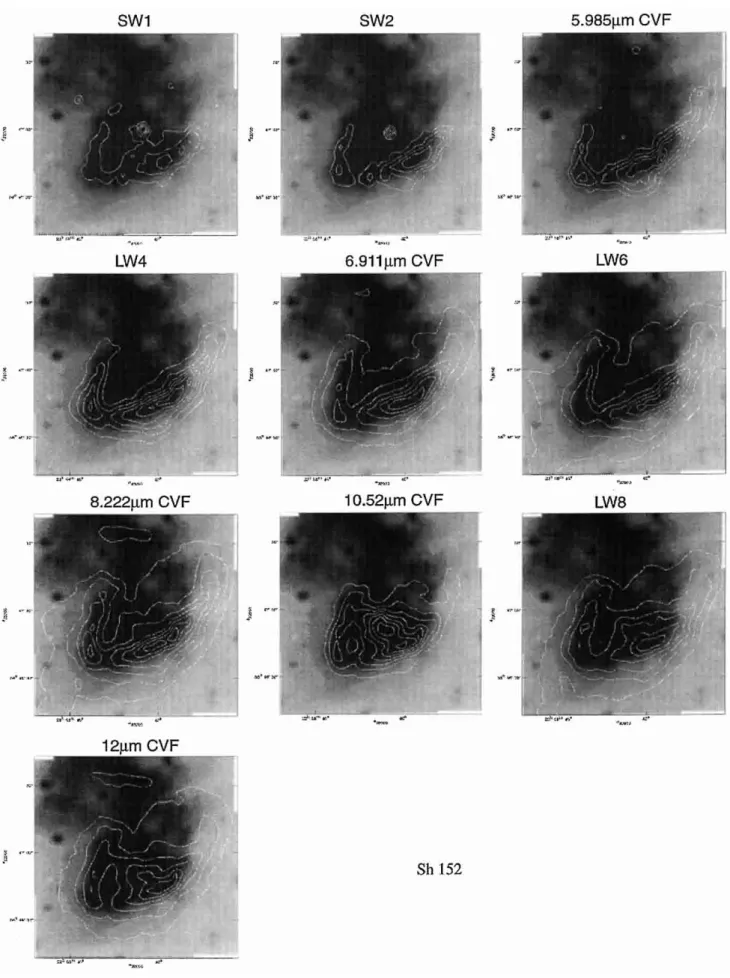
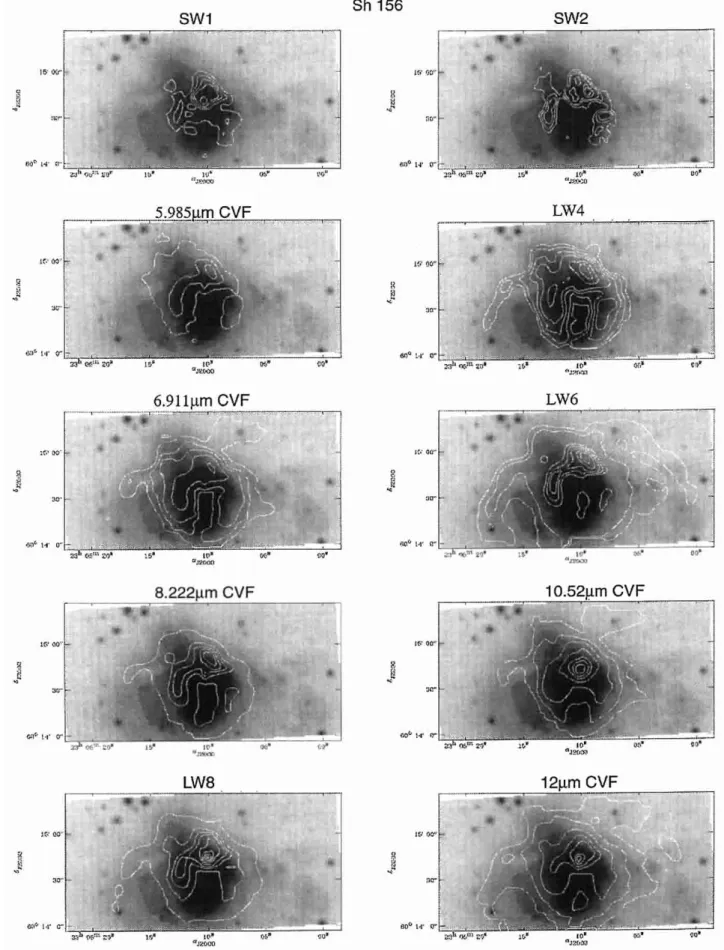
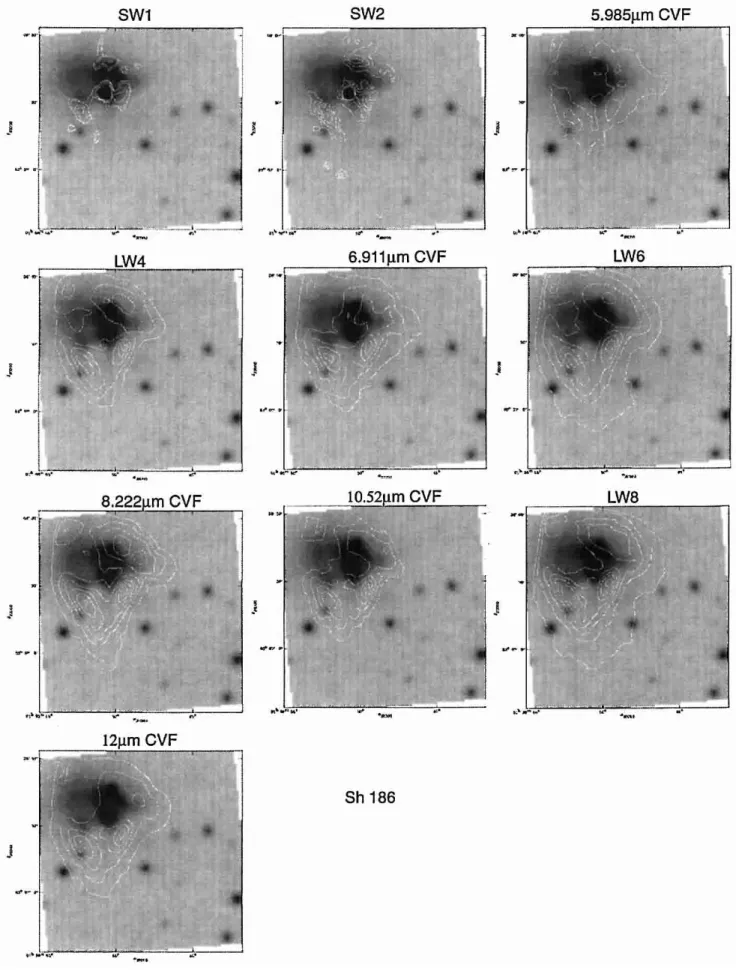
Figure 2 presents, for each source, the distribution of emis-sions observed with ISOCAM. These emisemis-sions are super-imposed (contours) on the R-band images. Tables 2 and 3 give the range of levels in Fig. 2 for the filters and for the CVF, respectively. We see in Fig. 2 that 3–12 µm emission
Table 3. Range of levels in Fig. 2 (in mJy/pixel) for the CVF Source CVF central wavelength in µm
5.985 6.911 8.222 10.520 12.000 Levels in mJy/pixel Sh 61 20–89 35–221 90–398 50–836 60–670 Sh 138 30–222 30–276 50–403 40–309 40–475 Sh 152 18–47 30–170 30–217 30–116 40–245 Sh 156 20–220 25–230∗ 50–370 20–661∗ 30–780∗ Sh 186 13–32∗ 8–47 15–70 10–31 15–72
∗Not regularly spaced levels.
is present in the five sources. The brightest emissions are observed towards Sh 61 and Sh 156 whereas Sh 186 shows only weak emissions. Sh 138 and Sh 152 show intermediate fluxes, higher for Sh 138. SW1 and SW2 emissions show different morphologies, the latter being enhanced outside the ionized zone where emission from dust dominates. The SW1 emission peaks on the main exciting star, probably dominated by the star’s continuum emission and hydrogen recombination lines. The SW emissions do not extend in regions of higher extinction where longer wavelength emis-sions are observed. This is the case for Sh 138 where longer wavelength emissions are observed towards the molecular cloud, south-east of the main exciting star and for Sh 152 where the northwestern extension is not observed at short wavelengths. A similar result is found in the Galactic com-pact H ii region Sh 88B (Deharveng et al. 2000b) where the 3.3 µm emission (Goetz et al. 2000) is not observed in high extinction zones. In the PAH hypothesis, the maxi-mum temperature reached by a molecule is linked to its size. Small molecules can reach high temperatures and emit preferentially at 3 µm. The weaker UV field inten-sity in high extinction zones leads to a lower temperature of the carriers that emit at longer wavelengths. A higher abundance of larger molecules in high extinction zones may also explain this result. The SW2 emission, when compared to longer wavelength emissions, is observed in lower extinction zones. In these zones, the short and longer wavelength UIB emissions coincide at the ISO spatial res-olution. The emission peak in LW4 and LW6 is observed outside the ionized region, towards the photodissociation region and coincides with zones of strong 2.122 µm H2
emission for Sh 61, Sh 152, Sh 156 and Sh 186, observed by Smutko & Larkin (1999). We discuss the spatial coin-cidence between the 6.2 µm band and zones of strong H2
emission in Sect. 4.2. Except for Sh 61 where the emission is probably seen face-on, the mid-IR emission surrounds the ionized region. Weingartner & Draine (1999) proposed a model of grain dynamics in photodissociation regions where the grains are pushed by the radiation pressure and accumulate in the PDR and their destruction inside the ionized regions, leading to an enhanced dust-to-gas ratio in this zone. The accumulation of band carriers in the PDR could explain the observed shell-shaped mid-IR emission. In Sh 61, Sh 138, and Sh 156 we observed a brightness enhancement of the mid-IR emission at locations where
Fig. 2. ISOCAM 3–12 µm emissions superimposed (white contours) on the R-band images, for the five sources. The range of levels is given in Table 2 for the filters and in Table 3 for the CVF, both in mJy/pixel. North is up, east is left
young stars only detected in the K-band are observed (see the images in Smutko & Larkin). In Sh 138, the south-west extension observed in LW4 and LW6 also corresponds to a very red star observed in K (star 119 in Deharveng et al. 1999). If those young stars are sufficiently hot, their FUV radiation creates a local excitation of the dust, increasing the mid-IR emission. If confirmed, this local dust excita-tion has to be taken into account. The LW8 distribuexcita-tion outside the ionized region is similar to that of the LW4 and LW6. Differences appear in Sh 61 and Sh 156 where the LW8 and the 12 µm emissions peak on the main exciting star. In Sh 152, a similar trend, although less pronounced, is observed in the dense ionized zone (the α component – see Sect. 2.1).
Figure 3 presents the mean value of the flux observed in the eight pixels around the exciting star (i.e. in the ionized region) and near the mid-IR emission peak (i.e. outside the ionized region – the mean flux observed in the eight pixels that surround the emission peak). The mean background level, taken outside these emission zones, is also shown for comparison. The maximum flux uncertainty of 8% (see Sect. 2.2) is shown. The uncertainty on the background fluxes, always smaller than the symbols, is not shown. In Sh 61 and Sh 156 the mid-IR emission is dominated by emission near the star (filled circles in Fig. 3) whereas the emission from dust in the PDR (open squares in Fig. 3) dominates in Sh 138, Sh 152 and Sh 186. In Sh 61 and Sh 156, the strong rising shape of the flux density is similar to the one observed towards highly excited H ii regions. In the ionized zones where no emission from the 6.2 µm band is expected, the levels of the LW4 and 5.985 µm emissions are similar, indicating that we are measuring a continuum. For Sh 61, the difference observed in Fig. 3 between LW4 and 5.985 µm flux levels in the ionized zone suggests that dust emission occurs. A face-on configuration may explain this behaviour.
The 6.9111 µm emission is always above the continuum level (as defined by the 5.985 µm flux) due to the [Ar ii] line. Outside the ionized zones the 6.911 µm measurement can be used to estimate the 7.7 µm band continuum.
The strong 8.222 µm emission observed near the star in Sh 61 and Sh 156 indicates that larger molecules or small grains, that better survive in hard radiation fields, may be responsible in part for this emission. In the other regions, this emission follows well that of the LW4 and LW6 emission, suggesting a common origin.
The 10.52 µm emission peaks towards the main excit-ing star in Sh 61 and Sh 156 (see Fig. 2). This is also seen in Fig. 3 where the 10.52 µm flux is high in the ionized zone (maximum flux level of 840 mJy observed in Sh 61 and of 780 mJy in Sh 156, on the star). In Sh 152, an ex-tension towards component α is observed (see Fig. 2). We used the 10.52 to 5.985 µm ratio as an indicator of a possi-ble contamination by [S iv] emission. In Sh 61 and Sh 156, the maximum value of this ratio ('7) is found around the exciting star, suggesting [S iv] emission. The pres-ence of [S iv] is confirmed by the SWS spectra of Sh 156 (see Fig. 3e in Cox et al. 1999). The possible presence of
[S iv] in Sh 61, incompatible with the spectral type of the main exciting star, remains unclear. For Sh 61 and Sh 152 (component α) we suggest that amorphous silicate grains may be responsible for the observed emission (Cesarsky et al. 2000b). The pre-main sequence nature of AS 310, the exciting star of Sh 61, may explain this emission as a broad silicate emission is observed towards T Tauri stars in the Chamaeleon I dark cloud (see G¨urtler et al. 1999). Extended red emission attributed to nanosized silicon par-ticles is observed towards component α in Sh 152 (Darbon et al. 2000) indicating the presence of these grains. The distribution and flux levels observed in Sh 138, Sh 152 (ex-cept towards the α component) and Sh 186 indicates that little or no [S iv] emission is present. Sh 138 and Sh 152 should indeed only show weak [S iv] emission, because only weak [O iii] 500.7 nm, which requires a similar ionisation potential (35 eV), is observed in these nebulae (Deharveng et al. 2000). In Sh 186, the low excitation prevents such emission. Outside the ionized zones the flux level is low, and this measurement can be used to estimate the 11.2 µm band continuum.
In Sh 138 and Sh 186 the contribution of the long wavelength continuum in the ionized zone is low at 12 µm (also revealed by the low 12 µm to 5.985 µm ratio, around 2 at maximum). The SWS spectrum of Sh 138 (Fig. 1e in Roelfsema et al. 1996) confirms this fact. This means that the contribution of the continuum attributed to very small grains (VSGs) is small at 12 µm. We see in Fig. 2 that, in these two regions, the 12 µm emission follows that of the LW4, LW6 and LW8 emissions quite well, suggest-ing a common origin for the carriers of both emissions. In Sh 61, Sh 152 and Sh 156 the contribution of the VSG continuum is large at 12 µm and peak in highly excited region (see Fig. 2) indicating that VSGs survive in hard radiation fields and dominate the emission.
4. Discussion
4.1. UIB fluxes
In the following we derive the UIB fluxes considering that an underlying continuum is associated with each band (see Sect. 2.3). The 6.2 µm band is well determined (see Sect. 3). In the ionized zone the possible contamination by atomic lines and continuum emission from very small grains prevent a reliable estimate of the continuum un-derlying the 7.7 and 11.2 µm bands. For these two bands a mean value is obtained using a value of the continuum estimated at the band centre position with a linear inter-polation using the two surrounding CVF measurements (see Sect. 3). The given values probably represent a lower limit of the band fluxes as the continuum estimates are upper limits. For each band, the flux is integrated over a (8700)2 area. This area, centred on the main exciting
star, covers the whole emission band. The integrated flux is then multiplied by the filter width (in Hz). The results are given in Table 4. Columns 1 and 2 give the name of
λ (µm)
Flux (mJy/pixel)
Fig. 3. Mean flux observed around the main exciting star (i.e. in the ionized zone; filled circles), around the mid-IR emission peak (i.e. outside the ionized zone; open squares) and on the background (filled triangles). The fluxes are given in mJy/pixel. The thick black lines show the filter widths and the error bars show the flux uncertainty
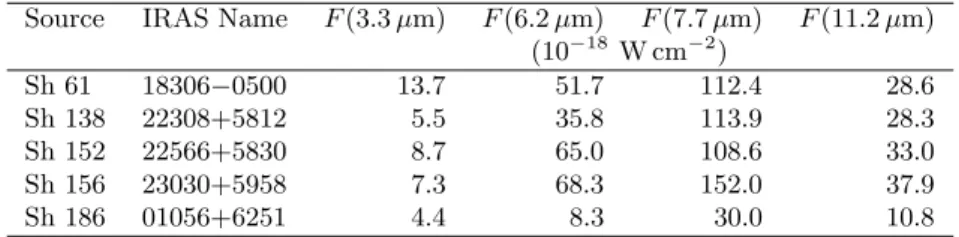
Table 4. Derived UIB fluxes
Source IRAS Name F (3.3 µm) F (6.2 µm) F (7.7 µm) F (11.2 µm)
(10−18 W cm−2) Sh 61 18306−0500 13.7 51.7 112.4 28.6 Sh 138 22308+5812 5.5 35.8 113.9 28.3 Sh 152 22566+5830 8.7 65.0 108.6 33.0 Sh 156 23030+5958 7.3 68.3 152.0 37.9 Sh 186 01056+6251 4.4 8.3 30.0 10.8
the sources. Columns 3 to 6 gives, respectively, the fluxes of the 3.3, 6.2, 7.7 and 11.2 µm bands.
The highest excitation region of our sample, Sh 156, has the highest UIB fluxes, similar to those of Sh 61. Sh 186 has the smallest values in agreement with its low IR luminosity. The correlation observed between the 6.2 and 7.7 µm band intensities in our sample (see also Fig. 18 in Cohen et al. 1989) confirms a common origin for the car-riers. Ground-based data obtained for the 3.3 µm band in Sh 61 (Brooke et al. 1993) give a flux of 13 10−18W cm−2, in very good agreement with our determination. Sh 138 has been observed at 3.3 µm by Jourdain de Muizon et al. (1990b) and these authors also derive the 7.7 and 11.2 µm band fluxes using IRAS data. Their results are, respec-tively for the 3.3, 7.7 and 11.2 µm bands, 4, 130 and 34 10−18W cm−2, in good agreement with our values. The values we obtain for the 11.3 µm band for Sh 138, Sh 156 and Sh 186 also agree well with the results obtained by Zavagno et al. (1992). No comparison can be made for the 7.7 µm band due to different integration band widths.
Using the fluxes given in Table 4, we derive band ra-tios. Their values vary between 0.19 to 0.48 for [3.3]/[11.2], 0.27 to 0.6 for [6.2]/[7.7] and 2.8 to 4 for [7.7]/[11.2]. These values agree with the typical ones found for H ii regions by Cohen et al. (1989), i.e. 0.43 for [3.3]/[11.2], 0.58 for [6.2]/[7.7] and 3.3 for [7.7]/[11.2]. No correlation has been found between the ratio and the excitation conditions. This is also the case for the sample studied by Roelfsema et al. (1996). For Sh 138 their value of the [6.2]/[7.7] ratio agrees well with ours. The higher values they derived for the [7.7]/[11.2] and [3.3]/[11.2] ratio come from different integration band widths (see Lu 1998), especially a nar-rower integration band for the 11.2 µm feature. This again emphasizes the importance of comparing results obtained by similar methods (see Sect. 2.3).
4.2. Properties of the 6.2 µm band
In order to look at the relation between the 6.2 µm band flux and the excitation conditions we derive a 6.2 µm band luminosity, scaled to a common distance, arbitrarily cho-sen to 2.5 kpc, the distance of Sh 61. The derived values are 69 L for Sh 186, 100 L for Sh 61, 523 L for Sh 152, 1045 L for Sh 138 and 3740 L for Sh 156 and show that the 6.2 µm band correlates well with the intensity of the FUV field, suggesting a FUV excitation. A PDR
model is needed to estimate accurately the FUV field in-tensity at a given distance from the star. Nevertheless we derived the FUV field intensity taking the value of LFUV
in Table 1 and considering that the decrease of the FUV field with distance from the star is only due to geomet-rical dilution, with an r−2 law (see Uchida et al. 2000). This crude estimate of the FUV field, at the distance where the 6.2 µm band peaks, gives a value of 104 G
0.
This value agrees with the ones generally used in dense PDR models (Burton et al. 1990, see also Hollenbach & Tielens 1997). A similar value of the FUV field intensity is found for Sh 156 and Sh 186 at the 6.2 µm band peak. This suggests that similar excitation conditions prevail in these PDRs. The main observed change is the distance between the exciting star and the 6.2 µm band peak. This distance increases with the spectral type of the star in our sample rendering possible similar excitation condition in the PDR, regardless the spectral type of the central excit-ing star. The 6.2 µm band distribution peaks in the PDR and this zone’s position corresponds to similar excitation conditions. Figure 4 presents the 6.2 µm band distribution superimposed on the H2/Brγ images obtained and kindly
provided by Smutko & Larkin (1999) for Sh 61, Sh 152, Sh 156 and Sh 186. We only considered the 6.2 µm band (see Sect. 3) but the same result is found for the other bands as their distributions coincide. The zones of strong 2.122 µm H2emission are represented as the black zones in
Fig. 4 (see Sects. 3.2 and 4.1 in Smutko & Larkin for expla-nations). We see that the 6.2 µm band distribution coin-cides with zones of strong 2.122 µm H2emission, whatever
the spectral type of the exciting star. This reinforces the finding of similar excitation conditions in these PDRs. The 6.2 µm emission seems to be slightly closer to the star then the H2emission. This is also observed in Orion (see Fig. 9
in Cesarsky et al. 2000) and can be interpreted as the sur-vival of the carriers in the H i zone. Tran (1998) has shown that the intensity of the UIBs in NGC 7023 is strongly cor-related with the H i gas density. In Sh 61 the bright H2
emission zone is found in the northern part of the opti-cal region where 6.2 µm emission is also found. In Sh 152 bright H2 emission surrounds the south part of the
opti-cal region with a small extension to the south-east. This small extension also corresponds to fainter 6.2 µm emis-sion. Larger scale LW6 emission (Copet & Zavagno 1999) also follows perfectly the 2.12 µm H2emission (Porras,
Sh 61 Sh 152
Sh 156 Sh 186
Fig. 4. 6.2 µm band (contours) superimposed on the H2/Brγ image obtained by Smutko & Larkin for Sh 61, Sh 152, Sh 156
and Sh 186. The black zones are zones of strong H2 emission (in arbitrary units; see Sects. 3.2 and 4.1 in Smutko & Larkin).
Contour levels for the 6.2 µm band are: for Sh 61: 10–107 mJy/pix, for Sh 152: 4–59 mJy/pix, for Sh 156: 4–86 mJy/pix and for Sh 186: 4–16 mJy/pix
to the east and corresponds to fainter 6.2 µm emission (see also Fig. 2). The 6.2 µm band also surrounds the ionized region in Sh 186 and corresponds well to zone of strong H2
emission. The good correlation between the 6.2 µm band and the H2strong emitting zones indicates that the 6.2 µm
band carriers are concentrated in this part of the photodis-sociation region. The same result has been found in the Rho Ophiuchi region where the H2and UIB emissions
co-incide (Habart et al. 2000) and in molecular clumps near the Keyhole Nebula where 3.3 µm and 2.12 µm H2
emis-sion exactly coincide (Brooks et al. 2000). The correlation between both emissions observed in the Rho Ophiuchi
region, located at 135 pc, indicates that the coincidence is not due to a lack of spatial resolution of our ISOCAM data. The spatial coincidence of the 6.2 µm band and the 2.12 µm H2 emission due to fluorescence suggests that H2
and UIB carriers are both excited by UV radiation. The distribution of the 6.2 µm band suggests that the dust has been swept-up outside the ionized region and concentrates in the PDR. The LW4 emission contrast between the emis-sion peak and the ionized zone is nearly the same in the five regions. Despite a small dynamic range of excitation conditions, this result suggests that the carriers are not
more destroyed in the ionized zone of Sh 156 than in that of Sh 186.
5. Conclusions
We obtained the distribution of the 3–12 µm emission in five Galactic compact H ii regions using ISOCAM. The main results can be summarized as follow:
– In the five regions, mid-IR emission is present.
Considering that a continuum or broad wings are as-sociated with the UIBs, only the 6.2 µm emission band can be reliably derived using the 5.985 µm CVF as a reference. We also obtain lower limits for the distribu-tion and flux of the 3.3, 7.7 and 11.3 µm bands. UIB fluxes agree with previous results obtained by Brooke et al. (1993) and Jourdain de Muizon et al. (1990b). The UIB ratios also agree with those previously found for H ii regions by Cohen et al. (1989). Comparisons with other results show that caution has to be taken when comparing UIB fluxes obtained using different fitting methods and/or integration band widths;
– At the ISOCAM angular resolution, the 6.2, 7.7 and
11.3 µm band emissions are observed in the same zones, indicating a common origin for the carriers. The 3.3 µm band is not observed in high extinction zones suggest-ing a lower temperature of the carriers and/or a higher abundance of larger molecules in those zones;
– A crude estimate of the far UV field intensity at the
location of the 6.2 µm band peak suggests that similar excitation conditions prevail in the five PDRs;
– The 6.2 µm emission peaks in the photodissociation
re-gion. A good correlation between the 2.122 µm H2and
6.2 µm emission zones is observed. This suggests that UV excitation occurs for both emissions. The correla-tion between the 6.2 µm band luminosity and the FUV intensity reinforces this idea. The 6.2 µm emission is slightly closer to the star then the H2 emission, as
ob-served in Orion, indicating that the carriers survive in the H i zone;
– The 12 µm emission shows that the contribution of
continuum emission from very small grains is impor-tant in high excitation regions and peaks on the ex-citing star. The similar emission distributions suggest that 12 µm and UIB carriers may be linked.
Acknowledgements. J.-P. Baluteau, J. Caplan, S. Darbon, L.
Deharveng, C. Morisset, J.-P. Sivan and J.-M. Perrin are greatly thanked for many fruitful discussions. J. Larkin is deeply thanked for his permission to use the data published in Smutko & Larkin as well as M. Birkinshaw for the radio map of Sh 156. The people in charge of the ISOCAM data centre in Saclay are also thanked for their help regarding the data reduction. D. Rouan is thanked for his help in using the CAM-SW stabilisation programme. J. Lequeux is thanked for comments that help to improve the paper. This work benefited from the financial support of the GdR PCMI. This research has made used of the Simbad astronomical database operated in Strasbourg, France.
References
Ageorges, N., Eckart, A., Monin, J.-L., & M´enard, F. 1997, A&A, 326, 632
Allamandola, L. J., Tielens, A. G. M. M., & Barker, J. R. 1985, ApJ, 290, L25
Allamandola, L. J., Tielens, A. G. M. M., & Barker, J. R. 1989, ApJS, 71, 733
Birkinshaw, M. 1978, MNRAS, 182, 401
Borghesi, A., Bussoletti, E., & Colangeli, L. 1987, ApJ, 314, 422
Boulanger, F., Boissel, P., Cesarsky, D., & Ryter, C. 1998, A&A, 339, 194
Boulanger, F., Abergel, A., Cesarsky, D., et al. 2000, ESA-SP, 455, 91
Brooke, T. Y., Tokunaga, A. T., & Strom, S. E. 1993, AJ, 106, 656
Brooks, K. J., Burton, M. G., Rathborne, J. M., Ashley, M. C. B., & Storey, J. W. V. 2000, MNRAS, 319, 95 Burton, M. G., Hollenbach, D. J., & Tielens, A. G. G. M. 1990,
ApJ, 365, 620
Cesarsky, C. J., Abergel, A., Agn`ese, P., et al. 1996a, A&A, 315, L32
Cesarsky, D., Lequeux, J., Abergel, A., et al. 1996b, A&A, 315, L309
Cesarsky, D., Lequeux, J., Ryter, C., & Gerin, M. 2000, A&A, 354, L87
Cesarsky, D., Jones, A., Lequeux, J., & Verstraete, L. 2000b, A&A, 358, 708
Cohen, M., & Kuhi, L. V. 1979, ApJS, 41, 743
Cohen, M., Tielens, A. G. G. M, Bregman, J., et al. 1989, ApJ, 341, 246
Copet, E., & Zavagno, A. 1999, ESA-SP, 427, 659 Coulais, A., & Abergel, A. 1999, ESA-SP, 427, 61
Cox, P., Deharveng, L., & Caplan, J. 1987, A&A, 171, 277 Cox, P., Roelfsema, P. R., Baluteau, J.-P., et al. ESA-SP, 427,
631
Crampton, D., Georgelin, Y. M., & Georgelin, Y. P. 1978, A&A, 66, 1
Darbon, S., Zavagno, A., Savine, C., et al. 2001, A&A, 364, 723
Deharveng, L., Zavagno, A., Nadeau, D., Caplan, J., & Petit, M. 1999, A&A, 344, 108
Deharveng, L., Pe˜na, M., Caplan, J., & Costero, R. 2000, MNRAS, 311, 329
Deharveng, L., Nadeau, D., Zavagno, A., & Caplan, J. 2000b, A&A, 360, 1107
D´esert, F. X., Boulanger, F., & Puget, J.-L. 1990, A&A, 237, 215
Duley, W. W., & Williams, D. A. 1981, MNRAS, 196, 269 Felli, M., & Harten, R. H. 1981, A&A, 100, 42
Georgelin, Y. P., & Georgelin, Y. M. 1970, A&A, 6, 349 Georgelin, Y. M. 1975, Th`ese d’ ´Etat, Universit´e de Provence,
Aix-Marseille I
Goetz, J., Howard, E., Pipher, J., & Forrest, W. J. 2000, ApJ, in press
G¨urtler, J., Schreyer, K., Henning, Th., Lemke, D., & Pfau, W. 1999, A&A, 346, 205
Habart, E., Boulanger, F., Verstraete, L., et al. 2000, ESA-SP, 456, in press
Habing, A. 1968, Bull. Astr. Inst. Netherlands, 19, 421 Henning, T., Launhardt, R., Steinacker, J., & Thamm, E. 1994,
Heydari-Malayeri, M., Testor, G., & Lortet, M. C. 1980, A&A, 84, 154
Heydari-Malayeri, M., & Testor, G. 1981, A&A, 96, 219 Hollenbach, D., & Tielens, X. 1997, ARA&A, 35, 179 Hunter, D. 1992, ApJS, 79, 469
Jourdain de Muizon, M., Cox, P., & Lequeux, J. 1990a, A&AS, 83, 337
Jourdain de Muizon, M., d’Hendecourt, L. B., & Geballe, T. 1990b, A&A, 227, 526
Johansson, L. E. B., Olofsson, H., Hjalmarson, A., Gredel, R., & Black, J. H. 1994, A&A, 291, 89
L´eger, A., & Puget, J.-L., 1984, A&A, 137, L5 Lu, N. Y. 1998, ApJ, 498, L65
Monet, D., Bird, A., Canzian, B., et al. 1998, UNSO-A V2.0, UNSO-A Catalogue of UNSO-Astrometric Standards, U.S. Naval Observatory Flagstaff Station (USNOFS) and Universities Space Research Association (USRA) stationed at USNOFS.
Onaka, T., Mizutani, M., Chan, K.-W., et al. 2000, ESA-SP, 456, in press
Ott, S., Abergel, A., Altieri, B., Augueres, J-L., Aussel, H., et al. 1997, ASP Conf. Ser., 125, 34
Pagani, L., Lequeux, J., Cesarsky, D., et al. 1999, A&A, 351, 447
Papoular, R., Conard, J., Guiliano, M., Kister, J., & Mille, G. 1989, A&A, 217, 204
Roelfsema, P. R., Cox, P., Tielens, A. G. G. M, et al. 1996, A&A, 315, L289
Roelfsema, P. R., Cox, P., Kessler, M., & Baluteau, J.-P. 1998, ASP Conf. Ser., 132, 76
Sakata, A., Wada, S., Tanabe, T., & Onaka, T. 1984, ApJ, 287, L51
Schaerer, D., & de Koter, A. 1997, A&A, 322, 598 Sharpless, S. 1959, ApJS, 4, 257
Smutko, M. F., & Larkin, J. E. 1999, AJ, 117, 2448
Stark, J.-L., Abergel, A., Aussel, H., et al. 1999, A&AS, 134, 135
Testi, L., Palla, F., & Natta, A. 1998, A&AS, 113, 81
Tiph`ene, D., Rouan, D., Epstein, G., & Le Coupanec, P. 2000, Exper. Astr., 10, 347
Tran, Q. D. 1998, Th`ese, Universit´e Paris XI
Uchida, K. I., Sellgren, K., & Werner, M. 1998, ApJ, 493, L109 Uchida, K. I., Sellgren, K., Werner, M., & Houdashelt, M. L.
2000, ApJ, 530, 817
Verstraete, L., Puget, J.-L., Falgarone, E., et al. 1996, A&A, 315, L337
Weingartner, J. C., & Draine, B. T. 1999, ESA-SP 427, 783 Zavagno, A., Cox, P., & Baluteau, J.-P. 1992, A&A, 259, 241