HAL Id: hal-02149480
https://hal.archives-ouvertes.fr/hal-02149480
Submitted on 30 Nov 2020HAL is a multi-disciplinary open access archive for the deposit and dissemination of sci-entific research documents, whether they are pub-lished or not. The documents may come from teaching and research institutions in France or abroad, or from public or private research centers.
L’archive ouverte pluridisciplinaire HAL, est destinée au dépôt et à la diffusion de documents scientifiques de niveau recherche, publiés ou non, émanant des établissements d’enseignement et de recherche français ou étrangers, des laboratoires publics ou privés.
phase of a non thermal plasma at atmospheric pressure
Raluca Nastase, Jean-Michel Tatibouet, Elodie Fourré
To cite this version:
Raluca Nastase, Jean-Michel Tatibouet, Elodie Fourré. Depolymerization of inulin in the highly reactive gas phase of a non thermal plasma at atmospheric pressure. Plasma Processes and Polymers, Wiley-VCH Verlag, 2018, 15 (10), pp.1800067. �10.1002/ppap.201800067�. �hal-02149480�
Full paper
Depolymerization of inulin in the highly reactive gas phase of a non thermal
plasma at atmospheric pressure
Raluca Nastase, Jean-Michel Tatibouët, Elodie Fourré* –––––––––
Université de Poitiers/CNRS, Institut de Chimie des Milieux et Matériaux de Poitiers, ENSIP, 1 rue Marcel Doré, TSA 41105, 86073 Poitiers Cedex 9, FRANCE.
E-mail:elodie.fourre@univ-poitiers.fr –––––––––
The interest of fructose production arises from its sweetening character used in application such as food and pharmaceutic industries. Fructose formation is achieved by the short treatment of inulin by non thermal plasma at atmospheric pressure, under air, using a dielectric barrier discharge (DBD) configuration. Promising results were observed as a total conversion of inulin was achieved within 10 mins of treatment (18 kV, 2 kHz), without the addition of solvent, nor catalyst and at room temperature. Additionally to fructose (32 %), fructooligosaccharides of higher degrees of polymerization were produced. The mechanism underlying the depolymerization process appears to start with the oxidation of inulin followed by the cleavage of the -glycosidic bond and eventually ring opening of the monomer.
1
Introduction
Within the variety of existing biopolymers, inulin represents a renewable and abundant raw material, valuable for different application domains such as food industry, biofuel production and pharmaceutics.[1,2] Inulin acetylation leads to carbohydrate esters used in the textile, plastic industries and in pharmaceutics as drug carriers.[3-5] Inulin is a polymeric chain of (1-2) fructosyl fructose units ended by a glucose monomer with a polymerization degree (DP) up
and yacon. Inulin is particularly used for the production of fructose and fructose syrup [[1], 2, 6-[8]] which is a very valuable substitute to sucrose due to its high sweetening property.[[8]]
Currently, the main fructose production process relies on starch enzymatic hydrolysis which requires the use of amylase, amyloglucosidase and glucose isomerase to form glucose, fructose (45%) and oligosaccharides. The procedure is rather complex and costly, especially the fructose extraction step from the resulting fructose syrup. An alternative procedure which involves the direct enzymatic hydrolysis of inulin, via the action of inulinase, [[9], [11]] is an efficient way to produce fructose (95% yield). We have recently reported that the treatment of cellulose by dielectric barrier discharge (DBD) plasma improved its reactivity towards
hydrolysis.[12]
Non thermal atmospheric plasma (NTAP) is now recognized as an unconventional media proposing an alternative solution for gas, chemicals or matter activation. NTAP can be found in a diversity of industrial applications such as surface functionalization, etching or thin film deposition, biomedical applications, in vivo treatment, volatile organic compound elimination and more recently biopolymer deconstruction.[13-15] One of the reasons of its popularity comes from its ability to generate valuable compounds with low environmental impact while being flexible and energy efficient. NTAP can be generated from diverse electrical sources and adopt various forms depending on the reactor geometry and electrical signal used (DC, AC or pulsed voltage). They are categorized in sections such as corona discharges, dielectric barrier discharges (DBD), gliding arc discharges, plasma needle, plasma jets and micro hollow cathode discharges. Within this variety of non thermal plasma discharges, DBD plasmas have the advantages to be easily generated in various reactor geometries without the risk of electric arc formation since at least one electrode is isolated by a dielectric material. The high voltage applied between electrodes generates an intense electric field which leads to the formation of highly energetic electrons able to induce excited species in the gas phase from non-elastic collisions between electrons and molecules of the gas phase. The energy of electrons is then
directly transferred to gas phase species without heating of the rest of the gas phase. These excited species can react with other molecules of the gas phase and/or with a material to induce reactions only feasible at high temperature while the main temperature remains low. Following our previous work on cellulose deconstruction [12, 16] we have studied the use of non-thermal plasma at atmospheric pressure to transform inulin biopolymer into fructose, glucose and fructo-oligosaccharides with low degrees of polymerization (DP).
2
Experimental Section
2.1 DBD plasma reactor and DBD plasma reactor and pulsed high voltage generator
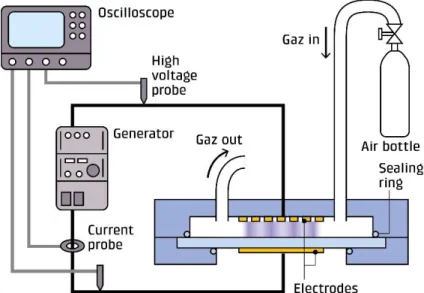
The DBD plasma reactor is represented schematically in Figure 1. A dielectric barrier
discharge plasma was generated between two copper electrodes separated from each other by two dielectrics. One electrode was a copper film of size 50 mm x 50 mm (Advanced Tape) fixed on a quartz dielectric plate (2 mm thick). The other electrode was a copper grid (50 mm x 50 mm x 1 mm) covered by a thin glass plate (1 mm thick) used to avoid the direct contact of the grid with the polymer. The gap between the two dielectrics was 1mm. The reactor case was airtight, allowing the control of the gas flow and its chemical composition.
Figure 1: Experimental set-up.
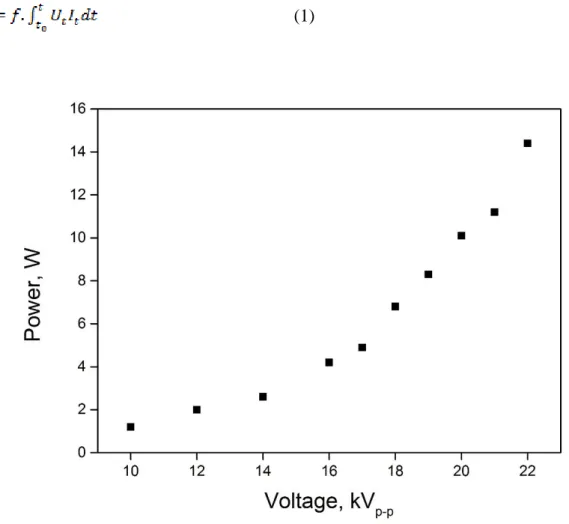
repetition frequency between 1 and 4 kHz. The electrical parameters were measured via two high voltage probes (Lecroy, PPE20KV-CC) and one current probe (Stangenes Industry 60 MHz) connected to a Lecroy WaveSurfer oscilloscope (64Xs-A, 600 MHz). The power (in W) was calculated from the time integration of discharge voltage and current following (1), with f the frequency (in Hz), Ut the voltage and It the current value as a function of time
(Figure 2).
(1)
Figure 2: Input power as a function of applied voltage at constant frequency of 2 kHz and under air flow at 50 mL min-1.
2.2 Material and conditions
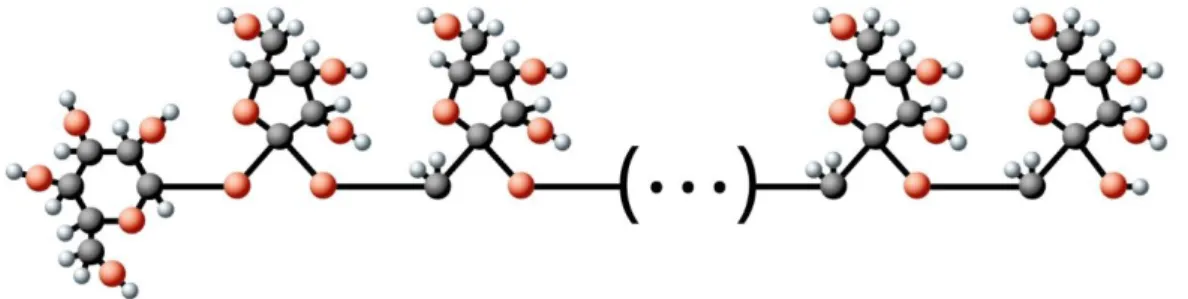
The material tested consisted of inulin (Figure 3) from chicory (procured from
Sigma-Aldrich). The experiments were carried out using 50 mg of inulin powder placed on the quartz dielectric plate in the center of the plasma reactor. The system was kept at atmospheric
pressure under dry air flow (50 mL min-1) at room temperature (without heating of the reactor). In order to determine the optimal parameters for inulin conversion and fructose yields, the electrical parameters (frequency, 1-2.5 kHz and voltage, 16-21 kV) and the treatment time (1-32 mins) were modified. Gas chemical composition was also studied in order to identify the species responsible for the inulin depolymerization and the underlying pathways of the reaction. The effects of these parameters were evaluated in terms of inulin conversion, products formation (especially fructose) and their relative amount according to the surface area of the size exclusion chromatography (SEC) peaks.
Figure 3: schematic representation of inulin polymer.
2.3 Characterization
Following the plasma treatment, the samples were dissolved in water and further analyzed by SEC, using a HPLC Shimadzu LC-20AT pump, a Sugar KS-802 column (8 mm ID * 300 mm Length) and a Shimadzu RID- 10A detector, using ultra-pure water as mobile phase (1 mL min-1). All the samples were prepared following the same procedure prior to their analysis consisting in dissolving 0.8 mg of inulin in 1 ml of ultra-pure water. The yields of fructose were calculated from the calibration curve of fructose and fructose peak areas after plasma. The other results are indicated in terms of area distribution (AD in %) calculated as it follows
(2)
Where AC is the peak measured area for each compound and ATthe total area of detected compounds. Trends of compounds formation or conversion are comparable but, due to the lack of response coefficient of most of the reaction products, it is not possible to give a quantitative analysis of results.
The distribution of the DP (degrees of polymerization) present in the samples succeeding plasma treatment were determined by MALDI-TOF (Matrix Assisted Laser Desorption Ionization-Time Of Flight) recorded on a Bruker AutoFlex III apparatus after dilution of the samples in a matrix of 2,5-dihydroxybenzoic acid (DHB) prior to analysis. The irradiation of the crystalline mixture gives rise to the desorption of ions characteristic of the sample which are then analysed by mass spectrometry according to their mass-to-charge ratio, m/z. Routine Infrared spectra were collected for the solid samples before and after plasma treatment on a Perkin Elmer FT-IR (Spectrum One) operating at wavenumber in the range 4000-650 cm-1. The spectra after normalization allowed us to monitor possible
functionalization and/or stabilization of species on the surface of the sample.
3
Results and Discussion
3.1 Optimization of process parameters
The effects of the input voltage, frequency, treatment time, temperature in the reactor and gas chemical nature of the plasma were studied.
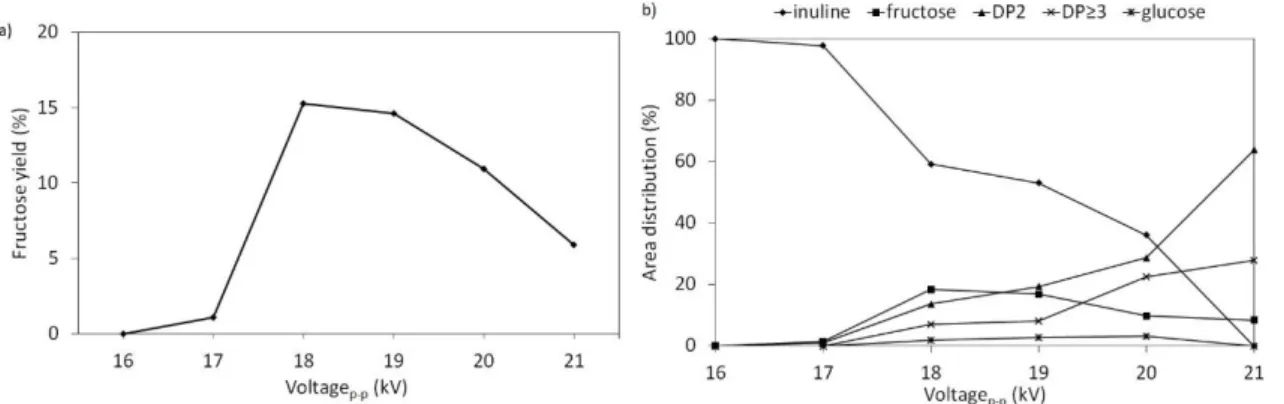
Regarding the voltage influence (Figure 4) and for a treatment time of 5 min, a minimum voltage (17 kV) was required to initiate the conversion of inulin. As the voltage increased, inulin was converted into fructose, DP2 and DP3 compounds, with a small amount of glucose. Fructose content reached a maximum (≈15 %) between 18 and 19 kV, while glucose and compounds of DP≥2 increased with increasing voltage. Additionally, the powder was
colourless up to 19 kV and turned light yellow over 20 kV, suggesting a partial degradation of fructose and glucose.
Figure 4: a) fructose yield and b) area distribution of inulin conversion and reaction products as a function of the signal voltage at constant frequency (2000 Hz), time (5 min) and gas flow rate (50 ml min-1 air).
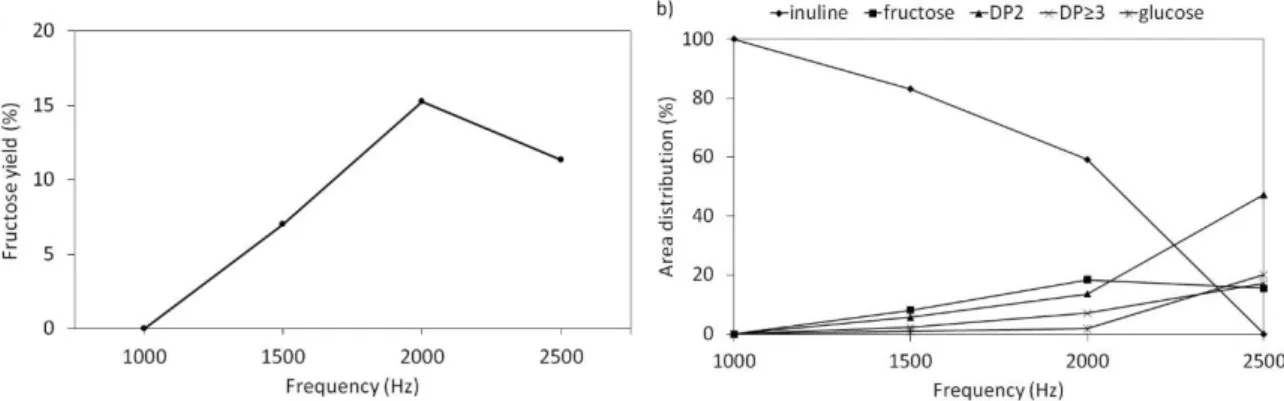
At a fixed voltage of 18 kV, the frequency rise led to similar results as those obtained by increasing voltage: inulin was deconstructed into fructose, glucose and low DP compounds (Figure 5b).
From the comparison of area distributions, a slight reaction occurs at 1000 Hz and only a small amount of fructose (0.3% yield) is detected (Figure 5b). Fructose peak area reached a maximum formation at 2000 Hz which corresponds to a yield of 15 % (Figure 5a). Higher frequency (2500 Hz) leads to a complete inulin conversion and a decrease of fructose yield whereas glucose and DP≥2 products continue to increase. The effect of the signal frequency follows a similar trend to the input voltage and is consistent with an effect due to the increase of input power. For the higher input power (P>14W) fructose was not detected while the inulin powder turned to mild brown indicating a possible degradation of inulin and small oligosaccharides to coke and levulinic acid or furanic derivatives[17]. An increase of the temperature (up to 100°C) of the reactor was observed at voltages over 19 kV and 2.5 kHz.
Figure 5: a) fructose yield and b) Area distribution of inulin and reaction products as a function of the signal frequency at constant voltage (18 kV), time (5 mins) and gas flow rate (50 ml min-1 dry air).
At a constant input power (18 kV, 2 kHz) the inulin transformation as a function of time has shown that the maximum fructose yield was obtained after 9 minutes of reaction and is consistent with the total conversion of inulin (Figure 6). Simultaneously with the fructose formation, DP2, DP3 compounds and glucose were observed.
Figure 6: a) fructose yield and b) area distribution of inulin and reaction products as a function of the reaction time at constant frequency (2000 Hz), voltage (18 kV) and gas flow rate (50 ml.min-1 air).
From 9 min, DP2 peak area includes the glucose peak area since the two peaks overlapped on the chromatogram.
An increase of the temperature (up to 70°C at 18 kV and 2 kHz) of the reactor was also observed as a function of the plasma treatment time. To determine the role of the temperature
in the depolymerization process, the reactor was kept at 35°C by cooling the air flow circulating through the reactor.
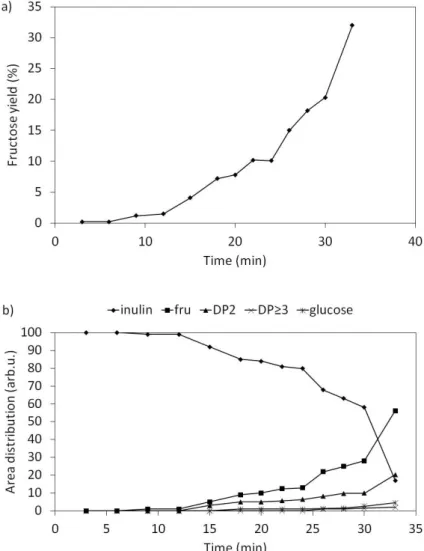
Inulin conversion was followed as a function of time (Figure 7) in standard conditions (18 kV, 2 kHz, 50 ml min-1).
Figure 7: a) fructose yield and b) area distribution of inulin and reaction products as a function of the reaction time at constant frequency (2000Hz), voltage (18kV), temperature (35°C-45°C) and gas flow rate (50ml min-1 air).
The same trend as for experiments without temperature control was observed but with a slower conversion rate. The total inulin transformation was achieved for reaction time higher than 32 min instead of 9 min and with a higher fructose yield (32% instead of 21%). This
behavior strongly suggests that the reaction is not directly induced by the impact of energetic electrons generated by the plasma. It would proceed through excited species generated from the electronic collisions with the gas phase molecules (in addition to a minimum temperature gradient).
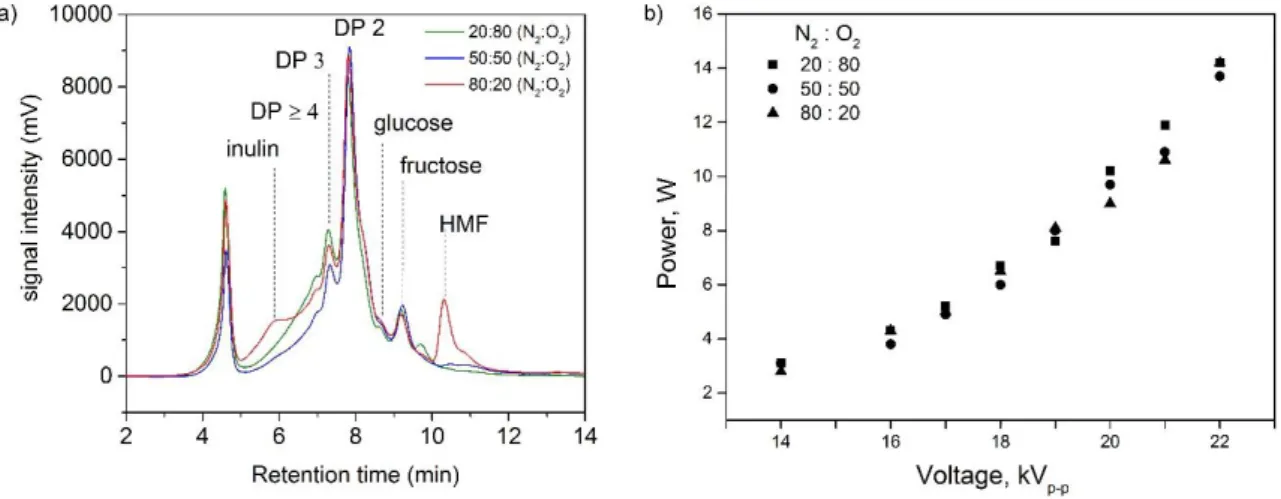
In order to bring further understanding of the depolymerization process by plasma, the effect of gas composition was studied by varying the N2/O2 ratio in standard conditions (19 kV, 2 kHz, 7 mins of plasma treatment).
Figure 8: a) Size Exclusion Chromatograph of plasma treated inulin samples for different nitrogen: oxygen ratios (19 kV, 2 kHz and 7 min treatment time). b) Power as a function of input voltage and N2 : O2 ratio at 2 kHz.
As shown in Figure 8a, the increase of the oxygen content led to a more efficient
depolymerization. When the voltage was kept constant at 19 kV, the ratio of gases influenced only slightly the deposited power (Figure 8b) and the trends of the inulin samples
chromatograms remained similar, with nearly or total deconstruction of inulin and the formation of fructose, glucose and fructooligosaccharides of DP ≥ 2. At the lowest oxygen content in the gas phase (20 %), inulin was partially deconstructed and a fraction of fructose was also degraded into HMF. At the two other ratios, 50 % and 80 % O2, depolymerization of inulin was complete without HMF formation.
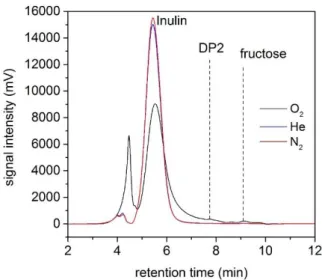
Figure 9: Size Exclusion Chromatograph of plasma treated inulin samples under pure gases N2, O2 and He (19 kV, 2 kHz and 20 min treatment time).
In pure gases like helium or nitrogen, no reaction occurs (Figure 9), although a nitrate concentration below 25 mg dm-3 was measured in case of pure N2 plasma. An imperceptible depolymerization into fructose and DP2 is obtained in pure oxygen. No pH modification was observed in all cases. .
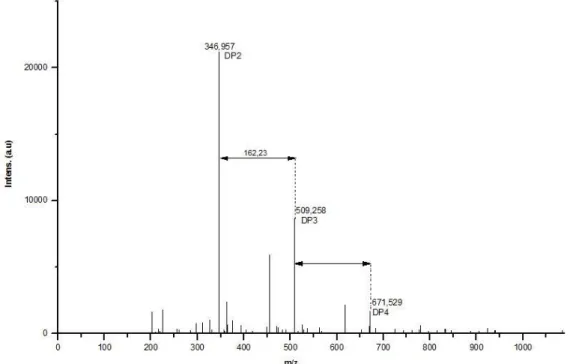
The infrared spectra showed no changes in the inulin structure under pure helium or nitrogen. Only a slight oxidation band at 1730 cm-1 was observed under pure oxygen (Figure10). In addition to HLPC analysis, MALDI-TOF spectrum (Figure 11) confirmed that
depolymerization of inulin led to the formation of DP2, DP3 and DP4 molecules. It is not possible to identify whether the DP2 molecule is inulobiose or sucrose, nor if the DP3 are composed exclusively of 3 fructose units or 1 glucose and 2 fructose units (also valid for higher DPs molecules).
Figure 11: MALDI-TOF analysis of the plasma treated inulin sample at 19 kV, 2 kHz and 7 minutes under 50 % N2 / 50 % O2 gas.
The pH measurement after dissolution of the treated samples (N2/O2 plasma) in water shows a decrease of the pH from 6 to 3.5 by increasing the treatment time from 1 to 7 minutes which remains constant for higher treatment time. This behavior could be due to the formation of nitric acid from reaction of nitrous oxides (formed in air by the plasma) and water [18] or by the formation of carboxylic acids from inulin or oxidation products.
Table 1:NO3- concentration as a function of gas ratio at a voltage of 19 kV, frequency of 2 kHz and flow rate of 50 ml dm-3.
N2 : O2 ratio NO3- concentration (x, mg dm-3) 80 : 20 x > 500 50 : 50 250 < x < 500 20 : 80 50 < x < 100
The hypothesis of inulin depolymerization by nitric acid was suggested. Moreover, the presence of HMF under high nitrogen concentration showed that fructose dehydration to HMF could be related to the presence of high concentration of nitric acid (Table 1).
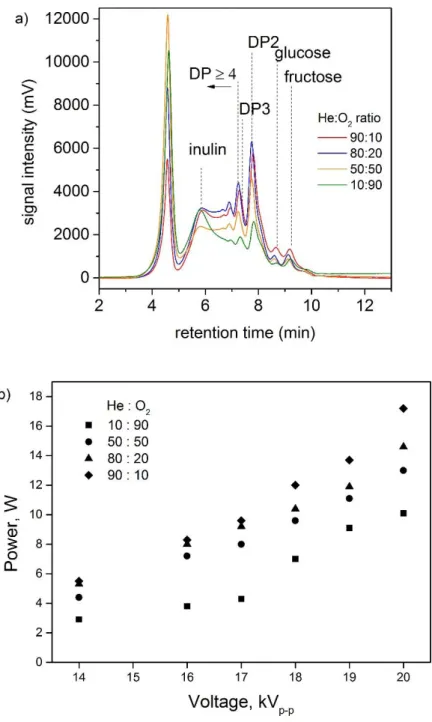
In order to verify this hypothesis, a series of experiments was performed using a He/O2 gas mixture in the same experimental conditions. Results are shown in Figure 12 and similarities with N2/O2 gas mixtures experiments are observed in terms of inulin depolymerization into fructose and small fructooligosaccharides. DP2 formation depends on the He ratio in the gas phase, 80 and 90 %, which also corresponds to the highest powers. As the helium content (and thus power) decreases, DP2 band area decreases. Additionally, inulin depolymerization is not complete under helium/oxygen. The pH measurements of the samples treated by plasma under He/O2 gas mixture present the same variation than with N2/O2 gas mixture. HPLC revealed also the presence of formic acid as inulin degradation product over 7 min treatment. In addition to formic acid, carboxylic acid molecules derived from inulin oxidation could be responsible of the pH decrease.
Figure 12: a) Size Exclusion Chromatograph of plasma treated inulin samples under various He/O2 ratios (19 kV, 2 kHz and 20 min treatment time). b) Power as a function of input voltage at 2 kHz and He : O2 ratio.
From all these observations, oxygen activation by N2 or He excited species appears to be necessary to trigger the depolymerization. The formation of oxygen active species such as
radicals OH or metastable O2-, O* depends on the oxygen/helium or oxygen/nitrogen ratio. It is known in the literature as penning effect: oxygen acts as a quenching gas and helium or nitrogen transfer their energy via collisions to ionize oxygen [19-21]. The formation of nitric acid under N2 / O2 plasma discharge would not only explain the complete conversion of inulin (which remains incomplete under He / O2) but also the degradation into HMF under high nitrogen content (80 %N2 / 20 %O2). The increase of temperature, from excited species relaxation, would also take part in the depolymerization process as it forms an energy reservoir [22] altering the plasma discharge.
It is suggested here that the concentration of active oxygenated species generated from the plasma discharge, such as oxygen radicals or metastable oxygen, increases with the oxygen content in the gas phase. Based on previous studies [23] the depolymerization was achieved by reaction with active oxygen (ROS) /nitrogen (RNS) species. The slight increase of the
reactor’s temperature would lead to the release of water molecules from highly hygroscopic
inulin and would enhance the formation of H2O2 [23, 24].
From H2O2, OH and oxygen radicals would be formed following [25]:
According to different authors [25, 26], the high reactivity of OH radicals and singlet oxygen is responsible of the depolymerization process. OH can abstract hydrogen atoms from every C-H positions on the fructose ring, resulting in carbon radicals which will lead to the breakdown of the β-glycosidic bonds between the fructose units. Additionally, it was suggested that carboxylic acids of polysaccharides act as active catalyst center for the depolymerization process [27].
3.2 Ex situ infrared investigation of air plasma treated inulin
The IR spectra of raw inulin is shown in Figure 13. It shows well defined and narrow peaks that are arising from the ordered structure of inulin, mainly composed of monomeric units of fructose. The main bands 27-30 are referred in Table 2.
Figure 13: FT- IR spectra of the inulin sample from 1 to 12 minutes of plasma treatment under air at atmospheric pressure (19 kV, 2 kHz).
The broad band (maximum at 3341 cm-1) is related to OH stretching vibration of polymeric intermolecular hydroxyl groups. The bands at 2936 cm-1 and 2890 cm-1 were attributed to asymmetric and symmetrical stretching vibrations of CH2, respectively and the band at 1330 cm- 1 to CH2 bending. At 1645 cm-1, OH bending vibration band is related to adsorbed water, inulin being highly hygroscopic. Below 1500 cm-1, in the fingerprint region, a multitude of bands, some with weak intensities, are detected. A small band corresponding to the CH2 symmetric bending mode of the hydroxymethyl functions is observed at 1430 cm-1. Following closely, lower bands at 1380 and 1332 cm-1 are identified as bending modes of
OCH, CCH, CH2 for the former and CCH, COH for the latter. At 1240, 1220 and 1196 cm-1, bands representative of CCH, COH and OCH bending modes are detected. They are closely followed by more prominent bands at 1160, 1130, 1025, 985, 832, 874 and 817 cm-1 corresponding to the stretching vibrations of CO, CC and complex bending modes of pyranose ring vibrations (CCC, CCO, CO and CC).
Table 2. Major infrared bands of raw inulin.
Range (cm-1) group vibration remarks
3680-3000 O-H stretching Intermolecular bonded OH (polymeric)
2936 C-H Asymmetric stretching >CH2 methylene 2890 C-H symmetric stretching >CH2 methylene 1645 O-H bending From adsorbed water 1430 C-OH Symmetrical stretching hydroxymethyl
1332 COH CCH bending bending Intermolecular bonded OH >CH2 methylene 1240 C-O CCH COH stretching bending bending 1220 COH CCH bending 1196 OCH CCH bending 1160 C-O-C CCC CO + CC CCC
Pyranose ring vibrations
1130 C-O-C bending Bridge oxygen 1025 C-O-C CO
CC
Valent stretching vibrations of C-O-C groups and ring vibrational modes
985 C-O CCO CO CCO 934 C-O CCH
CO + CCH + as (ring)
874 CC + CCH + CH Methylene acetal and ring vibration 817 C-H Bending (wagging) -pyranose ring vibration
Upon the plasma treatment, various modifications of the spectra were observed as a function of treatment time.
In the high region, 4000-2500 cm-1, slight changes were observed on the normalized spectra,
consisting of an increase of the OH band intensity up to 5 mins that shifted from 3295 to 3353 cm-1,(60 cm-1 shift). The decrease of DP leads to an increase of the OH vibrational bands from fructose. As a matter of fact, dimeric OH bands can be found in the 3550-3450 cm-1 region while those from polymers are in the region 3400-3225 cm-1. Similarly, the CH2 stretching bands followed the same trend, without shift. Above 7 mins of plasma treatment, a decrease of the band intensity indicates a loss of OH and CH2 groups due to the dehydration of fructose into HMF.
In the 2500-1100 cm-1 region, a new band was detected at 1730 cm-1 and was attributed to the formation of aldehydes or ketones from the oxidation of C6H2OH groups. A large shift and narrowing of the 1635 cm-1 band to 1664 cm-1 was observed. It appears that the bending vibration of H2O disappeared as a function of time while a band characteristic of bending of OH from -D fructose emerged between 5-7 mins. Another hypothesis is the formation of an amide, whose characteristic bands is at 1660 cm-1 (C=O stretching). Additional band at 1522 and 1402 cm-1 would confirm the presence of amides with N-H bending and C-N stretching, respectively.
C-OH hydroxymethyl character at 1430 cm-1 and 1380 cm-1 (bending modes of OCH, CH2, CCH) was slowly hindered by the increase of the band at 1402 cm-1 and 1450 cm-1, the latter mostly corresponding to C-O stretching from carboxylic acid or carboxylate ions.
Modification of the 1330 cm-1 band that increases in intensity and disappears at the expense of a small band at 1340 cm-1 is observed. This shift could be due to the progressive depolymerization of inulin into fructose, whose band at 1340 cm-1 reflects the bending vibrations of OCH and CCH of -D fructose.
Small protuberances at 1271 cm-1 and 1242 cm-1 disappeared up to 7 mins and a 1275 cm-1 small but wide band emerged from 9 mins and could be related to C-O stretch of carboxylic acids or N-H stretch of amide.
A loss of the bridging C-O-C character is also observed at 1130 cm-1 from 1 to 5 mins.
An increase and widening of the band is observed at 1196 cm-1, corresponding to OCH and CCH bending vibrations bands of fructose, glucose and fructooligosaccharides of higher DP. In addition to inulin stretching ring vibration CCH and COH, CH and OH bending vibrations of D-glucose are observed in this region.
In the 1100-600 region, noticeable changes are observed as a function of the plasma
treatment time. Especially at 7 mins, where a loss, shift or emergence of bands at 1075 cm-1 (gain), 1030 cm-1 (loss), 986 cm-1 (loss), 978 cm-1 (gain), 934 cm-1 shifts to 921 cm-1, 874 cm -1 (loss) and 855 cm-1 (emergence) were observed.
The total loss from 1 to 7 mins of 986 cm-1, 934 cm-1 and 874 cm-1 bands which are relevant to C-O-C bridge oxygen, C-O from furanose and pyranose rings vibrations indicates not only a depolymerization by cleavage of the -1,2 bond but also an opening of the ring at the C-O position.
Appearance from 7 mins of 986 cm-1 to 978 cm-1 (C-O, CCO fructose), shift of 934 cm-1 to 921 cm-1 (C-O, CCH + ring fructose) confirms the loss of the polymeric structure to monomer characteristics. The 889 cm-1 shoulder and 874 cm-1 shift to 855 cm-1 could be related to glucose and fructose ring vibration, COH and CCH.
From 2 mins, a band at 778 cm-1 emerged and slowly shifted to 770 cm-1 corresponding to CCO and CCH bending of D-fructose, the shift to 770 cm-1 is probably due to addition of CCO and CCH bending vibrations of D- glucose.
Based on this exhaustive list of band assignments, conclusions can be drawn regarding inulin depolymerization reaction. The changes in the high region 4000-2500 cm-1 refers to the deconstruction of inulin into fructose and further decomposition into HMF at longer treatment times. In the mid region 2500-1100 cm-1, the various modifications concern the oxidation of
acid with increased treatment duration. Though the hypothesis of oxide formation is the most reliable, it should be kept in mind that the interpretation could also imply different bands of NH, CN bending and stretching vibrations, thus the presence of amide. The formation of -D fructose is supported by different bands related to OCH, CCH, OH vibrations and loss of the COC bridge oxygen, which is a characteristic band of polymers. Glucose formation also detected in the mid and low region, below 1100 cm-1.
4
Conclusion
Depolymerization of inulin into fructose (32 % yield) was successfully achieved by non thermal plasma at atmospheric pressure. The distributions of inulin, fructose, glucose and DP≥2 fructooligosaccharides were dependent on the plasma discharge electrical
characteristics and reactive species involved in the gas phase. It was suggested that ROS and RNS play a key role in the depolymerization process, via OH radicals or nitric acid attack. Oxidized inulin could also act as a catalyst center for its deconstruction. Infrared analysis revealed the oxidation of inulin into carboxylic acid, aldehyde or ketone, followed by the breakage of glycosidic bond and ring opening. The presence of amides was also suggested, providing evidence that RNS are involved in the process. A way to improve the fructose yield would consist in developing a reactor with a controlled cooling system. However, small fructo-oligosaccharides can also be considered for applications, such as food industry.
Received: ((will be filled in by the editorial staff)); Revised: ((will be filled in by the editorial staff)); Published online: DOI: 10.1002/ppap.2018xxxxx
[1] A.C. Apolinárioa, B.P.G. de Lima Damascenoa, E. de Macêdo Beltrãob, A. Pessoac, A. Convertid, J.A. da Silvaa, Carbohydr. Polym. 2014, 101, 368.
[2] Z.-M. Chi, T. Zhang, T.-S. Cao, X.-Y. Liu, W. Cui, C.-H. Zhao, Bioresour. Technol.
2011, 102, 4295.
[3] X.Y. Wu, P.I. Lee, J. Appl. Polym. Sci. 2000, 77, 833
[4] M. Hariono, M. Faizin Akbar, I. Sularsih, L. Najihah, S. Purwadi, A. Wahyu Nugrahani, NSPM, Putrajaya, Malaysia, (December, 2009).
[5] G. Grandtner, N. Joly, J.-P. Cavrot, R. Granet, G. Bandur, L. Rusnac, P. Martin, P. Krausz, Polym. Bul. 2005, 55, 235.
[6] J. Anes, P. Fernandes, Biocatal. Agric. Biotech. 2014, 3 296.
[7] E. Ricca, V. Calabrò, S. Curcio, G. Lorio, Process Biochem. 2009, 44, 466. [8] R. Karatop, F. Sanal, J. Cell Mol. Boil. 2013, 11, 21.
[9] K. Parker, M. Salas, V. C. Nwosu, Biotechnol. Mol. Biol. Rev. 2010, 5, 71. [10] E. Ricca, V. Calabrò , S. Curcio, G. Iorio, Crit. Rev. Biotechnol. 2007, 27, 129. [11] P.K. Gill, R.K. Manhas, P. Sing, J. food Eng. 2006, 76, 369.
[12] M. Benoit, A. Rodrigues, Q. Zhang, E. Fourré, K. De Oliveira Vigier, J.-M. Tatibouët and F. Jérôme, Angew. Chem. Int. Ed. 2011, 50, 8964.
[13] Bogaerts A., Neyts E., Gijbels R., Van der Mullen J., Spectro. Acta Part B 2002, 57, 609. [14] U. Kogelschatz, B. Eliasson and W. Egli, Pure Appl. Chem. 1999, 71, 1819.
[15] (a)Van Durme J., Dewulf J., Leys C., Van Langenhove H., Appl. Cat. B: Env. 2008, 78, 324; (b) Hyun- Ha K., Plasma Process. Polym. 2004, 1, 91.
[16] J. Delaux, M. Nigen, E. Fourré, J.-M Tatibouët, A Barakat, L. Atencio, J.M. García Fernández, K. De Oliveira Vigier, F. Jérôme, Green Chem. 2016, 18, 3013.
[17] C. Antonetti, D. Licursi, S. Fulignati, G. Valentini and A. M. Raspolli, Catalysts 2016, 6, 196.
[19] T. B. Cook, W. P. West, F. B. Dunning, R. D. Rundel, and R. F. Stebbings, J. Geophys.
Res., 1974, 79, 678
[20] V. Guerra, F. M. Dias, J. Loureiro, P. Araújo Sá, P. Supiot, C. Dupret, and T. Popov,
IEEE Trans. Plasma Sci. 2003, 31, 542
[21] T. Kowalski, Nuclear Inst. Meth. Phys. Res. A 2014, 735, 528
[22] M.A. Rios, M. Nudnova, S. Kindusheva, N. Aleksahdrov and A. nStarikovskiy, 49th
AIAA Aerospace Sciences Meeting including the New Horizons Forum and Aerospace Exposition 4 - 7 January 2011, Orlando, Florida, 1275
[23] J. Duan and D. L. Kasper, Glycobiol. 2011, 4, 401.
[24] C. Norsic, J.M. Tatibouët, C. Batiot-Dupeyrat and E. Fourré, Chem. Eng. J. 2018, 347, 944.
[25] S. Kon and S. Schwimmer, Journal of Food Biochemistry 1977, 1, 141.
[26] B. C. Gilbert, D. M. King and C. Barry Thomas, J. Chem. Soc. 2, Perkin Trans. 1981, 0, 1186.
[27] L. Zhou, X. Yang,J. Xu, M. Shi, F. Wang, C. Chen and J. Xu, Green. Chem.,
2015,17,1519
[28] M. Grube, M. Bekers, D. Upite and E. Kaminska, Spectroscopy 2002, 16, 289.
[29] R.S. Tipson, Infrared spectroscopy of carbohydrate, Institute for Material Research, National Bureau of Standards, Washington DC, 1968.
[30] M. Ibrahim, M. Alaam, H. El-Haes, A. F. Jalbout, A. de Leon, Ecl. Quím. 2006, 31, 15. [31] J. Guo and X. Zhang, Carbohydr. Res. 2004, 339, 1421.
Graphical Abstract
Depolymerization of inulin into fructose is achieved by non thermal plasma treatment at atmospheric pressure. The gas chemical nature is a key parameter for the reaction.
Re-polymerization of fructose into fructo-oligosaccharides depends on treatment time and local temperature. These products can be valorized various applications.
Raluca Nastase, Jean-Michel Tatibouët, Elodie Fourré*
Depolymerization of inulin in the highly reactive gas phase of a non thermal plasma at atmospheric pressure