HAL Id: tel-02967084
https://tel.archives-ouvertes.fr/tel-02967084
Submitted on 14 Oct 2020HAL is a multi-disciplinary open access archive for the deposit and dissemination of sci-entific research documents, whether they are pub-lished or not. The documents may come from teaching and research institutions in France or abroad, or from public or private research centers.
L’archive ouverte pluridisciplinaire HAL, est destinée au dépôt et à la diffusion de documents scientifiques de niveau recherche, publiés ou non, émanant des établissements d’enseignement et de recherche français ou étrangers, des laboratoires publics ou privés.
Contribution to Photochemical Imaging of Complex
Plasmonic Fields
Yinping Zhang
To cite this version:
Yinping Zhang. Contribution to Photochemical Imaging of Complex Plasmonic Fields. Micro and nanotechnologies/Microelectronics. Université de Technologie de Troyes, 2017. English. �NNT : 2017TROY0041�. �tel-02967084�
THESE
pour l’obtention du grade de
D
OCTEUR
de l’U
NIVERSITE
DE
T
ECHNOLOGIE DE
T
ROYES
Spécialité : MATERIAUX, MECANIQUE, OPTIQUE ET NANOTECHNOLOGIE
présentée et soutenue par
Yinping ZHANG
le 21 décembre 2017Contribution to Photochemical Imaging
of Complex Plasmonic Fields
JURY
M. M. MOLINARI PROFESSEUR DES UNIVERSITES Président
M. R. BACHELOT PROFESSEUR DES UNIVERSITES Directeur de thèse M. R. BARILLÉ PROFESSEUR DES UNIVERSITES Rapporteur Mme C. FIORINI DIRECTEUR DE RECHERCHE CEA - HDR Rapporteur M. J. PLAIN PROFESSEUR DES UNIVERSITES Directeur de thèse M. G. WIEDERRECHT SENIOR SCIENTIST Examinateur
Acknowledgements
This PhD work is accomplished with the support of numerous people from inside and outside LNIO.
First of all, I would like to give my very grateful thanks to my advisors, Prof. Renaud Bachelot and Prof. Jerome Plain, for all their advices, encouragement and care ever since I started my thesis under their supervisions. They are extraordinary supervisors that is meticulous in science and with plenty of ideas. Their patient, amiable, optimistic, and humorous characteristics and qualities have provided me a very pleasant environment for research. It is my great honor to work with them to start my research life.
Our collaborator Jérémie Béal has provided some samples for this dissertation. Thanks for his help in fabricating these beautiful samples, which allow us to achieve reliable quantitative measurements, as well as Serguei Kochtcheev, he give me big help in many aspects, such as SEM, fabricate sample holder, and most all the problems in sample fabrication. My colleagues Thomas Lerond and Samuel Ouellet for training me on the optical setup.
The numerical simulations and theoretical calculations involved in this PhD work were performed by our collaborators Prof. Guillaume Demesy and Prof. Nicolas Bonod. Thanks should be given to them for the calculated results and fruitful discussions. Thanks should be given to Dr. David Gérard, who participated in our discussions, for giving very helpful ideas, comments and suggestions. I would like to give thanks to Prof. Pierre-Michel Adam, Dr. Anne-Laure Baudrion-Béal and Prof. Christophe Couteau give my help on the experimental setup.
I would like to give many thanks to Régis Deturche for training me on the scanning electron microscope and solving AFM problem. Thanks should also be given to Julie, Feifei, Fengtang for helping me on FDTD simulation, and Hongshi, Komla, Juilin, Ying, Zainab as well as guys from LNIO whose names have been mentioned above, for sharing with me a very pleasant and memorable time in this lab. It is wonderful to have them as my colleagues.
Just before going to the financial supports, I would like to thank my family for standing with me during these years. Last but not least, I would like to give my acknowledgements to China Scholarship Council for funding. This is the prerequisite for my coming to France for this Thesis. I would like also to thank the platform Nano’mat.
Table of contents
Acknowledgements ... 1
Introduction ... 7
Chapter 1... 11
Introduction to Surface Plasmon and azobenzene-containing polymer ...11
1.1 Introduction ... 11
1.2 Surface plasmons ... 12
1.2.1 Bulk plasmon ... 12
1.2.2 Surface plasmon ... 13
1.2.3 Localized surface plasmon in metal nanoparticle ... 15
1.2.4 The influencing factors of local surface plasmon resonance ... 19
1.3 Azobenzene polymer ... 23
1.3.1 DR1 molecule ... 23
1.3.2 DR1 molecule isomerization ... 24
1.3.3 PMMA-DR1 polymer ... 26
1.3.4 Underlying mechanism of PMMA-DR1 polymer ... 27
1.3.5 Physical factors affecting the isomerization of azobenzene polymer ... 28
1.3.6 Vectorial transport of polymer based on Single-photon absorption ... 29
1.4 Summary ... 31
References ... 33
Chapter 2... 37
Experimental procedures ...37
2.1 Introduction ... 37
2.2 The preparation of nanostructure using EBL... 37
2.3 Microscopic scattering spectroscopy ... 41
2.4 AFM image in tapping mode and SEM image ... 43
2.5 Photochemical imaging method ... 48
2.6 Summary ... 55
References ... 56
Chapter 3... 59
The near-field optical properties of linear plasmonic trimer antenna ...59
3.1 Introduction ... 59
3.2 Near-field coupling in linear nanotrimer ... 60
3.3 Two-photon absorption in PMMA-DR1 ... 62
3.4 Experimental results and simulation analysis ... 64
3.4.1 Experimental configuration ... 64
3.4.2 TE exposure at normal incidence (θ = 00) ... 65
3.4.3 TM exposure at normal incidence (θ = 00) ... 66
3.4.4 Near-field intensity located on gap ... 68
3.4.5 TM exposure at oblique incidence (θ = ±300) ... 69
3.5 Quantitative analysis of topographic depletion ... 72
3.6 Potential binary modulation nanosystem ... 73
3.7 Summary ... 74
References ... 75
Chapter 4... 79
Near-field imaging of triangle nanoantenna ...79
4.1 Introduction ... 79
4.2 Plasmon mode excited in nanotrimer ... 80
4.3 Experiment configuration ... 81
4.4 Scattering spectrum... 83
4.5 Experimental results and simulation analysis ... 83
4.5.1 TM exposure at normal incidence (θ = 00) ... 84
4.5.2 TE exposure at normal incidence (θ = 00) ... 87
4.5.3 Exposure with 450 incident polarization relative to X-axis at normal incidence (θ = 00) ... 90
4.5.4 Exposure with 300 incident polarization relative to X-axis at normal incidence (θ = 00) ... 90
4. 5.5 TM exposure at oblique incidence (𝜃 = 300) ... 94
4.5.6 Circular polarization exposure at normal incidence (𝜃 = 00) ... 97
4.6 Diffraction pattern ... 100
4.7 Summary ... 101
References ... 103
Chapter5 ... 105
Near filed imaging of bowtie antenna ... 105
5.1 Introduction ... 105
5.2 The geometry and near-field distribution of bowtie ... 105
5.3 Scattering spectrum... 106
5.4 Two-photon absorption in bowtie nanoantennas... 107
5.5 Summary ... 110
References ... 111
Conclusions ... 113
French summary ... 115
Contribution à l’imagerie photochimique de champs plasmoniques complexes ... 115
6.1 Introduction ... 115
6.2 Absorption à deux photons de photopolymère ... 116
6.3 Méthode expérimentale ... 118
6.4 Caractérisation en champ proche ... 119
6.4.1 Nanotrimère linéaire ... 119
6.4.2 Nanotrimère Triangle ... 124
6.4.3 Antennes « nœud papillon » ... 134
6.5 Summary ... 136
Appendix ... 141
I Scattering model problem of FEM ... 141
II Character table for the group 𝑫𝟑𝒉 ... 143
Introduction
Metallic nanostructures offer the possibility to strongly confine light at nanometer scale. In general, rational control of the plasmonic nanostructures’ geometry and/or incident beam shaping (including phase, polarization state and angle of incidence) can produce a large variety of near-field distributions that can be exploited in photonic computing, nanophotochemistry, optical trapping, non-linear nanoptics, Surface Enhanced Raman Spectroscopy, plasmon-assisted light emission (including single photon emission), and hot carrier generation and collection.
Plasmonic oligomers are very interesting to efficiently confine and enhance light intensity in deep subwavelength scale with the gaps separating the different plasmonic particles. The so-called hot spots result from the coupling between the localized surface plasmon modes hosted by the individual particles. Multiple hot-spots can be excited simultaneously in plasmonic oligomers. Such a hybridization of plasmonic modes permit to tailor the spectrum of light scattering and the distribution of the near filed. In plasmonic oligomer, the localized surface plasmon resonance depends on the materials, the sizes, the shapes and the geometrical arrangement of nanoparticles, which supports interesting collective behavior of interacting nanoparticles. However, the control of the light spot in plasmonic oligomers and their observation in the near field are highly challenging.
Experimental observation and study of this effect at the nanoscale are crucial for its control and optimization. In practice, the near-field investigation of resonant plasmonic nanogaps constitutes a challenging task for several reasons. For example, the use of Scanning Near-field Optical Microscopy is complicated by the presence of the probe, modifying the resonance conditions for hot spot excitation: the observed resonance would mainly result from the coupling between gap modes and the probe, rather than the optical properties of the plasmonic cavity itself. Additionally, both the nature of the tip-sample optical interaction and the interpretation of the SNOM images strongly depend on the probe (shape, type, quality, control mode,...) and its environenement, which is pretty difficult to control. Other methods were recently reported to study plasmonic nanostructures at the nanoscale. Photon Emission Electron Microscopy (PEEM), based on the photoelectrical effect, has turned out to be highly efficient but requires an electron reservoir. As a result, near-field contrast can be observed only on metal surface and not at zones far from metal. A gap-mode field that is partly delocalized in the dielectric gap medium is not expected to lead to any easily interpretable PEEM contrast, despite some interesting reported data. Additionally, because of the out-of plane electric field used for electron accelerations, this technique is mainly sensitive to out-of plane field components whereas local fields that result from in-plane plasmonic coupling are mainly in-plane polarized. This important point will be discussed further. As far as Electron Energy Loss Spectroscopy (EELS) is concerned, contrasts result from local electronic absorption (a metal reservoir is thus also required) and no optical
excitation is possible (excitation is purely electronic in EELS). Additionally, it was recently shown that inside the gap region of a coupled plasmonic system, the EELS signal can become zero for the bonding mode and maximal for the antibonding mode.In general, PEEM and EELS techniques are very efficient but pretty sophisticated and expensive.
In this dissertation, we report direct near-field observation of plasmonic oligomer with linear trimer, triangle trimer and bowtie dimer, based on a photochemical imaging method by two-photon irradiation, opening the route to near-field investigation of coupled systems in infrared regime. In this method, plasmonic nanoantennas as near-field light source is coved by PMMA-DR1 polymer film. Following two-photon irradiation of the polymer within the absorption band of DR1, the molecules will undergo trans-cis photoisomerization. Note that with polarized light those molecules oriented with their transition moment parallel to the illumination field will be preferentially excited. This is followed by relaxation of DR1 molecules back to their trans form after an average translation parallel to their molecular axis. Surface effects are thus governed by photon-assisted molecular diffusion, with the azo-dye molecules playing the role of molecular motors that push or pull the polymeric host along the polarization of the incident field. This leads to a photoinduced mass transport that produces surface topography after irradiation that is characterized using an AFM. In such an experiment, each molecule acts as a nanoprobe of the optical near field of the nanostructures. The first chapter of this dissertation is divided two parts. The first part will describe the surface plasmon supports by single nanoparticle, which is a key factor for near-field coupling existed in plasmonic oligomers. The surface plasmon is tunable by the variation of such properties such as size, shape and nature. The energy loss of surface plasmons results from size effects including inelastic and elastic process. In the second part we will introduce azobenzene molecule as a probing molecule grafted on polymer, it can respond the near field of plasmonic nanoparticle and serve as a technique for the near-field characterization, which will be discussed throughout this dissertation.
In chapter 2, we will introduce all the experimental procedures and techniques in this PhD work. The detail procedures of sample preparation based on electron-beam lithography (EBL) will be presented, as well as the limitation of this method. In this dissertation, all used plasmonic oligomers, i.e., linear trimer, triangle trimer and bowtie dimer, are fabricated by EBL. Besides, the characterizing tools, such as atomic force microscope, scanning electron microscope are introduced. Specially, we pay more attention to a photochemical imaging characterizing method, which will go through the detail procedures for the coming chapters.
Linear trimer of gold nanoantennas is experimentally and theoretically studied as one example of plasmonic oligomers in chapter 3. It is highly suited to selectively yield strong field enhancements. The trimer antenna forms two nanogaps separated by a distance of a quarter of the wavelength in the polymer and is designed to allow for the
switch on a single nanogap when illuminated at 900 nm by a collimated beam at an oblique incidence. The monitoring of the topographical depletions in the photopolymer proves that it is possible to address a single hot spot in the structure and to switch its location in the two nanogaps on demand, by simply illuminating with an opposite oblique incidence. This work shows that hot spot locations can be addressed from the far field region and that two-photon absorption by azobenzene-containing photopolymer is a reliable approach for investigating confined plasmonic fields in the near infrared with a 20 nm resolution.
In chapter 4, a plasmonic oligomer with equilateral triangle arrangement of gold nanodisks is studied by the same method used in chapter 3. Three identical nanogaps are formed because of trigonal symmetry in such a triangle trimer. Hot-spot pattern with
two types of C2-symmetry resulting from the coupling of three plasmon modes can be
selectively excited.
In chapter 5, a simplest plasmonic oligomer, bowtie dimer, is studied. The strong coupling between triangle nanoparticles for smaller gap leads to an enhancement of the two-photon process revealed by the accumulation of matter in the interparticles space. While it decreases when increasing the gap because of the weakness of the coupling between the nanoparticles.
This thesis will end up with conclusion. In the part of appendix, a very brief description and analysis can be fund concerning linear trimer mode and character table of D3h group.
Chapter 1
Introduction to Surface Plasmon and
azobenzene-containing polymer
1.1 Introduction
Nanometer noble metal shows a strong surface plasmon resonance (SPR) in visible spectrum range[1]. The SPR is a resonant collective oscillation of conduction band electrons that results in strongly enhanced electric field at metal/dielectric interface[2]. Over the past 20 years, this enhanced effect is attracting extensive and intensive interests in research for its potential applications[3]–[6]. Benefiting from the development of nanofabrication and characterization, the surface plasmon properties can be manipulated, designed and selected in different nanoscale optical elements corresponding to actual applications[7][8]. Imaging approaches that enable visualization of plasmonic electromagnetic fields over length scales ranging from microns to nanometers are increasingly important as optical technologies and scientific studies continue to push to smaller lengths scales to reveal new light-matter interactions. The ability to image the optical
near-field intensities that result when nanostructured materials and devices are exposed to light is actually essential for both advancing scientific knowledge and for enabling applications. Since ordinary optical microscopy cannot resolve beyond about a half wavelength of visible light, other approaches that go beyond this diffraction limit must be used, such as scanning near-field optical microscopy (SNOM)[9] and photoemission electron microscopy (PEEM)[10]. Whereas SNOM brings a probe tip to be almost in contact with the sample and PEEM involve electronic optics and vacuum, our group has been pursuing a “non-invasive” approach based on photoisomerization of azobenzene molecules-disperse red 1 (DR1) molecule.
In this method, Visible light can excite the trans-cis isomerization in azobenzene-like DR1 molecules grafted to poly(methylmethacrylate) (PMMA) (the DR1 molecules containing polymer called PMMA-DR1 polymer). Upon absorbing a photon, an isomerization cycle produces a ‘worm-like’ motion that leads to a displacement along the transition moment axis that could be on the order of nanometer. Two-photon absorption is also possible, enabling the use of infrared light. The DR1 molecules thus are nanomotors that push and pull at the polymer material, after many repeated isomerization cycles, leading to topographical deformation. Imaging a polymer deposited over metal nanoparticles that have a strong plasmon resonance in visible, using the near field excites the DR1 molecule, such topography feature is therefore a reflection of the underlying near field to be analyzed. After exposure to the light, an atomic force microscope (AFM) can be used to measure the resulting topography that
will be related to the near-field intensities pattern to be characterized.
The first part of this chapter aims at reminding important properties of localized surface plasmon in metal nanoparticle based on Drude-Lorentz model and Maxwell’s electromagnetic theory. Then, in the second part, we will turn our attention to DR1 molecule and PMMA-DR1 polymer, whose properties will be discussed in more details. This chapter will allow us to analyze and discuss the results presented in the following chapters, and to introduce our photochemical imaging method (chapter 2).
1.2 Surface plasmons
1.2.1 Bulk plasmon
A plasmon is defined as the collective oscillation of conduction electrons in metal, Bulk plasmon is associated to longitudinal charge density oscillation that are free to propagate within the volume of the metal. Considering an ideal metal model, the electron-electron interaction and the electromagnetic electron-iron interaction is ignored, these electrons are able to move against a fixed background of positive ions while the overall system is kept macroscopically neutral, they move in straight line until collision with irons, no forces act on them during a mean free time. The Drude model is a free electron gas model, in which these delocalized electrons flow freely around the lattice nuclei. If the collision is considered as the only way of damping. The motion equation for a free electron is
(1.1)
Here 𝛾 = 1 𝜏⁄ is the damping frequency due to electron collisions, where 𝜏 is the relaxation time of the free electron gas, 𝜔 and 𝐸𝑜 are frequency and amplitude of the applied electric field respectively. 𝑚𝑒 is the effective free electron mass, e is the free electron charge. Solving equation (1.1) in the case of harmonic solution leads to the following Drude type dielectric function for metals[11]
e
m(
w
)
=
e
¥-
w
p2
w
2+
i
gw
(1.2)where 𝜀∞ is the high frequency limit of the dielectric constant, 𝜔𝑝is the bulk plasmon frequency,
w
p=
Ne
2In Eq. (1.3) N is the free electron volume charge density in metal, and 𝜀𝑜 is the permittivity of free space. The damping frequency 𝛾 can be neglected for high frequencies near 𝜔𝑝 because of 𝜔𝜏 ≫ 1. The Drude dielectric function simplifies to
e
m(
w
)
=
1
-
w
p2
w
2 (1.4)In the case of 𝜔 > 𝜔𝑝, 𝜀𝑚 becomes a positive number corresponding to a real
refractive index 𝑛 = √𝜀𝑚, where the wave propagates through the metal without decay,
in other word, the metal is transparent to the electromagnetic wave. On the contrary, if 𝜔 < 𝜔𝑝, 𝜀𝑚 becomes negative and n gets imaginary, which means that metal is highly absorptive and electromagnetic wave cannot propagate in the metal.
Drude model gives quite accurate results for optical properties of noble metal in the infrared region[12], but it becomes inaccurate for higher frequencies because interband transitions occur in the visible. Therefore, Lorentz modified the Drude model by considering both free electrons contribution and bound electrons contribution, so a restoring spring force 𝑚𝑒𝜔𝑜2𝑟 is added to the Drude model where 𝜔
𝑜 is the resonance frequency for the metal, which comes from the lattice potential. The motion equation of the Drude-Lorentz model is
(1.5)
Solving equation (1.5) with harmonic solution leads to a Lorentz-oscillator term that is added to the dielectric function[13]. Thus, the dielectric function has the form,
e
m(
w
)
=
e
¥-
w
p 2w
2+
i
gw
-D
e
W
L 2(
w
2- W
L2)
+
i
G
Lw
(1.6)Where Ω𝐿 and Γ𝐿 respectively stand for the oscillator strength and the spectral width of the Lorentz oscillators, and Δ𝜀 can be interpreted as a weighting factor.
1.2.2 Surface plasmon
A surface plasmon is a coherent oscillation of electrons confined at the interface between metal and dielectric, which interact with light to form coupled surface wave
surface plasmon can be derived by solving Helmholtz equation in metal and dielectric:
(Ñ
2+
e k
2)E (r,
w
)
=
0
(1.7)
where 𝜀 is dielectric function, 𝜔 and 𝐸 are frequency and amplitude of the applied electric field, respectively. κ is the wave vector.
In general, there are two sets of self-consistent solutions for Helmholtz equation corresponding to TM mode and TE mode. Here TE mode is neglected because it cannot excite plasmon that is a partly longitudinal wave. Considering the continuous boundary condition, the dispersion relation is given as follows
k
x=
w
c
e
me
de
m+
e
d (1.8a)k
Zj=
w
c
e
j 2e
m+
e
d (1.8b)where 𝜀𝑚 is the dielectric function in metal as above for the infinite half space 𝑍 < 0 (Z=0 corresponds to the interface), 𝜀𝑑 is the dielectric function in dielectric for the infinite half space 𝑍 > 0, 𝑗 = 𝑚 𝑓𝑜𝑟 the 𝑍 < 0 and 𝑗 = 𝑑 for 𝑍 > 0, 𝑐 is the speed of light in vacuum and κ𝑥 and κ𝑧 are, respectively, the x and z components of the wave vector. The surface plasmon frequency is
w
sp=
w
p1+
e
d(1.9)
From the dispersion relations (1.8), the condition for the existence of interface mode must obey the following equations,
e
m+
e
d<
0
e
me
d<
0
This condition demands imaginary 𝜅𝑧𝑗, which means that the surface plasmon is strong at the interface and decay evanescently in both the metal and the dielectric, resulting in an evanescent field 𝐸0𝑍𝑒−|𝜅𝑧𝑗||𝑧| whose amplitude exponentially decreases
with the distance |𝑧| from the interface as shown in Fig. (1-1). Skin depth 𝜎, that is also called penetration depth, is the z distance where the electromagnetic field falls by a factor of 1 𝑒⁄ :
s
j=
1
k
zjÛ
s
d=
l
2
p
e
m+
e
de
d 2s
m=
l
2
p
e
m+
e
de
m 2ì
í
ï
ï
î
ï
ï
(1.10)Here 𝜎𝑏 and 𝜎𝑚 are the skin depths in dielectric and metal, respectively. The skin depth depends on material properties and excited wavelength. The decay rate of surface plasmon is higher in metal than dielectric due to the large real part of dielectric function in metal.
Because the surface plasmon dispersion is below the photon dispersion derived by Eq. (1.8), surface plasmon wave can only be optically excited using special configurations to match the momentum of surface plasmon with incident photos due to its smaller effective wavelength and higher in plane wave vector. Prism coupling is usually used to excite surface plasmon wave such as the Kretschmann-Raether[14] and Otto configuration, grating coupling is other method[15].
Fig.1-1: A surface plasmon wave propagates along the interface of metal and dielectric and decays exponentially along z direction, which is perpendicular to the interface.[16]
1.2.3 Localized surface plasmon in metal nanoparticle
Comparing with surface plasmon, localized surface plasmons are non-propagating modes that can be excited by light on the surface of nanoparticle and the rough surface of nanofilm[17][18]. For gold and silver nanoparticles, the resonance frequency falls within the visible spectrum regime. This section mainly introduces surface plasmons that are located in metal nanoparticles. The quasi-static approximation provides a compact analysis of localized surface plasmon in nanoparticles with the characteristic length that is much smaller than the wavelength of incident light. The electric field phase can be considered as to be uniform through the small nanoparticle. Therefore, the
in phase with each other.
Fig.1-2: Schematic of plasmon oscillation for a nanosphere, showing the displacement of the conduction electron charge cloud relative to the nuclei.[19]
As an example, a homogenous isotropic nanosphere can be considered in order to explain the surface plasmon in nanoparticle because an accurate analytical solution can been found out in such high-symmetry structure. Under the driven force of external electrostatic field, the conduction electrons redistribute, which collectively shift with respect to fixed positive charge background as shown in Fig. (1-2). As a result, an electric dipole moment is induced along the electric field in this small nanoparticle. Coulomb attractive force generates a restoring force between negative charges and positive ions on the opposite side. If the frequency of driven field equals the dipole oscillation frequency, surface plasmon resonance spatially located on the surface of nanoparticle can be excited. In that case, even a small exciting field leads to a strong electron oscillation, therefore, strong electromagnetic energy accumulates on the surface of nanoparticle along the direction of polarization, this is the so called near field enhancement.
The electric distribution inside and outside the nanosphere can be calculated by the Laplace equation,
Ñ
2j
=
0
(1.11)where is the electric potential function. The general solution of the Laplace equation is the product of the angular function and radical function, which allows one to separate Laplace’s equation into two separate ordinary differential equations, one is the radical equation whose solution is a function of 𝑟 (radial position) and the other is the angular equation whose solution is a function of 𝜃 (angular position). In spherical coordinates, the spherical harmonic is the solution of the angular equation. The solution of radical equation has the form
where A and B are constants which can be determined by the boundary conditions. In generally, we apply two boundary conditions :(i) the electric potential 𝜑 is continuous at the sphere surface and (ii) the normal component of the electric displacement is also continuous. In dipole approximation, the angular momentum of local surface plasmon 𝑙 should be 1. The potentials outside 𝜑𝑜𝑢𝑡 and inside 𝜑𝑖𝑛 the nanosphere with boundary conditions in spherical coordinates can be obtained,
j
out= -
E
or sin
q
cos
f
+
e
m-
e
de
m+
2
e
dE
oa
3sin
q
cos
f
r
2r
>
a
j
in=
-3
e
de
m+
2
e
dE
or sin
q
cos
f
r
£
a
ì
í
ï
ï
î
ï
ï
(1.13) 𝜑𝑜𝑢𝑡 stands for the electric potential energy from external field and dipole potential energy from induce dipole in metal particle. 𝐸𝑜 is the external electric field, 𝑟 is the distance between the center of the nanoparticle to the measuring point. (𝜃, 𝜙) is the angle between the position vector 𝑟⃗ and the polarization, a is the radius of the nanoparticle, 𝜀𝑚 and 𝜀𝑑 are the dielectric function of metal and the dielectric constant of the medium around the nanoparticle. From the relationship 𝐸 = −∇𝜑, the electric fields outside and inside nanoparticle are obtained under electrostatic dipole approximation,
Here vector 𝑝⃗ is the dipole moment induced by external field inside nanoparticle,
(1.15) 𝛼 is the polarization of nanoparticle,
a
=
4
p
a
3e
m-
e
de
m+
2
e
d(1.16)
When 𝑅𝑒[𝜀𝑚(𝜔)] = −2𝜖𝑑, the electric field on the surface of nanoparticle will be strongest, this condition is called the 𝐹𝑟𝑜̈ℎ𝑙𝑖𝑐ℎ′𝑠 criterion and the resonant mode is
called the dipole surface plasmon of the metal nanoparticle. In dipole approximation, the corresponding cross section for the absorption and scattering can be calculated
C
abs=
k
oIm(
a
)
(1.17a)
C
sca=
k
o 46
p
a
2
(1.17b)
C
ext=
C
abs+
C
sca (1.17c)where 𝑘𝑜 is the wavenumber of light in vacuum. The extinction cross section is used to characterize the total loss of energy from the incident light due to absorption and scattering of the nanoparticle. From the above set of equations, both the scattering and the absorption cross section depend on the polarizability therefore, the absorption and the scattering cross sections are strong at the local plasmon frequency because of the 𝐹𝑟𝑜̈ℎ𝑙𝑖𝑐ℎ′𝑠 condition, in addition, the absorption scales with 𝑎3 and the scattering scales with 𝑎6, so the extinction cross section is dominated by absorption for small nanoparticles and scattering for large particles.
Dipole approximation is only suitable for small metal nanosphere, however higher order multipolar modes need to be taken into account for large nanoparticles at radium around 30nm, such as quadrupole mode in which half of the electron cloud moves parallel to the applied field and half moves antiparallel. The multipolar polarizability 𝛼𝑙 has the following form,
a
l=
4
p
a
3l (
e
m-
e
d)
l
e
m+
(l
+
1)
e
d (1.18)The resonance condition occurs when the denominator 𝑙𝜖𝑚+ (𝑙 + 1)𝜖𝑑 is close to zero. Therefore, the localized surface plasmon resonance condition of multipolar modes is
e
m(
w
)
e
d+
l
+
1
l
=
0
(1.19)From the Drude dielectric function 𝜖𝑚(𝜔) = 1 −𝜔𝑝2
𝜔2, the Local surface plasmon
resonance frequency is
w
l=
w
p[
l
e
+
+
]
1
Where 𝜔𝑝 is the bulk plasmon frequency as mentioned above[20]. When the characteristic length of nanoparticle is much smaller than the incident wavelength, the angular moment l equal to 1, the Local surface plasmon resonance is dominated by electric dipole interaction. However, as the radius of nanoparticle increases, higher order
multipolar modes become non-negligible, When 𝑙 ⟶∞, local surface plasmon
frequency approaches the surface plasmon resonance of the smooth metal film.
1.2.4 The influencing factors of local surface plasmon resonance
Fig. 1-3: Schematic representation of radiative (left) and nonradiative (right) decay of particle plasmons in noble metal nanoparticles. The nonradiative decay occurs via excitation of electron-hole pairs either within the conduction band(intraband excitation) or between the d band and the conduction band(interband excitation)[21].
As stated above, the electrons are moving in phase in a nanoparticle whose size is smaller than 30nm, in this case an electric dipolar distribution of oscillation charges dominates on the surface of the nanoparticle, which means the incident light polarizes uniformly the nanoparticle, the interaction of electric dipole between nanoparticle and incident light is mainly excited, high order electric multipoles are unimportant. Therefore, quasistatic dipolar approximation is suitable. As the radius increases, high order electric multipoles are added to modify the particle plasmon resonance such as quadrupolar mode and octupolar mode. Their peaks are in lower energies ranges and therefore the plasmon band red shifts with the increasing particle size. However, it is not enough to accurately describe such a complex system that is size dependence. The spectrum of the metallic nanoparticle plasmon depends on many factors including, but not limited to, its size, shape and material properties. In this section, these factors are discussed.
Size dependence
and non-radiative damping as shown in Fig. (1-3)[22]. Inelastic processes lead to a plasmon energy loss, while elastic process changes the phase information[23][24]. The radiative damping and elastic process get important in the large metal nanoparticle whose radius is around 50 nm and higher.
As discussed above, the scattering effect becomes more and more important as the increasing of particle radius, these accelerated electrons produce an additional electromagnetic field inside nanoparticle, this electromagnetic field radiates in all directions, which causes these electrons to lose energy[21]. Thus, the radiation damping reduces the intensity and makes broader and asymmetric the surface plasmon resonance, which are red shifted. Otherwise, it is necessary to underline here that the radiation damping is proportional to the total number of oscillating electrons in nanoparticle, so the radiation damping is evident in large nanoparticle.
Comparing with radiative decay process which loss the energy, elastic process is another factor that influences the optical response in large nanoparticle, which arises the inhomogeneous electromagnetic field inside such large nanoparticle[25]. Indeed, when the diameter of the nanoparticle is about 1 10⁄ of the incident wavelength, the incident wavelength cannot be considered as infinite anymore. It exists a response time of interaction between positive charges and negative charges, which distribute on the opposite sphere surface along the direction of polarization. This response time increases with the distance between these opposite charges, Therefore, the phase retardation is proportional to diameter of nanosphere, which equals to 2𝜋 ∙ 2𝑎 𝑙 ∙ 𝜆⁄ 𝑚, where 𝜆𝑚 is the effective wavelength of light in metal, l =1,2,3… for dipole, quadrupole, octupole mode and so on. The phase retardation leads to the increasing of the oscillation period, more importantly, the restoring force becomes weak as the distance increases, so the resonance shifts to the long wavelength, at the same time, the plasmon bandwidth increases with the particle size. The dipolar mode is more sensitive than higher order modes.
Non-radiative damping process dominates the plasmon decay in small nanoparticle below 20nm. From the extinction cross-section, the total loss of energy is caused by absorption, which is different from large nanoparticle scattering. In metal, the conduction band is half-filled, according to Pauli-exclusion principle the electrons can be excited into empty states in the conduction band after absorbing energy. These excitations involve interband transition and intraband transition, from the d-band to conduction band or within the conduction band respectively as shown in Fig. (1-3) right part. Thus there are electron-hole pairs, which further thermalize by collision processes on a sub-ps timescale from a distribution of hot electrons and holes, finally through electron-phonon coupling the energy is transferred to the lattice as heat. Otherwise, the mean free path is larger than the diameter of nanoparticle, so the smaller the particles, the faster the electrons reach the surface of the particles. The electrons can then scatter at the surface and lose the coherence more quickly than in a larger nanoparticle. As a consequence, the plasmon bandwidth increases with decreasing nanoparticle radius.
Shape dependence
Fig. 1-4: TEM images of Au nanostructures of various shapes and sizes. (a) Nanospheres. (b) Nanocubes. (c) Nanorods with aspect ratio of 2.4 ± 0.3. (d) Nanorods with aspect ratio of 3.4 ± 0.5 . (e) Nanorods with aspect ratio of 4.6 ± 0.8 . (f) spectrum a-e correspond to nanospheres, nanocubes, nanorods with aspect ratios of 2.4 ± 0.3, 3.4 ± 0.5, 4.6 ± 0.8, respectively[26].
Apart from size, localized surface plasmon wavelength is also highly dependent on the shape of the nanostructure. Up to now numerous methods have been developed for the preparation of nanoparticles of different shapes. Fig. (1-4) shows the typical TEM images of Au nanoparticles, which were prepared using a seed-mediated method. As shown in Fig. (1-4) (f), the nanosphere with average diameter of 15nm has one surface plasmon peak at 527 nm, the nanocube with average edge length of 44nm also has one surface plasmon peak at 538 nm. However, when one axis of nanoparticle becomes more elongated, its absorption band splits into two bands. Nanorod is a typical example. It exhibits two major surface plasmon peaks[25][27]. One is associated with electron oscillation along the transverse direction, and the other is associated with electron oscillation along the longitudinal direction, As the aspect ratio increases, the energy separation between the resonance of the two plasmon bands increases, and the plasmon resonance wavelength is red-shifted. The plasmon resonance peak can be easily tuned from the near UV to near IR range by just changing the shapes of Au nanoparticle. Therefore, the shape effects are more pronounced in the nanoparticle plasmon resonance, compared to the size effect.
a b c
Material dependence
Fig. 1-5: Typical UV-visible spectra of Ag, Au and Cu nanoparticles. The prevalently spherical shape and size on the order 2-40nm originate a single sharp plasmon absorption at distinctive wavelengths for each metal[28].
As discussed above, when the condition in Eq. (1.19) is satisfied, charge oscillating system has a largest kinetic energy, thus the particle plasmon resonance occurs. Therefore, particle plasmon resonance not only depends on the dielectric properties of nanoparticle, but also the dielectric properties of the surrounding material in which nanoparticle embeds[18]. The plot in Fig. (1-5) clearly demonstrates that the plasmon resonance wavelengths are different for nanospheres with the same sizes but different dielectric functions. It shows a sharp plasmon band close to 400, 530, 600nm for Ag, Au and Cu, respectively.
When the nanoparticle embeds in a dielectric media, the effect of radiative damping is decreased with increasing the surrounding refractive index. The more of nanoparticle radius or the less the refractive index is, the higher is the radiative damping. As a results, the electric field on this nanoparticle becomes weaker as the increasing of refractive index of surrounding media, which decreases the radiative linewidth of the particle plasmon resonance. So the environment plays an important role that was discussed in details for the Ag and Au nanoparticles in [29].
1.3 Azobenzene polymer
As mentioned at the beginning of chapter 1, azobenzene-like DR1 molecules were used as molecular nanomotors for near-field imaging of localized surface plasmons though molecular photoinduced displacement. In this photochemical near-field imaging method, the azobenzene molecules should be grafted on a polymer, the deformation of polymer backbone resulting from azobenzene molecule displacement, records the near-field information. This section aims at describing this system and remind important properties.
1.3.1 DR1 molecule
Azobenzene molecule is characterized by an azo bonding that connects together two phenyl rings as shown in Fig. (1-6). In general, the absorption wavelength required to induce trans-cis isomerization process is different from that for cis-trans reverse process, so the nature of the photoisomerization can be controlled by selecting certain wavelengths. Generally, the trans form can be converted into the cis form using an appropriate wavelength in UV(300-400nm) but the reverse process can be activated in the visible (wavelength larger than 400nm). Cis isomer is metastable and can thermally relax back to the more stable trans state in room temperature. Unsubstituted azobenzene photoisomerization occurs significantly faster than thermal isomerization, so the two processes are well-separated in time.
Fig. 1-6: Azobenzene photoisomerization. The trans form (left) can be converted to the cis form (right) using an appropriate wavelength of light. A different wavelength can be used to convert the molecule back to the trans form. Alternately, the molecule will thermally relax to the stable trans form[30].
All azobenzenes are an unsaturated group that contains conjugated π bond, depending on different electron donor or acceptor ring substitution[31], these azobenzene chromophores are characterized spectroscopically by n → π∗ and π → π∗
actually be separated into three classes according to the relative energetic ordering of
their n → π∗ and π → π∗ states: azobenzene type, aminoazobenzene type and
pseudo-stilbene type (see Fig. (1-7)). According to the requirements, different substituents may be added on azobenzene in the position R and R′ in order to get special physical and chemical properties of azobenzene, as well described in ref. [32].
Fig. 1-7: The structure of azobenzene chromophores (a) azobenzene type, (b) aminoazobenzene type and (c) pseudo-stilbenes.
DR1 is a pseudo-stilbene shown in Fig. (1-7) (c), it possesses both an electron accepting nitro substituent and an electron donating substituent on the ortho- (R) or para-(R′) position of the phenyl ring, it exhibits a high transition energy between π and π∗ bands in visible region due to charge transfer effect and a low transition energy between n and π∗ bands in the near visible ultraviolet region. In this case, the absorption spectrum is the same for both trans and cis conformations, allowing for multiple isomerization cycles with a single incident wavelength. More importantly, compared with azobenzene type and aminoazobenzene type, it has a very fast thermal isomerization rate from cis isomer to trans isomer. Therefore, DR1 has a fast isomerization cycle that can be driven under monochromatic light, which is easy to experimentally operate.
1.3.2 DR1 molecule isomerization
The cis-azobenzene molecule has globular geometry with two phenyl rings twisted perpendicular to the plane, which is obtained from the transformation of the planar trans-azobenzene molecule. The distance between R and 𝑅′ substituent point is decrease from 0.9nm for trans isomer to 0.55nm for cis isomer, as shown in Fig. (1-6), but the dipole moment increases from 0.5 Debye units for trans isomer to 3.1 Debye
to the difference of dipole moments and thus results in the difference of the thermal stability and optical properties. The photoisomerization is a reversible process that occurs in both the trans to cis and cis to trans direction, which depends on the irradiation according to the type of chromophore.
Fig. 1-8: A simple two level model of azobenzene molecule: 𝑆𝑡𝑜 and 𝑆𝑡1 are the ground state and excited state of trans isomer, respectively; 𝑆𝑐𝑜 and 𝑆𝑐1 are the ground state and excited state of cis isomer, respectively. Trans and cis extinction coefficients are denoted 𝜖𝑡𝑟𝑎𝑛𝑠 and 𝜖𝑐𝑖𝑠. 𝛾 is the thermal relaxation. The energy difference between trans isomer and cis isomer is 50𝐾𝐽 𝑚𝑜𝑙⁄ .
In dark condition, DR1 molecules will be in the trans configuration 𝑆𝑡𝑜 because cis
isomer 𝑆𝑐𝑜 has low thermal stability which can come back to trans isomer by thermal
relaxation. After absorbing one photon whose wavelength is in the trans isomer absorption band, trans isomer is pumped to excited state: 𝑆𝑡𝑜⟶ 𝑆𝑡1. Normally this electronic excited state of trans isomer has a short lifetime, which relaxes in a nonradiative way to the low lying level in the cis isomer 𝑆𝑡1⟶ 𝑆𝑐𝑜. The ground state energy of the cis isomer 𝑆𝑐𝑜 is higher than that of the trans isomer 𝑆𝑡𝑜 about
50𝐾𝐽 𝑚𝑜𝑙⁄ in the case of azobenzene molecule. It is thermally unstable comparing with
trans[33]. Once the azobenzene molecule is in the cis isomer 𝑆𝑐𝑜, the cis isomer has a probability to thermally relax to the trans isomer 𝑆𝑐𝑜⟶ 𝑆𝑡𝑜, or the cis isomer is raised to electronic excited state 𝑆𝑐𝑜⟶ 𝑆𝑐1 through absorbing a photon and then it isomerizes to the trans isomer 𝑆𝑐1 ⟶ 𝑆𝑡𝑜. A macroscopic displacement effect (similar to that used by caterpillar to move), will be accumulated after several trans-cis-trans cycles. A simple two level model of azobenzene molecule is exhibited in Fig. (1-9). However, the actual isomerization cycle is a complex process. It may be referred to a higher single state[34][35] or even triplet state. Up to now, the isomerization mechanism is not very clearly. So the two level model in here just exhibits an intuitive understanding.
e
cis
e
trans
trans(E)
cis(Z)
g
S
to
S
t1
S
co
S
co
50KJ/mol
C 1 c C11.3.3 PMMA-DR1 polymer
Fig. 1-9: (a) DR1 molecules grafted onto a PMMA backbone. (b) the typical absorption spectrum of PMMA-DR1. It defines the range of use of DR1 molecule probe, that is, from 400nm to 600nm. Blue spectrum: DR1 in solution; red spectrum: PMMA-DR1 thin film. The probe used in our experiment is a copolymer called PMMA-DR1 polymer. It corresponds to DR1 molecules covalently grafted onto a side chain of PMMA backbone, as shown in Fig. (1-9) (a) [36]. The polymer matrix allows for matter manipulation: magnifying the topography deformation resulted by DR1 molecule motion. Such a side chain polymer has stable orientation of azobenzene chromophore and higher glass transition temperature due to relative strong covalent interaction between azobenzene chromophore and polymer matrix. This important property enable to keep the topography induced by DR1 molecules for a long time at room temperation, providing the chance for AFM measurement. On the other hands, it has more freedom space for the azobenzene chromophore to be oriented by the polarized light, it is because only one end of chromophore is bounded to the polymer backbone, that is why DR1 molecules have vectorial transport nature, opening up new avenues for truly understanding the governing processes of field formation and dynamic evolution in three dimentions in the condensed phase (several example will be shown below). Additionally, in PMMA-DR1 polymer, the donor and acceptor arrangment provides a large dipole, which leads to a fast isomerization rate. So PMMA-DR1 polymer is a good photoisomerization material in sensitivity and stability aspects. Fig. (1-9) (b) shows the typical absorption spectrum of PMMA-DR1. This spectrum defines the range of use of DR1 molecule probe, that is, from 400nm to 600nm. However, this spectrum range limits our method: at present, only resonances in the green spectral region are utilized[37]. One of works in this PHD thesis is to break the spectral limitation by using two-photon absorption, it realizes the study of surface plasmon in near infrared.
1.3.4 Underlying mechanism of PMMA-DR1 polymer
When an isotropic azobenzene polymer film is exposed to linearly polarized light within the absorption spectrum of azobenzene molecule grafted on the polymer matrix, these azobenzene molecules can isomerize like isolate azobenzene molecules, they pull and push the polymer backbone along the direction of polarization leaving a hole in electromagnetic enhancement area. In addition to this topographical deformation of the polymer film, such repeated photoisomerization cycles give rise to the anisotropic alignment of azobenzene molecules in a direction perpendicular to the electric polarization of the incident light [38][39]. The resulting anisotropically aligned azobenzene lead to the birefringence of the overall film, which is evidenced by the gradual increase in the dichroic ratio of azobenzene polymer under light irradiation[40]. In order to understand the photofluidic motion of azobenzene polymer[41]. A photoinduced molecular diffusion model (or PIMD model)[42]–[44] has been developed in our group. It uses a part of the inchworm translation model and is based on fundamental molecular dipole-light interaction as well as stochastic approach through a Monte-Carlo method. This multiscale model is based on three fundamental hypotheses concerning the displacement of the azobenzene molecules: i) Each dye molecule must absorb a photon to undergo an isomerization. The absorption probability is given by Pabs ∝ |μ ∙ E|2∝ |E|2cos2φ, with φ being the angle between the direction of the local incident field E, and unit transition dipole moment, μ. ii) The resulting motion of a dye molecule occurs along the axis of the molecule (identified as the direction of the molecular dipole), as described by the inchworm translation model proposed by Lefin et al [45]. iii) A dye molecule jumps from a hole in the polymer matrix to another hole. The hole concept is defined between two limiting values of the local density of the polymer film. If the local density is higher (lower) than a certain value dℎ𝑖𝑔ℎ(d𝑙𝑜𝑤), the translation process is impossible. We assume that the probability distribution is defined by a Lorentzian function of the local density. Then, a molecule is only allowed to move to a new position according to a joint probability PA→B= PA× PB formed from a probability for it to leave its current position PA and one for it to occupy the new position PB. Several additional hypotheses are taken into account concerning the nature of the polymer matrix and the forces experienced by the azobenzene molecules. (iv) Short-range interactions (e.g., van der Waals interactions) are accounted for with a random reorientation of the nearest neighbors in the direction of the moving molecule. (v) Long-range interactions of azobenzene molecules on the same chain are accounted for as follows. Each time an azobenzene group moves, a random set of n molecules grafted in the same polymer chain, within a sphere of radius R, is selected. These molecules are then randomly reoriented in the direction of the moving molecule. The grafting density is correlated with n, and the polymer chain length and radius of gyration are correlated with R.
direction, the probability of the photoisomerization will be up to the maximum, while the azobenzene remains inert to the local field at =90°. As long as there is the dipole moment component lying along the polarization direction after the isomerization cycle, the azobenzene will not stop the isomerization cycle until it becomes aligned in a position where its dipole moment is perpendicular to the polarization direction. Once the azobenzene molecule is excited and pumped from trans isomer to cis isomer, the thermal isomerization from the cis to trans may occurs; as a result, trans azobenzene molecules orient in any direction. The direction of trans isomer is thus random after a thermal relaxation. In other words, the isomerization process also is random when the azobenzene undergoes a thermal relaxation.
The azobenzene molecule system will reach a photostationary state at the end of isomerization accompanying a net alignment of azobenzene molecules perpendicular to the polarization direction of the light within the irradiated region of the film. The birefringence phenomenon is from the excess number of azobenzene molecule. The balance will be broken in the trans isomer and cis isomer system after switching off the light. The aligned azobenzene molecules will tend to return to the random arrangement, the others maintain alignment under the suppression of the local circumstantial conditions of the polymer film as well as the experiment conditions, which can be kept for a longtime in room temperature. Therefore, the system reaches a new equilibrium. The deformation of azobenzene polymer is stable. There are two methods to recover the initial isotropy of azobenzene film. The first one consists in heating the film above the glass transition temperature 𝑇𝑔, which will activate all azobenzene molecules in the film. The second one is to irradiating the film with a circularly polarized light, which will only activate these azobenzene molecules in the irradiated area. So the birefringence phenomenon disappears after erasing process. Thus, the sample covering by polymer can be repeatedly used to image different electromagnetic field.
1.3.5 Physical factors affecting the isomerization of azobenzene
polymer
Irradiation light is the very important factor affecting the isomerization of polymer film, in which both wavelength and intensity decide the isomerization process[46]. As mentioned above, the azobenzene molecule isomerizes from trans isomer to cis isomer after absorbing a photon. A reversible process is activated by a photon absorption, so the wavelength dominate the isomerization. The rate of isomerization will reach a maximum level when the wavelength at the absorption peak is selected, however, the peak of wavelength may be not exactly selected according to actual need. A high intensity of irradiation light accelerates the rate of isomerization while a low intensity takes a long time to reach photostationary state, but one point must be emphasized here that excessive high intensity will damage the activate azobenzene molecules. Wavelength and
So to choose a suitable wavelength and intensity is much important to increase the efficiency of isomerization and relaxation.
As mentioned above, one method recovering the isotropy of azobenzene polymer film is to heat the film above the glass transition temperature 𝑇𝑔, therefore operating temperature is other important factor to regulate the thermal relaxation and isomerization rate[46][47]. In a dynamic system molecules vibrate strongly at a high temperature, so as the azobenzene polymer film, the thermal effect not only increase the azobenzene molecule vibration but also the main chain, resulting in a disorder state in which azobenzene molecule restore their isotropic distribution.
The penetration depth of irradiation light and the optical path difference between two sites in polymer film are another factor affecting the isomerization process, which relates to the film thickness. For a thin film compared with the penetration depth, the net number of aligned azobenzene molecule increases linearly with the thickness of the film. On the other hands, for a thick film, the isomerization does not reach the opposite side of incidence, in fact, when the thickness exceeds 4 𝑎⁄ (a is the absorption linear coefficient of the film), these azobenzene molecules do not participate the isomerization in the excess thick film. The optical difference results in the phase retardation of irradiation light. The difference of phase leads to a nonlinearly distribution of light intensity within the film, which affects the uniformity of isomerization. In addition, the viscosity and the physical state of polymer all influent the isomerization. Therefore, the isomerization of azobenzene polymer is a complex process. A good control of these numerous affecting factors is thus of importance.
1.3.6 Vectorial transport of polymer based on Single-photon
absorption
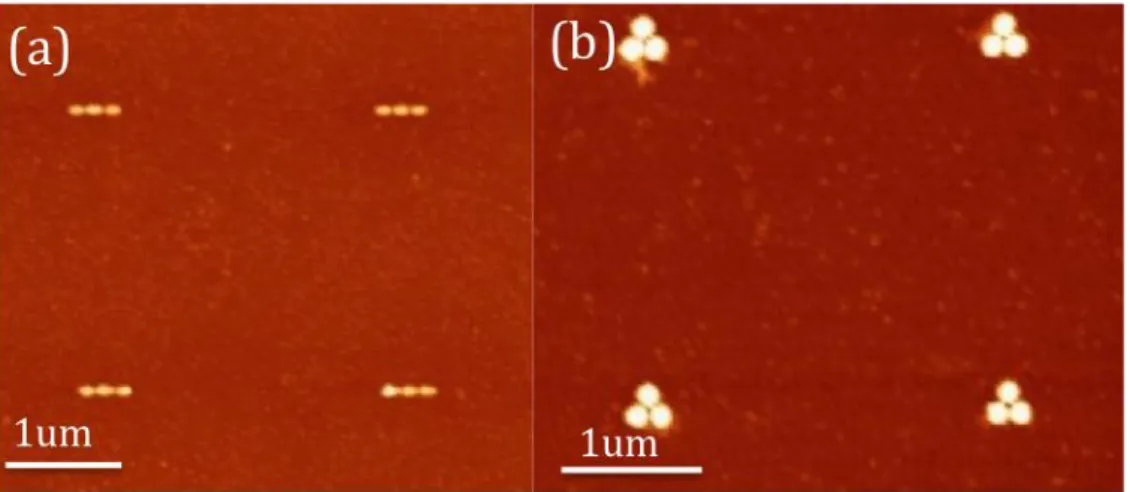
Fig. (1-10) shows examples of imaging plasmonic nanostructures in subwavelength spatial dimenshion through this photochemical imaging method. Fig. (1-10) (a) shows the AFM image of hemispherical silver nanoparticles covering by PMMA-DR1 before exposure(top) and after exposure by circularly polarized light at normal incidence(dwon). This illustrates the unique capability of azobenzene nanomotors to nanostructure matter using a remote optical input.
Fig.1-10: Examples of azobenzene nanomotor imaging of plasmonic nanostructures[48]. (a) Hemispherical silver nanoparticles made by e-beam lithography. (Top) AFM image of the structure covered with PMMA-DR1. (Inset) SEM image of the structures. (Bottom) The same zone after a 10 min illumination using circularly polarized light at normal incidence. (b) Silver bowtie nanoantenna. (Top) AFM images of such structures taken before laser illumination. (Inset) SEM image. (Bottom) AFM images of the same structure after illumination (λ = 514 nm, polarization perpendicular to the bowtie axis). (c) Gold nanocube with 60nm on side obtained by colloidal chemistry. (Top) AFM image of the structure covered with PMMA-DR1. (Inset) TEM Image. (Bottom) AFM images of the same structure after illumination. (Inset) Zoom of the differential AFM image obtained by subtracting the image taken before exposure from the image taken after exposure. The cube was covered with a sub-10 nm thick PMMA-DR1 film. [49][50] [51]
The case of Fig. (1-10)(b) highlights the optically induced vectorial molecular mass transport of the light-sensitive polymer.[50] Silver bowtie nanoantenna (see the SEM image in the inset) have been imaged using linearly polarized light perpendicular to the antenna axis. The interaction between light and such a complex object is characterized by a strong in-plane → out-of plane depolarization, field confinement and enhancement, and coupling effects. Precise analysis of such images can lead to valuable information. In particular, it was found that longitudinally polarized plasmons (perpendicular to bowtie plane) are confined at the top of the metallic bowtie acting as an optical cavity for propagating surface plasmons. Furthermore, the intricate optical near fields in the polymer led to molecular trapping regions at intensity minima in the vicinity vicinity of the antenna. The experimental and theoretical results clearly showed that this method
can map the three spatial components of the optical near field of complex metal nanostructures[50].
Fig. (1-10)(c) illustrates an ultimate use of the method[51]. Extremely confined longitudinal fields were characterized at the surface of gold nanocubes at different localizations. As an illustration, The bottom inset image is a differential AFM image. It highlights the optically induced molecular displacement regardless of the initial topography. In this case, the in-plane incident polarization was parallel to a cube ridge, and the contrast revealed the longitudinally polarized near-field dipolar emission oriented along the incident polarization direction. The bottom inset of Fig. (1-10)(c) also shows confined dark zones as a signature of electromagnetic cold spots. Both hot spots and cold spots were precisely studied as a function of cube orientation relative to the incident field direction. The concept of a cold spot complements the well-known electromagnetic hot spot but produces even more confined regions without charge density variations. Thus, ultraconfined cold spots offer a new route to high-resolution imaging and spectroscopy. The approach of photoactivated azobenzene nanomotors enabled the first clear observation and investigation of electromagnetic near-field cold spots.
The thickness of the deposited polymer film is a crucial parameter; it imposes the effective field depth that is investigated through molecular displacement. In the case of Fig. (1-10) (a) and (b), the typical thickness was in the 50−100 nm range. Over this depth, photons within the evanescent field and Fresnel zone are responsible for molecular motion. The Fresnel zone is an intermediate zone corresponding to observation planes where evanescent and confined propagating waves are present that will be detected in the far field after propagation (Fraunhoffer diffraction). In this region, it is possible to find a λ/2n-confined optical pattern. In order to detect a pure near field where evanescent waves dominate, the polymer thickness must be reduced. This was successfully performed and is shown in Fig. (1-10) (c); a sub-10 nm thick film of azobenzene-containing polymer was used for ultrahigh-resolution near-field imaging of colloidal gold nanocubes.14 We analyzed the confinement of both electromagnetic hot and “cold” spots with a resolution of λ/35 and emphasized the particularly high spatial confinement of cold spots. In this thesis, thinner films based on two-phototn absorption will be required to study plasmonic oligomer.
1.4 Summary
In the first section of this chapter, the optical behaviors of surface plasmon in metal nanoparticle have been reminded and discussed based on the Drude and Drude-Lorentz. Models. When surface plasmons are excited by the incident light, the electric field near the surface of nanoparticle is enhanced and decays along the direction away from surface. The surface plasmon resonance depends on many factors. The surface plasmon experience both radiative and non-radiative processes that lead to the damping of
disturb the coherently oscillation of electrons because of dephasing effect. The shape has a big influence to the resonance wavelength. Especially, when one axis of nanoparticle becomes more elongated, the extinction spectrum splits into two bands, which exhibits two major surface plasmon peaks along the transverse direction and the longitudinal direction, respectively. The dielectric properties of both the metal nanoparticle and the surrounding media are other important factors tuning the resonance peak.
In the second section, we have introduced the pseudo-stilbene type azobenzene molecule, DR1. The PMMA-DR1 polymer containing side-chain azobenzene chromophores are more competitive, such as a higher thermal and long-term orientational stability, which result in much more free to respond the polarized light for DR1 molecule and have good photochemical orientability of dipole moment. The underlying mechanism of the light induced mass transport process was also discussed based on PIMD model. Several physical factors that affect the mass transport of azobenzene polymers were also considered in this section. Finally, several examples of topographical deformation induced by single photon were presented. In this thesis, we will use two-photon absorption of polymer to imaging near field.
This chapter will help us to introduce the following chapters and to discuss and analyze the experimental results. The photochemical near-field imaging method based on azobenzene photoisomerization will be described in chapter 2. [46]

![Fig. 1-5: Typical UV-visible spectra of Ag, Au and Cu nanoparticles. The prevalently spherical shape and size on the order 2-40nm originate a single sharp plasmon absorption at distinctive wavelengths for each metal[28]](https://thumb-eu.123doks.com/thumbv2/123doknet/14528702.723243/25.892.182.686.179.567/typical-nanoparticles-prevalently-spherical-originate-absorption-distinctive-wavelengths.webp)
![Fig. 2-2: Metal lift off using positive resist a) and dried etching using negative resist b) in electron beam lithography[5]](https://thumb-eu.123doks.com/thumbv2/123doknet/14528702.723243/42.892.147.720.170.612/metal-positive-resist-etching-negative-resist-electron-lithography.webp)