SCIENTIFIC ARTICLE
Lactate and
T
2
measurements of synovial aspirates
at 1.5 T: differentiation of septic from non-septic arthritis
Edzard Wiener&Marco Zanetti&Juerg Hodler&Christian W. A. Pfirrmann
Received: 22 February 2008 / Revised: 9 April 2008 / Accepted: 10 April 2008 / Published online: 4 June 2008 # ISS 2008
Abstract
Objective The aim of this study was to differentiate septic from non-septic arthritis by measuring lactate concentration with1H magnetic resonance spectroscopy (HMRS) and by estimating total protein content with the assessment of T2 values.
Materials and methods In 30 patients with acute arthritis, synovial fluid was aspirated. Lactate concentrations were analyzed with single voxel HMRS at 1.5 T. T2 relaxation times were mapped with a multi-spin echo sequence. All samples underwent microbiological testing and routine laboratory analysis to quantify lactate concentration and total protein content. Values obtained in septic and non-septic arthritis were compared with a Mann–Whitney U test.
Results Synovial fluid from patients with septic arthritis (n= 10) had higher concentrations of lactate (11.4±4.0 mmol/L) and higher total protein content (51.8±10.7 g/L) than fluid obtained in non-septic arthritis (n=20; 5.2±1.1 mmol/L and 40.4±6.9 g/L, respectively, p<0.001 and <0.01, respective-ly). Measured lactate concentrations and T2relaxation times (as an indicator of total protein content) were moderately correlated to laboratory-confirmed lactate concentration (r2= 0.71) and total protein content (r2=0.73). Markedly in-creased lactate concentrations (>6 mmol/L) in combination with low T2values (<550 ms) identify septic arthritis with a sensitivity of 70% and a specificity of 89%.
Conclusion Spectroscopic measurements of lactate concen-tration in combination with the estimation of protein content using T2may be of value in the differentiation of septic from non-septic arthritis.
Keywords Septic arthritis .
Magnetic resonance spectroscopy . T2relaxation time . Lactate . Total protein
Introduction
Early diagnosis of septic arthritis is crucial. Untreated disease causes joint destruction [1] and may even lead to death [2].
Radiographic findings in septic arthritis including osteo-penia and bone erosions are not present during the initial disease phase. MRI may become abnormal as early as 24 h after the onset of joint infection [3]. In advanced disease stages, it demonstrates the extent of osseous, chondral, and soft tissue involvement [4–6]. However, MR findings are commonly non-specific. Sometimes aspiration cultures can be false negative [7,8].
Gas liquid chromatography from synovial fluid samples has been used to rapidly distinguish septic from non-septic arthritis on the basis of increased lactate concentrations which is a result of increased glycolysis and fermentation [9]. It is possible to measure lactate concentrations using single voxel1H magnetic resonance spectroscopy (HMRS) on a clinical MR unit which can potentially be used for the diagnosis of septic arthritis.
Diffusion-weighted imaging and T2mapping have been used to distinguish purulent from serous fluid based on differences on water content and viscosity [10,11]. As the number of macromolecules increases, the free water
E. Wiener (*)
:
M. Zanetti:
J. Hodler:
C. W. A. PfirrmannDepartment of Radiology,
Orthopedic University Hospital Balgrist, Forchstrasse 340,
CH-8008 Zurich, Switzerland e-mail: edzard.wiener@balgrist.ch
fraction decreases with the effect of restricted water diffusion and shortened relaxation times.
The purpose of this investigation was to differentiate septic from non-septic arthritis by measuring lactate concentration with HMRS and by estimating total protein content with the assessment of T2values.
Materials and methods Synovial fluid collection
Thirty joints (15 knees, 13 hips, two glenohumeral joints) in 30 patients were aspirated under fluoroscopic guidance during a 36-month period (July 1, 2004, through June 30, 2007). All patients were referred consecutively by orthopedic surgeons at our institution. Limited range of motion associated with unremitting pain of recent onset, increased skin temperature, swelling, diffuse tenderness about the joint, and effusion were the clinical findings of suspected septic arthritis.
Patients in which less than 10 mL of joint fluid was aspirated were not included in the study. All chemical analyses were performed in the same laboratory.
Samples were obtained before antibiotic therapy. The mean age of the patients was 58 years (age range, 47– 73 years; 14 men, 16 women). The aspirated synovial fluid was divided into two portions. One portion was sent to microbiology and cultured immediately. Approximately 10 mL was frozen at −20°C until evaluated. To reduce metabolic changes that can occur ex vivo [12], the period between synovial aspirate removal and freezing was no longer than 15 min. Later, MR spectroscopy of the samples was performed after thawing at room temperature. Lactate concentration and total protein content were measured by the department of clinical chemistry.
This investigation was approved by the institutional review board and complies with the laws applicable at our institution. HMRS
HMRS was performed with a 1.5-T system (Symphony; Siemens Medical Solutions, Erlangen, Germany). Three tubes, two containing 10 mL of synovial aspirate and one containing 10 mL of 28 mmol/L standard Ringer’s lactate solution (external standard), were placed on top of a water phantom in a dedicated circularly polarized send–receive extremity coil. Single voxel volume selective water-suppressed spin echo HMRS was performed (repetition time 1,500 ms, echo time 135 ms, 320 signals averaged) for each sample. Metabolites with short T2values, including lipids that overlap with lactate are suppressed with the long echo time. Furthermore, the echo time of 135 ms inverts the resonance peaks of the lactate doublet at 1.3 ppm due to J coupling, whereas
resonances from lipids do not invert because of uncoupled spins. A voxel of 15×15×30 mm was positioned along the long axis of the tubes. An automated local three-dimensional shimming procedure and the proton MR spectroscopic sequence were launched with a single command. Imaging time was 8 min and 6 s for data acquisition alone and 8 min and 56 s if the automated shimming procedure was included. The lactate peak was identified based on its position at 1.33 ppm and by the phase reversal at 135 ms echo time. Reproducibility was assessed by processing 30 repeat examinations of the standard solution.
T2measurements
T2quantification was performed after spectroscopy with a 1.5-T system (Espree; Siemens Medical Solutions, Erlangen, Germany). The same three tubes as described above were placed on top of a water phantom in the head coil. T2 was determined using a multi-spin echo sequence with 32 spin echoes. Three images were obtained in the transverse plane (repetition time 1,000 ms, echo times 12 to 650 ms, section thickness 10 mm, field of view 150×150 mm). Imaging time was 7 min and 30 s. Reproducibility was assessed by processing 30 repeat examinations of the standard solution. Data analysis
After Gaussian filtering, free induction decay was zero-filled to 4,000 data points, and an exponential multiplication was applied before Fourier transformation. Baseline correction and zero-order phase correction of all spectra was performed before quantification. For curve fitting, the proprietary software of the spectroscopic package of the MR imager was used. The area under the lactate peaks (integral intensity) of the synovial aspirate and the standard solution were calculated. Lactate concentration in the synovial aspirate was determined as follows: lactate concentration = area under the lactate peak of the punctate/area under the lactate peak of the external standard solution × 28 mmol/L.
T2images were calculated from the 32 echoes using the proprietary software of the parameter mapping package of the magnet. A region of interest covering about 350 pixels was placed in the center of the tubes. The mean values and standard deviation were calculated.
Statistical analysis
The lactate concentration and total protein content in the synovial aspirate of patients with culture positive septic arthritis and non-specific inflammation were compared using the Mann–Whitney U test (two-tailed). p values< 0.05 were considered to be statistically significant. HMRS data were correlated to the laboratory-confirmed lactate
concentrations. T2 relaxation times were correlated to the total protein content. The Spearman correlation coefficient was employed for analysis of correlation. Sensitivity, specificity, positive predictive value and negative predictive value, and accuracy were calculated to assess the diagnostic performance of MR parameters in differentiating septic and non-septic arthritis. The following thresholds were used for this evaluation: T2<550 ms and lactate concentration> 6 mmol/L. For statistical analyses, the SPSS software (version 11.0; SPSS, Chicago, IL, USA) was used.
Results
Bacteriological and chemical data
Bacteriological and chemical data are summarized in Table 1. Ten of the 30 patients had septic arthritis (n=9 Staphylococcus aureus and n=1 Streptococcus).
Applicability and reproducibility of MR parameters Twenty-nine of 30 MR spectra were of acceptable quality. Figure 1 demonstrates the results for the 28 mmol/L standard solution (a), non-septic arthritis (b), and septic arthritis (c). The mean value ± SD of the 30 repeat examinations of the standard solution were 1,579±72 ms for T2 and 65±8 for the integral intensity of the lactate peak.
Comparison of the chemical and the MR parameters The chemical parameters of samples from septic arthritis and non-septic arthritis were clearly different (Table 1). In non-septic arthritis, the mean ± SD was 5.2±1.1 mmol/L for the lactate concentration and 40.4±6.9 g/L for total protein content. In septic arthritis, the corresponding values were 11.4 ± 4.0 mmol/L (p < 0.001) and 51.8 ± 10.7 g/L (p<0.01).
Table 1 Clinical information, chemical parameters, and MR parameters in 30 patients with clinical picture of joint infection
Arthritis Joints Specific
microorganisms isolated Lactate concentration (mmol/L) Total protein content (g/L) MRS lactate concentrationa(mmol/L) T2relaxation time (ms) Septic (n=10) Knee (n=5) Staphylococcus (n=9) 11.4±4.0 (8.1–20.8) 51.8±10.7 (34.0–65.0) 10.9±7.6 (4.2–31.2) 488±112 (307–754) Hip (n=4) Streptococcus (n=1) Shoulder (n=1) Non-septic (n=20) Knee (n=10) – 5.2±1.1 (3.7–7.5) 40.4±6.9 (30.0–57.0) 5.1±2.1 (2.2–12.0) 663±116 (443–842) Hip (n=9) Shoulder (n=1)
Data are mean values ± SD. Range is enclosed in parenthesis.
a
Data are obtained from1H MR spectroscopy at 1.5 T in relation to 28 mmol/L lactate solution.
Fig. 1 Comparison of ex vivo proton MR spin echo spectra (1,500/ 135) obtained at 1.5 T from external standard solution and different synovial fluid samples. The signal resonance of Lac at 1.33 ppm is present in all spectra. For a better illustration, the spectra are inverted. The signal of Lac shows phase reversal that is suggestive of J
coupling. a Spectrum of the external standard Lac solution, b spectra of non-specific inflammatory arthritis, and c spectrum of culture positive septic arthritis (Staphylococcus aureus). The integral intensity is annotated above the peak
Similar differences were observed for the MR parameters (Table 1). The mean lactate concentration in non-septic arthritis was 5.1±2.1 mmol/L. The mean T2value was 663± 116 ms. In septic arthritis, the mean lactate concentration was 10.9±7.6 mmol/L (p<0.003). The mean T2 value was 488±112 ms (p<0.01).
Correlation of the chemical and MR parameters
The relationship between chemical parameters (lactate concentration, total protein content) and the MR parameters (lactate concentration, T2 relaxation time) are shown in Figs.2and3. The chemical and MR lactate concentrations
r2 = 0,705 0.0 5.0 10.0 15.0 20.0 25.0 30.0 0.0 5.0 10.0 15.0 20.0 25.0 30.0
Lactate [mmol/L] spectroscopy
Lactate [mmol/L] laboratory
Fig. 2 Lactate concentration quantified by proton MR spectroscopy plotted against laboratory-confirmed lactate concentration (r2=0.705,
p<0.001) r2 = 0,733 10.0 20.0 30.0 40.0 50.0 60.0 70.0 80.0 90.0 100.0 200 300 400 500 600 700 800 900 T2 [ms] total protein [g/L]
demonstrated a fair correlation (r2=0.71, p<0.001). Simi-larly, the T2relaxation time correlated with the total protein content (r2=0.73, p<0.001).
Diagnostic performance of MR parameters to differentiate septic from non-septic arthritis
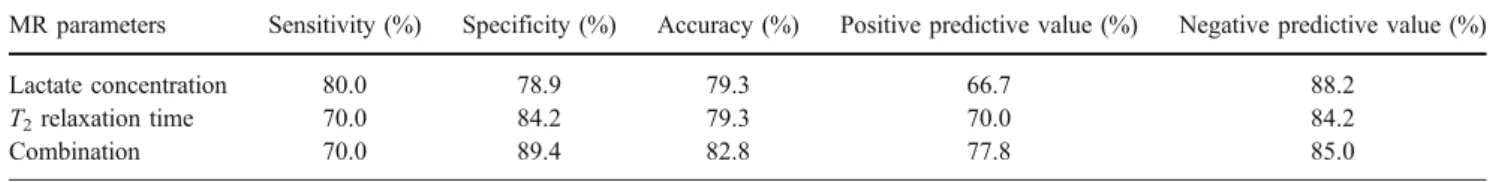
The diagnostic performance of MR imaging is demonstrated in Fig.4and Table2. Lactate concentrations above the threshold of 6 mmol/L had a sensitivity of 80% and a specificity of 79%. T2relaxation time <550 ms had a sensitivity of 70% and a specificity of 84%. When both criteria were required, sensitivity was 70% and specificity 89%.
Discussion
In agreement with the data obtained by chemical analysis of joint fluids [13], we observed significantly higher lactate
levels with single voxel proton MR spectroscopy in septic than in non-septic joint inflammation. Similar lactate concentrations have previously only been described in active rheumatoid arthritis [13, 14]. However, septic arthritis is characterized by a purulent effusion. The T2 relaxation time of purulent fluid is significantly lower than those of other fluids [10]. This favors the use of a combined measurement.
The correlation between spectroscopic and laboratory-confirmed lactate concentration is not perfect (r2= 0.71) which is explained by MRS measurement errors at 1.5 T. Therefore, the sensitivity is only moderate. These diffi-culties can be overcome using higher field strengths. The diagnostic performance could be further increased by additional quantitative MR measurements like diffusion [11] and perfusion imaging [15]. Furthermore, morpho-logic MR findings like bone erosions, marrow edema, and soft tissue enhancement should always be considered [5,16]. 0 5 10 15 20 25 30 200 300 400 500 600 700 800 900 T2 [ms]
Lactate [mmol/L] spectroscopy
non-septic arthritis septic arthritis
Fig. 4 T2 relaxation time plotted against lactate concentration
quantified by proton MR spectroscopy. Most of the cases from culture positive septic arthritis (filled circles) are located in the upper left
quadrant, corresponding to T2 values <550 ms and lactate
concen-trations >6 mmol/L, in contrast to the cases from non-septic arthritis (filled squares), which are mostly located in the right lower quadrant
Table 2 Diagnostic performance of lactate concentration and T2relaxation time to differentiate between a septic and a non-septic effusion
MR parameters Sensitivity (%) Specificity (%) Accuracy (%) Positive predictive value (%) Negative predictive value (%)
Lactate concentration 80.0 78.9 79.3 66.7 88.2
T2relaxation time 70.0 84.2 79.3 70.0 84.2
Combination 70.0 89.4 82.8 77.8 85.0
Our model with an external standard solution is only an approximation because the relaxation effects of lactate are mediated by macromolecules which were neglected. There is also signal cancellation by anomalous J modulation for coupled resonances that arise from chemical shift displace-ment [17,18]. Higher field strength improves the quality of the spectra with a more accurate quantification of the lactate concentrations. Furthermore, at higher field strength other resonances from cartilage degradation products can poten-tially be observed in addition to lactate, to demonstrate the presence of a joint infection [19].
The quantification of T2 values seems to be useful to characterize joint fluids with differences in viscosity. We observed a moderate correlation between the T2relaxation time and the total protein content (r2= 0.73). T2 is determined primarily by diffusion exchange of water between the bound and free states [10]. In comparison to serous fluids, purulent fluids have increased protein con-tents and bound water fractions, leading to a reduction in T2. Reactive joint fluid differs from purulent effusions with regard to water diffusion state [11]. However, since an overlap in T2 between purulent fluid and hematoma has been demonstrated [10], the clinical history has to be taken into consideration.
Although this study measures lactate concentration and T2 values in samples of joint aspirates ex vivo, the same measurements may be applicable in vivo. To provide an early diagnosis of septic arthritis is clinically highly relevant. In case of positive MRS and T2 results, a joint aspiration should be performed in the next step to determine the causative bacteria and antibiotic resistance.
At 1.5 T, a large amount of joint effusion would be necessary for an adequate voxel positioning in the joint cavity to avoid voxel contamination from adjoining tissue. The presented data were obtained from a 1.5×1.5×3-cm3 voxel. Higher field strengths may be required to quantify the lactate concentrations more precisely and within a smaller amount of joint effusion.
A limitation of this study is the small sample size of patients with septic arthritis. Furthermore, we did not have the final diagnosis for all patients with non-septic arthritis which could impact the mean values of the lactate concentration of this cohort.
In conclusion, spectroscopic measurements of lactate concentration in combination with the estimation of protein content using T2 may be of value in the differentiation of septic from non-septic arthritis.
References
1. Weston VC, Jones AC, Bradbury N, Fawthrop F, Doherty M. Clinical features and outcome of septic arthritis in a single UK
Health District 1982–1991. Ann Rheum Dis 1999; 58 4: 214–219.
2. Gupta MN, Sturrock RD, Field M. A prospective 2-year study of 75 patients with adult-onset septic arthritis. Rheumatology
(Oxford) 2001; 40 1: 24–30.
3. Sandrasegaran K, Saifuddin A, Coral A, Butt WP. Magnetic resonance imaging of septic sacroiliitis. Skeletal Radiol 1994; 23 4: 289–292.
4. Bancroft LW. MR imaging of infectious processes of the knee.
Radiol Clin North Am 2007; 45 6: 931–941.
5. Graif M, Schweitzer ME, Deely D, Matteucci T. The septic versus nonseptic inflamed joint: MRI characteristics. Skeletal Radiol
1999; 28 11: 616–620.
6. Hopkins KL, Li KC, Bergman G. Gadolinium-DTPA-enhanced magnetic resonance imaging of musculoskeletal infectious
pro-cesses. Skeletal Radiol 1995; 24 5: 325–330.
7. Mathews CJ, Kingsley G, Field M, et al. Management of septic
arthritis: a systematic review. Ann Rheum Dis 2007; 66 4: 440–445.
8. Spangehl MJ, Younger AS, Masri BA, Duncan CP. Diagnosis of infection following total hip arthroplasty. Instr Course Lect 1998;
47: 285–295.
9. Grand S, Passaro G, Ziegler A, et al. Necrotic tumor versus brain abscess: importance of amino acids detected at 1H MR spectroscopy— initial results. Radiology 1999; 213 3: 785–793.
10. Brown JJ, vanSonnenberg E, Gerber KH, Strich G, Wittich GR, Slutsky RA. Magnetic resonance relaxation times of percutaneously obtained normal and abnormal body fluids. Radiology 1985; 154 3:
727–731.
11. Park JK, Kim BS, Choi G, Kim SH, Lee KB, Khang H. Distinction of reactive joint fluid from pyogenic abscess by diffusion-weighted
imaging. J Magn Reson Imaging 2007; 25 4: 859–861.
12. Remy C, Grand S, Lai ES, et al. 1H MRS of human brain abscesses in
vivo and in vitro. Magn Reson Med 1995; 34 4: 508–514.
13. Riordan T, Doyle D, Tabaqchali S. Synovial fluid lactic acid measurement in the diagnosis and management of septic arthritis.
J Clin Pathol 1982; 35 4: 390–394.
14. Ciurtin C, Cojocaru VM, Miron IM, et al. Correlation between different components of synovial fluid and pathogenesis of
rheumatic diseases. Rom J Intern Med 2006; 44 2: 171–181.
15. Kwack KS, Cho JH, Lee JH, Cho JH, Oh KK, Kim SY. Septic arthritis versus transient synovitis of the hip: gadolinium-enhanced MRI finding of decreased perfusion at the femoral epiphysis. AJR Am J Roentgenol 2007; 189 2: 437–445. 16. Yang WJ, Im SA, Lim GY, et al. MR imaging of transient
synovitis: differentiation from septic arthritis. Pediatr Radiol 2006;
36 11: 1154–1158.
17. Kelley DA, Wald LL, Star-Lack JM. Lactate detection at 3T: compensating J coupling effects with BASING. J Magn Reson Imaging 1999; 9 5: 732–737.
18. Yablonskiy DA, Neil JJ, Raichle ME, Ackerman JJ. Homonuclear J coupling effects in volume localized NMR spectroscopy: pitfalls
and solutions. Magn Reson Med 1998; 39 2: 169–178.
19. Schiller J, Naji L, Huster D, Kaufmann J, Arnold K. 1H and 13C HR-MAS NMR investigations on native and enzymatically

![Fig. 2 Lactate concentration quantified by proton MR spectroscopy plotted against laboratory-confirmed lactate concentration (r 2 =0.705, p<0.001) r2 = 0,733 10.020.030.040.050.060.070.080.090.0100.0 200 300 400 500 600 700 800 900 T 2 [ms]total protei](https://thumb-eu.123doks.com/thumbv2/123doknet/14866088.637534/4.892.87.816.81.467/lactate-concentration-quantified-spectroscopy-plotted-laboratory-confirmed-concentration.webp)