KLUWER/ESCOM
© 1999 Kluwer Academic Publishers. Printed in the Netherlands.
343
NMR structure of the chimeric hybrid duplex
r(gcaguggc)
·r(gcca)d(CTGC) comprising the tRNA-DNA junction formed
during initiation of HIV-1 reverse transcription
Thomas Szyperski
a,∗, Matthias Götte
b,∗∗, Martin Billeter
a,∗∗∗, Emanuele Perola
c, Luciano
Cellai
c, Hermann Heumann
b& Kurt Wüthrich
aaInstitut für Molekularbiologie und Biophysik, Eidgenössische Technische Hochschule Hönggerberg, CH-8093 Zürich, Switzerland;bMax-Planck-Institut für Biochemie, D-82152 Martinsried, Germany;cIstituto di Strutturis-tica Chimica, CNR, P.O. Box 10, I-00016 Monterotondo Stazione, Rome, Italy
Received 28 September 1998; Accepted 21 December 1998
Key words: AIDS, DYANA, HIV-1, NMR structure, ribonuclease H, RNA-DNA hybrid, torsion angle dynamics
Abstract
A high-quality NMR solution structure of the chimeric hybrid duplex r(gcaguggc)·r(gcca)d(CTGC) was deter-mined using the program DYANA with its recently implemented new module FOUND, which performs exhaustive conformational grid searches for dinucleotides. To ensure conservative data interpretation, the use of1H-1H lower distance limit constraints was avoided. The duplex comprises the tRNA–DNA junction formed during the initiation of HIV-1 reverse transcription. It forms an A-type double helix that exhibits distinct structural deviations from a standard A-conformation. In particular, the minor groove is remarkably narrow, and its width decreases from about 7.5 Å in the RNA/RNA stem to about 4.5 Å in the RNA/DNA segment. This is unexpected, since minor groove widths for A-RNA and RNA/DNA hybrid duplexes of∼11 Å and ∼8.5 Å, respectively, were previously reported. The present, new structure supports that reverse transcriptase-associated RNaseH specificity is related primarily to conformational adaptability of the nucleic acid in ‘induced-fit’-type interactions, rather than the minor groove width of a predominantly static nucleic acid duplex.
Introduction
Retroviral reverse transcriptases (RTs) are respon-sible for the conversion of the single-stranded (ss) genomic (+)RNA into double-stranded (ds) proviral DNA (Baltimore, 1970; Temin and Mizutani, 1970). An RT thus possesses DNA- and RNA-dependent DNA-polymerase activities, as well as a ribonucle-ase H (RNribonucle-aseH) activity which degrades the RNA template of DNA/RNA replication intermediates with
∗To whom correspondence should be addressed. Present address:
Department of Chemistry, State University of New York at Buffalo, 816 Natural Sciences Complex, Buffalo, NY 14260, U.S.A. E-mail: [email protected]
∗∗Present address: McGill University AIDS Centre, Lady Davis
Institute-Jewish General Hospital, Montr´eal, PQ, Canada H3T 1E2.
∗∗∗Present address: Biochemistry and Biophysics, Box 462,
Göte-borg University, SE 405 30 GöteGöte-borg, Sweden.
high specificity (Telenitsky and Goff, 1997). Like other retroviruses, human immunodeficiency virus type 1 (HIV-1) uses a cellular tRNA, i.e., tRNALys3, as a primer to initiate synthesis of (−)DNA (Marquet et al., 1995; Mak and Kleiman, 1997). The 30terminal octadecanucleotide segment of tRNALys3hybridizes with a complementary primer binding site (PBS) near the 50end of the genomic RNA to form an RNA/RNA duplex that serves as a substrate for the initiation of reverse transcription.
Although the RT-associated RNaseH domain is in principle also capable of degrading dsRNA (Blain and Goff, 1993; Hostomsky et al., 1994), the PBS and the tRNA primer remain intact during initiation of (−)DNA strand synthesis (Götte et al., 1995). Since the efficiency of nuclease action on dsRNA is very low, cleavages within the initially bound
RNA/RNA duplex are seen exclusively in stalled RT-tRNALys3/(+)RNA complexes (Götte et al., 1995). X-ray (Arnott et al., 1986; Horton et al., 1996) and NMR (Fedoroff et al., 1993; Lane et al., 1993) stud-ies revealed that DNA/RNA hybrid duplexes adopt heteromerous conformations, that are intermediate be-tween standard A and B double helices. Such hybrid duplexes are characterized by an intermediate minor groove width, and it has been proposed (Fedoroff et al., 1993; Lane et al., 1993) that the minor groove width is a major structural determinant for RNaseH specificity. In particular, a molecular model of an RNaseH–DNA/RNA hybrid complex derived from the NMR structure of a DNA/RNA hybrid and the X-ray crystal structure of Escherichia coli RNaseH, which is a structural homologue (Davies et al., 1991) of RT RNaseH, suggested that several crucial RT–duplex in-teractions cannot be formed as long as dsRNA presents a wide and shallow minor groove to the enzyme (Fedoroff et al., 1993).
At a later stage of reverse transcription, i.e., dur-ing synthesis of the so-called (+)-strand strong stop DNA, RT encounters the 30 end of the tRNA primer, which now serves as a template for synthesis of a DNA copy of the PBS (Telenitsky and Goff, 1997). A specific RNaseH cut, located one nucleotide up-stream of the DNA–tRNA junction, then removes the tRNA primer from the (−)DNA strand (Furfine et al., 1991; Smith et al., 1992). The NMR solution structure (Fedoroff et al., 1996) of the chimeric hybrid oc-tamer d(GCAGTGGC)·r(gcca)d(CTGC) (lower case and upper case letters are used to represent ribonu-cleotides and deoxyribonuribonu-cleotides, respectively), which includes the aforementioned DNA–tRNA junc-tion, seemed to provide further support for the hy-pothesis (Fedoroff et al., 1993, 1996, 1997; Lane et al., 1993; Salazar et al., 1994, 1996; Zhu et al., 1995; Horton et al., 1996; Han et al., 1997; Bache-lin et al., 1998) that tuning of the minor groove width of the free nucleic acid confers RNaseH speci-ficity. To obtain additional insight into the struc-tural features of oligonucleotide duplexes that gov-ern RNaseH specificity, we determined the NMR solution structure of the chimeric hybrid octamer r(gcaguggc)·r(gcca)d(CTGC) (Figure 1), which com-prises the tRNA–DNA junction formed during the ini-tiation of (−)DNA strand synthesis, and represents the first solution structure of a chimeric RNA/RNA–DNA hybrid duplex. 7.50 8.00 5.50 6.00 910 11 12 15 14 16 13 1 2 3 5 6 8 7 4 ω1(1H) [ppm] 5.5 6.0 7.2 ω2(1H) [ppm] 8.0 * * * 4.8Å 5.1Å 4.7Å 4.5Å 4.5Å 4.9Å 4.7Å 4.7Å 5.1Å 3.9Å
5’ g c a g uggc
CGTC accg 5’
1 8 16 9 4.3Å 3.8Å H1’-15/H2-3 H1’-6/H2-12Figure 1. Spectral region of a 2D [1H,1H]-NOESY spectrum of r(gcaguggc)·r(gcca)d(CTGC) comprising the ω1(H10)/ω2(H6,H8) connectivities. The spectrum was recorded withτm = 33 ms at a1H resonance frequency of 750 MHz (T= 25◦C, duplex con-centration 1.5 mM solution, D2O buffer: 100 mM NaCl, 20 mM Na+-phosphate, 1 mM EDTA, pD 7.0). The chemical shift positions of the base protons in the individual nucleotides are given at the top, and connectivities are indicated with arrows (red: RNA strand; green: chimeric strand). The numbering of the nucleotides is given in the lower left part, and1H-1H upper distance limit constraints for sequential connectivities are indicated near the corresponding cross peaks. The high accuracy of these input constraints is evidenced by the fact that the actual distances in the 20 energy-refined DYANA conformers (Table 1) are all shorter than these values within a range of 0.5 Å. Two interstrand H2-H10NOEs, for which the intensities correlate with the minor groove width (Chuprina et al., 1991b), are indicated in boxes and are assigned. Cross peaks arising from impurities are labeled with asterisks.
Materials and methods
Sample preparation
r(gcaguggc) and r(gcca)d(CTGC) were synthesized on a 1µmol scale on an Applied Biosystems 392/8 syn-thesizer using the standard phosphoramidite method. Crude products were HPLC-purified and analyzed on 20% polyacrylamide-7 M urea gels to confirm the correct length and the sequence using the guanine-specific ribonuclease T1. Fractions containing the RNA and the RNA–DNA strand were separately pooled and lyophilized. After repeated washing with ethanol, the nucleic acids were dissolved in an
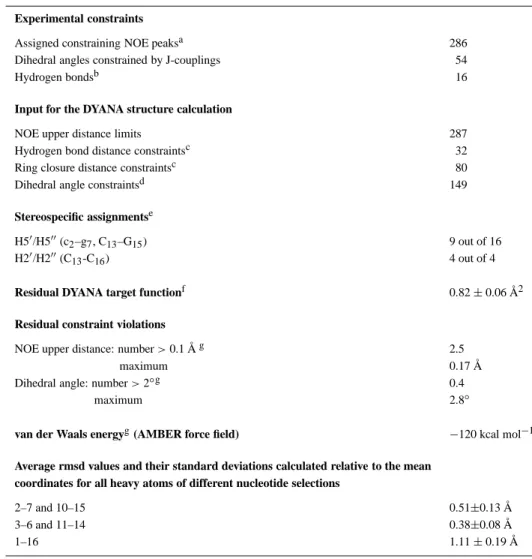
aque-Table 1. Statistics for the structure determination of (gcaguggc)·(gccaCTGC) using DYANA Experimental constraints
Assigned constraining NOE peaksa 286
Dihedral angles constrained by J-couplings 54
Hydrogen bondsb 16
Input for the DYANA structure calculation
NOE upper distance limits 287
Hydrogen bond distance constraintsc 32
Ring closure distance constraintsc 80
Dihedral angle constraintsd 149
Stereospecific assignmentse
H50/H500(c2–g7, C13–G15) 9 out of 16
H20/H200(C13-C16) 4 out of 4
Residual DYANA target functionf 0.82± 0.06 Å2
Residual constraint violations
NOE upper distance: number > 0.1 Åg 2.5
maximum 0.17 Å
Dihedral angle: number > 2◦g 0.4
maximum 2.8◦
van der Waals energyg(AMBER force field) −120 kcal mol−1 Average rmsd values and their standard deviations calculated relative to the mean
coordinates for all heavy atoms of different nucleotide selections
2–7 and 10–15 0.51±0.13 Å
3–6 and 11–14 0.38±0.08 Å
1–16 1.11± 0.19 Å
a350 NOE cross peaks were assigned and translated into1H-1H upper distance constraints, and for 42 peaks with extensive overlap with other peaks the constraint was set to 5.5 Å. Of these 392 distance constraints, 286 were meaningful, i.e. truly constraining the conformation. Seventeen of the constraining limits correspond to interstrand NOEs.
bHydrogen bond constraints were introduced for the six central Watson–Crick base pairs of the duplex. These were inferred from the observed imino proton exchange rate constants.
cTwo distance limits were included for each hydrogen bond, and five limits per ribose moiety were applied to enforce ring closure. These supplementary distance constraints were omitted during the energy minimization. dOutput of the grid search performed with the FOUND module of DYANA.
eStereospecific assignments were either obtained using the FOUND module of DYANA or the program GLOMSA, or were inferred from chemical shifts.
fBefore energy-minimization.
gValue averaged over the 20 energy-refined DYANA conformers.
ous buffer containing 50 mM NaCl, 10 mM sodium-phosphate at pH 7.0, and 0.5 mM perdeuterated ethylene-diaminetetraacetic acid (EDTA) (Cambridge Isotope Laboratories, Andover, MA, U.S.A.). Subse-quently the samples were dialyzed for 72 h against the same buffer using a 1 kDa cut-off membrane. Duplex formation was achieved by titrating the RNA strand
with the chimeric strand. The titration was monitored by observation of the single T14-CH3 group in 1D 1H NMR spectra (the methyl resonance is shifted by about 0.3 ppm upfield upon duplex formation). The high signto-noise ratio achieved in these spectra al-lowed to check on the desired 1:1 stoichiometry of the two strands to within 2%. The solution of the
du-plex (1.1 ml) was then lyophilized and dissolved in 550µl of either D2O buffer or 90% H2O/10% D2O buffer, yielding a final duplex concentration of about 1.5 mM (100 mM NaCl, 20 mM Na-phosphate, 1 mM perdeuterated EDTA, pH 7.0).
NMR and CD spectroscopy
Circular dichroism (CD) spectra recorded for the du-plex r(gcaguggc)·r(gcca)d(CTGC) between 20 and 80◦C yielded a melting temperature of about 55◦C, and the spectra recorded between 20 and 35◦C were virtually identical. However, 1D 31P NMR spec-tra revealed a change of the 31P chemical shift of c2 between 30 and 35◦C, indicating increased fray-ing of the DNA/RNA duplex segment. Hence, NMR measurements were performed at 25◦C using Bruker
AMX500/AMX600 and Varian UNITY750+ NMR
spectrometers. (A) 2D 1H-spectra recorded in D2O: 2QF-COSY (Rance et al., 1983) (1H-resonance fre-quency 600 MHz, t1,max= 150 ms, t2,max = 205 ms, total measurement time 23 h); E. COSY (Griesinger et al., 1985) (600 MHz, 88 ms, 205 ms, 16 h); clean
[1H,1H]-TOCSY (Griesinger et al., 1988) (750 MHz, 133 ms, 128 ms, 20 h; τm = 30 ms; 600 MHz, 90 ms, 102 ms, 18 h,τm= 90 ms); [1H,1H]-NOESY (Anil Kumar et al., 1980) (750 MHz, 86 ms, 128 ms, 82 h, τm = 33 ms, zero-quantum suppression (Ot-ting et al., 1990) for ribose protons; recycle time 5 s; 600 MHz, 102 ms, 205 ms, 36 h, three experiments with τm = 50 ms, 150 ms and 300 ms, respec-tively, recycle time 10 s). 2D1H-spectrum recorded in H2O: [1H,1H]-NOESY (750 MHz, 86 ms, 128 ms, 52 h, τm = 35 ms, water suppression using WA-TERGATE (Piotto et al., 1992), recycle time 10 s). (B) Heteronuclear 2D experiments recorded in D2O:
[31P ,1H]-COSY (Sklenáˇr and Bax, 1987) (500 MHz, 60 ms, 51 ms, 12 h);[13C,1H]-HSQC (Bodenhausen and Ruben, 1980) for the sugars and the base C5H groups (600 MHz, 21 ms, 51 ms, 96 h); [13C,1H ]-HSQC for the other base resonances (600 MHz, 21 ms, 51 ms, 48 h). The spectra were processed and analyzed using the programs PROSA (Güntert et al., 1992) and XEASY (Bartels et al., 1995), respectively.
Resonance assignments and collection of conformational constraints
Sequential 1H resonance assignments were obtained using standard protocols based on the observation of 1H-1H NOEs (Figure 1). The spin system identifica-tion was achieved using the 2D 2QF-COSY, TOCSY,
[13C,1H]-HSQC (Figure 2) and [31P,1H]-COSY
ex-periments (Wüthrich, 1986; Varani and Tinoco, 1991). Except for the RNA hydroxyl protons, the amino protons of A and G, and the imino protons of the terminal nucleotides g1 and g9, complete 1H reso-nance assignments were obtained.13C chemical shifts were obtained for all 1H-bound carbons, except for C40 of g1–g7and c10–a12, and for C20 of g4and g6. All 31P chemical shifts except those of g6 and c10 were assigned, and the[31P,1H]-COSY experiment revealed the absence of strongly downfield shifted31P resonances. The chemical shifts have been deposited in the BioMagResBank (http://www.bmrb.wisc.edu; accession number: 4247).
1H-1H upper distance limits (Table 1) were derived from the 750 MHz NOESY spectra using the isolated spin pair approximation (Wüthrich, 1986). Compar-ison of NOE cross peaks observed in the 750 MHz spectrum recorded withτmix = 33 ms/recycle time 5 s, and in the 600 MHz spectrum recorded with
τmix = 50 ms/recycle time 10 s revealed that upper distance limits derived from the 750 MHz spectrum were up to 5% shorter than those derived from the 600 MHz spectrum, which is due to the shorter T1 -relaxation times of deoxyribose when compared with ribose protons (Wang et al., 1992). Since a recy-cle time of 10 s would yield a prohibitively long measurement time for a NOESY spectrum recorded with zero-quantum suppression, upper distance lim-its involving deoxyribose protons were relaxed by 5% to ensure conservative data interpretation. Hydrogen bond constraints (upper and lower distance limits of 2.25 Å and 2.15 Å for the hydrogen–acceptor distance, and of 3.25 Å and 3.15 Å for the donor–acceptor dis-tance, respectively) were inferred from imino proton exchange rates, kNH, for the central six base pairs. The rates were estimated from the relative intensities of the diagonal peaks and the cross peaks atω1(H2O) in the NOESY spectrum recorded in H2O. kHN val-ues are: G15 ≈ 4 s−1; T14 ≈ 2 s−1; G4 ≈ 3 s−1; u5 ≈ 4 s−1; G6 ≈ 1 s−1; G7≈ 1 s−1. The values re-flect protection factors of about 104relative to the free nucleotides (Wüthrich, 1986), and thus provide exper-imental evidence for the formation of Watson–Crick base pairs (Guéron and Leroy, 1995). The terminal imino protons could not be observed by 1D1H NMR, so that no constraints were introduced for the terminal base pairs (a test calculation revealed that the addi-tion of constraints for these hydrogen bonds did not lead to an increase in residual constraint violations). 3J
H10H20 values of riboses were extracted by inverse Fourier transformation of in-phase multiplets
(Szyper-70.00 80.00 4.00 4.10 4.20 4.30 4.40 4.50 4.60 64.50 65.00 65.50 66.00 66.50 67.00 67.50 68.00 70 90 2.0 4.0 6.0 ω2(1H) [ppm] 1’-RNA 5 11 8 2 13 16 10 12 3 6 71 11 8 2 4 10 5 9 * 5 1’-DNA 15 16 14 13 5’ 1,9 4’ 3’ 2’-DNA 5 10 2 11 12 3 7 13 6 4 14 16 8 15 16 15 13 14 8 1,9 13 15 14 16 2−7,10−12 * * * 2’-RNA ω1(13C) [ppm] 14-CH3 * * * * *
Figure 2. 2D [13C,1H]-HSQC spectrum recorded for the sugar moieties of r(gcaguggc)·r(gcca)d(CTGC). Solid and dashed contour lines represent positive and negative peaks, respectively; the resonances of T14-CH3and 20of the DNA have been folded alongω1. The dashed rectangles identify spectral regions of specified carbon types, and resonance assignments are identified with the sequence location of the corresponding nucleotide according to the numbering shown in Figure 1. For clarity, the assignments in the region comprising 20-RNA and 30 resonances have been omitted. The solid rectangle in the 50-region identifies the spectral region shown in the insert in the upper right. Cross peaks of stereospecifically assigned methylene protons are denoted in italics (for deoxyriboses, H20resonates upfield from H200and, except for G15, H500resonates upfield from H50). The chemical shifts are relative to internal 2,2-dimethyl-2-silapentane-5-sulfonate sodium salt (1H resonance frequency: 600 MHz; same sample as in Figure 1; T= 25◦C). Cross peaks arising from impurities are labeled with asterisks.
ski et al., 1992) from the NOESY spectrum recorded with τm = 300 ms. 3JH10H20 and 3JH10H200 values of the deoxyribose rings were measured by E.COSY. For g1–c8 and g9–C13, 3JH10H20 < 2 Hz yielded the constraint ν1 ≤ −20◦, corresponding to a range of [−96◦,24◦] for the pseudorotation angle. For T14–G15, the3JH10H20values (T14: 6.8 Hz; G15: 8.0 Hz), the sum of couplings to H30(T14: 17 Hz; G15: 13 Hz) and the H10-H40 NOE upper distance limits (T14: 3.7 Å; G15: 3.6 Å) reflect conformational averaging, i.e., rapid re-puckering, for the deoxyribose rings, and therefore no angle constraints were derived from 3JHH for these deoxyribonucleotides. Figure 3 affords the dihedral angle constraints that were derived for the dihedral angles β, γ and e. For c2–c8, a12, and T14–C16,
which exhibited neither a P–H50nor a P-H500 correla-tion in[31P,1H]-COSY (indicating3J
PH50 and3JPH500 <5 Hz), theβ-angle was constrained (Wijmenga et al., 1993) to 180◦± 20◦. A very weak P-H correlation was observed for C13, and theβ-constraint was relaxed to 180◦± 40◦. For c10 and c11, the position of one of the potential H correlations coincided with other P-H30or P-H40peaks, so that only the information that either3JPH50or3JPH500< 5 Hz could be translated into aβ-constraint (180◦ ± 20◦or 45◦ ± 25◦ or−45◦ ± 25◦). Allβ-constraints are in agreement with the H50 and H500NOESY line widths (Kim et al., 1992). Angle constraints forγ (c2-g7, c10, c11: 60◦± 30◦; a12: 60◦
± 40◦or−120◦± 40◦; C13: 60◦± 40◦or−110◦±
60◦or−110◦± 20◦) and fore (c2-g7:−40◦± 30◦;g9, a12: −110◦ ± 150◦; c10, c11: −40◦ ± 30◦ or 165◦
±30◦; C
13–G15: −120◦ ± 130◦) were derived from H40and H30resonance line widths, respectively (Kim et al., 1992).
Structure calculation
The intranucleotide and sequential upper distance lim-its and the dihedral angle constraints were translated into dihedral angle constraints using the FOUND module (Güntert et al., 1998) of DYANA (Güntert et al., 1997), which performs a grid search for allowed conformations in the space spanned by the nine tor-sion angles describing a dinucleotide segment. The FOUND calculation also provided stereospecific as-signments for H20/H200 of the deoxyribose rings, and for H50/H500 of c2, g4 and g7. Additional stereospe-cific H50/H500 assignments for g6 and for C13–G15 were obtained from initial structure calculations us-ing the program GLOMSA (Güntert et al., 1991). The stereospecific H50/H500 assignments of the RNA strand coincide in all instances with the previously observed correlation between the chemical shift dif-ferencesδ(H50)-δ(H500) and the C50 chemical shift in dsRNA (Marino et al., 1994; Klinck et al., 1997). We therefore used the chemical shifts (Figure 2) to obtain additional H50/H500 stereospecific assignments for a3 and u5. The input for the final DYANA structure cal-culation, which also included constraints to close the sugar rings (C40-O40: 1.41 Å, C40-C10: 2.40 Å, C50 -O40: 2.39 Å, H40-O40: 2.12 Å), is listed in Table 1. The calculation was started with 100 randomized struc-tures and the resulting 20 DYANA conformers with the lowest target function values were subjected to re-strained energy minimization using the AMBER force field (Weiner et al., 1986) as implemented in the pro-gram OPAL (Luginbühl et al., 1996). Minimization parameters included a water shell of 15 Å thickness, a constant dielectric, the TIP3P water model and a cut-off of 15 Å. Upper distance limits and dihedral angle constraints were enforced as described in Fernandez et al. (1997). No hydrogen bond constraints were used during energy minimization. Coordinates and NMR constraints of r(gcaguggc)·r(gcca)d(CTGC) have been deposited in the Brookhaven Protein Data Bank, ac-cession number 1byx. Figures 4 and 5 were generated using the program MOLMOL (Koradi et al., 1996).
Results and discussion
NMR structure of r(gcaguggc)·r(gcca)d(CTGC) In view of the limited proton chemical shift disper-sion of the ribose moieties we recorded 2D [13C,1 H]-HSQC spectra at natural 13C abundance (Figure 2) to obtain nearly complete1H resonance assignments. This then provided the starting point for the collection of a large number of rather accurate1H-1H upper dis-tance constraints from NOESY spectra recorded with very short mixing times at a1H resonance frequency of 750 MHz (Figure 1). In addition, vicinal spin-spin couplings were experimentally derived that constrain the allowed value ranges for the torsion anglesβ, γ ande (Figure 3, red color) and the sugar ring pucker (asterisk forδ in Figure 3). These experimental data on the torsion angles, combined with upper distance limits from intranucleotide and sequential NOEs, were used as input for grid searches over the dinucleotide conformational spaces, using the newly implemented FOUND module of DYANA (Güntert et al., 1998). The calculations for each dinucleotide segment fol-lowed closely the example given by Güntert et al. (1998), where smaller fragments were considered be-fore performing the final nine-dimensional grid search for segments comprising two nucleotides i and i+1. The nine variables were the torsion angles e and ζ of nucleotide i, α, β and γ of nucleotide i+1, and the sugar puckers andχ1angles of both nucleotides. Except for the few interstrand NOEs (Table 1), all NOE distance constraints are considered in this ap-proach. FOUND thus makes use of more than 90% of the measured NOE distance constraints to derive torsion angle constraints for use as input for the fi-nal DYANA structure calculation. In fact, we obtained quite tight constraints on the value ranges for all tor-sion angles, including the backbone dihedral anglesα andζ for which no scalar coupling constraints can be derived (Figure 3, green color). This allowed, for the first time, to follow a conservative structure determina-tion protocol (Wüthrich, 1986) for an oligonucleotide double helix using exclusively upper limit NOE dis-tance constraints and scalar couplings. The statistical parameters for the resulting 20 energy-refined con-formers, calculated to represent the NMR structure, demonstrate that this approach allowed determination of a high-quality structure for this oligonucleotide duplex (Table 1, Figure 4). To assess the possible impact of the additional use of 1H-1H lower dis-tance limit constraints supplementing those derived from the van der Waals radii, 198 well-resolved cross
α
β
γ
δ
ε
ζ
c
2a
3g
4u
5g
6g
7χ
α
β
γ
δ
ε
ζ
G
15T
14C
13a
12c
11c
10χ
5* 5* -7* 13* 19* 5* 22 10* 7* 13* 12* 157(107)Figure 3. Backbone and glycosidic dihedral angles of the six non-terminal base pairs of r(gcaguggc)·r(gcca)d(CTGC). The dihedral angles
were taken from the 20 best energy-refined DYANA conformers (Table 1) which were ordered according to increasing residual DYANA target function values before energy minimization. The 20 values for each angle are plotted in this order from the center to the periphery, which gives rise to the black lines in the circles. Sections colored in red in the circles ofβ, γ and e represent the ranges that were excluded by the experimentally determined scalar couplings (see Materials and methods). The green sections represent the dihedral angle ranges that were excluded based on the calculations with the FOUND module of DYANA, using the local NOE distance constraints and the experimental spin–spin coupling constants as input (Table 1). Angles corresponding to the RNA strand and the chimeric strand are shown in the left and right boxes, respectively. The pseudorotation phase angles of the sugar rings are indicated within the circles ofδ and were calculated from the correspondingν1values assuming a maximal pucker amplitude of 40◦. An asterisk indicates thatν1was constrained due to3JH10H20 < 2 Hz (see Materials and methods). For G15, two conformers exhibited a pseudorotation angle of about 107◦(given in parentheses). Dihedral angle values for standard A-RNA (Kennard and Hunter, 1991), and A- and B-DNA (Dickerson, 1992) are:α (A-RNA: −68◦, A-DNA:−73◦, B-DNA:−65◦),β (178◦, 173◦, 167◦),γ (54◦, 64◦, 51◦),δ (82◦, 78◦, 129◦),e (−153◦,−151◦,−157◦),ζ (−71◦,−77◦,−80◦),χ (−158◦, −165◦,−103◦). Note thatδ and χ show the largest change when comparing A- and B-type duplexes.
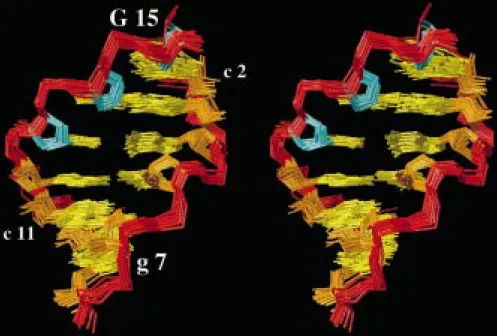
Figure 4. Stereoview into the minor groove of the central hexanucleotide segment of r(gcaguggc)·r(gcca)d(CTGC). The 30-end of the chimeric strand shown on the left is located at the top, and selected nucleotides are indicated (the numbering of the nucleotides is shown in Figure 1). The 20 best energy-refined DYANA conformers (Table 1) were superimposed for pairwise minimal rmsd of the heavy atoms of this segment. Color code: phosphodiester backbone, red; deoxyribose rings, cyan; ribose rings, orange; bases, yellow.
peaks of the NOESY spectrum recorded in D2O were translated into lower limits according to the relation lower-limit= 0.6 ∗ upper-limit +0.5 Å, where only lower limits shorter than 3.5 Å were retained. Six-teen additional lower limits of 3.5 Å were derived from the absence of NOE cross peaks. This procedure yielded a total of 191 lower limits which were com-bined with the constraints listed above. The resulting residual DYANA target function value remained con-stant (0.84± 0.03 Å2), and the average rmsd values calculated for the 20 best energy-minimized DYANA conformers decreased by only about 15% (0.47 Å for nucleotides 2–7 and 10–15: 0.33 Å for 3–6 and 11–14: 0.94 Å for 1–8 and 9–16).
Considering the increased opening rate of the ter-minal base pairs (see Materials and methods), the following structure analysis is focussed on the six non-terminal base pairs (Figure 1). Figure 3 af-fords a graphical representation of the backbone and glycosidic dihedral angle values in the 20 in-dividual, energy-refined DYANA conformers. The comparison with standard A- and B-DNA helices (Table 2 and Figure 3) reveals that the structure of r(gcaguggc)·r(gcca)d(CTGC) belongs to the ‘A-family’ (Figure 5A) but exhibits the following clearcut differences relative to a standard A-duplex. (i) The sugar puckers of all riboses and the deoxyribose of C13, which is located at the RNA–DNA junction, are in an N conformation (C20-exo to C30-endo). In con-trast, the 3JHH couplings and H10-H40 NOE upper distance limits (see Materials and methods) indicate rapid repuckering for the deoxyribose rings of T14and G15. In the framework of a two-state model (Hartmann and Lavery, 1996) assuming rapid interconversion be-tween C20-endo and C30-endo, these data yield∼50% and∼70% S conformation for T14 and G15, respec-tively. Hence, in the C13-T14-G15segment we observe an increasing fraction of S conformation towards the 30end of the chimeric strand. The fact that the popu-lation of the S conformer is lower than typically found in B-DNA duplexes (∼80–90%) indicates increased flexibility for the segment of T14-G15when compared with dsDNA. Consistently, the corresponding imino proton exchange rates are faster than those within the RNA segment (see Materials and methods). Reduced populations of S conformer have previously also been reported for the DNA strand in a DNA/RNA hybrid duplex (González et al., 1994), and have been impli-cated by a recent molecular dynamics simulation of oligonucleotide duplexes (Cheatham et al., 1996). Fur-thermore, allχ-angles observed for the non-terminal
base pairs are close to the standard value measured for A-helices, with the sole exception of G15 (Figure 3). Overall, the chimeric strand thus shifts from an A-like to a B-A-like conformation at the dinucleotide seg-ment T14-G15, as is also evidenced by the intensities of the sequential H10-H6/H8 NOEs observed for the chimeric strand (Figure 1). Notably, the final distance geometry calculation, which was performed without 3J
HH-derived constraints for T14 and G15 (see Mate-rials and methods), generated exclusively C30-endo conformations for T14 while both C20-endo and C30 -endo conformations were obtained for G15(Figure 3). This finding supports the general notion that proper ring pucker analyses should include measurement of scalar coupling constants (e.g., Wijmenga et al., 1993; Szyperski et al., 1998). (ii) The absence of strongly downfield-shifted 31P resonances is consistent with canonical BIconformations (etζ−) (Gorenstein et al., 1988) for all deoxyribonucleotides (Figure 3), and the apparently deviatinge−values found for some of the 20 energy-refined conformers at g7(Figure 3) are very likely due to the fact that this dihedral angle is least well defined by the experimental constraints. More-over, there are no crankshaft transitions (α−γ+toαtγt) (Figure 3), which have in other studies been shown to induce bends in dsRNA (Dock-Bregeon et al., 1989). (iii) Large propeller twists are observed for the two base pairs at the RNA–DNA junction (Figure 5B; Table 2), but there is no evidence for bifurcated inter-strand hydrogen bonds (Nelson et al., 1986), and only moderately large buckle and opening angles are found (Table 2). (iv) Except for the last base step, the local slides are closer to an A-form, while the standard value for the twist is intermediate between the standard A-and B-forms (Table 2). (v) The minor groove is nar-row, which is directly evidenced by strong interstrand H2-H10NOEs (Figure 1), and its width decreases from about 7.5 Å in the dsRNA segment to about 5.5 Å at the RNA–DNA junction and 4.5 Å in the hybrid segment (Figure 5C). This shift is unexpected, con-sidering that the groove width of A-RNA is∼11 Å (Kennard and Hunter, 1991), and that of DNA/RNA duplexes is∼8–9 Å (Fedoroff et al., 1993, 1996,1997; Lane et al., 1993; Salazar et al., 1994, 1996; Zhu et al., 1995; Hartmann and Lavery, 1996). In fact, the minor groove width in this chimeric hybrid duplex is close to that of B-DNA, for which a range of 3.0 Å–8.2 Å has been reported (Dickerson, 1992).
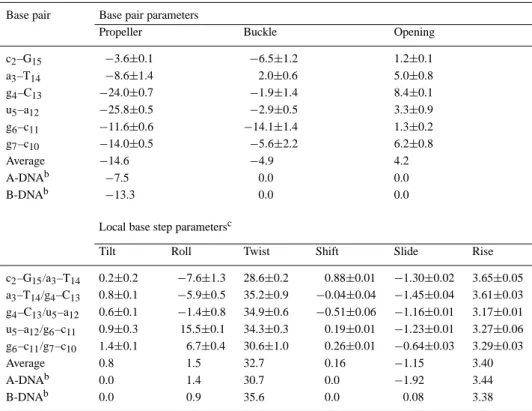
Table 2. Helix parametersafor the non-terminal base pairs of (gcaguggc)·(gccaCTGC) Base pair Base pair parameters
Propeller Buckle Opening
c2–G15 −3.6±0.1 −6.5±1.2 1.2±0.1 a3–T14 −8.6±1.4 2.0±0.6 5.0±0.8 g4–C13 −24.0±0.7 −1.9±1.4 8.4±0.1 u5–a12 −25.8±0.5 −2.9±0.5 3.3±0.9 g6–c11 −11.6±0.6 −14.1±1.4 1.3±0.2 g7–c10 −14.0±0.5 −5.6±2.2 6.2±0.8 Average −14.6 −4.9 4.2 A-DNAb −7.5 0.0 0.0 B-DNAb −13.3 0.0 0.0
Local base step parametersc
Tilt Roll Twist Shift Slide Rise
c2–G15/a3–T14 0.2±0.2 −7.6±1.3 28.6±0.2 0.88±0.01 −1.30±0.02 3.65±0.05 a3–T14/g4–C13 0.8±0.1 −5.9±0.5 35.2±0.9 −0.04±0.04 −1.45±0.04 3.61±0.03 g4–C13/u5–a12 0.6±0.1 −1.4±0.8 34.9±0.6 −0.51±0.06 −1.16±0.01 3.17±0.01 u5–a12/g6–c11 0.9±0.3 15.5±0.1 34.3±0.3 0.19±0.01 −1.23±0.01 3.27±0.06 g6–c11/g7–c10 1.4±0.1 6.7±0.4 30.6±1.0 0.26±0.01 −0.64±0.03 3.29±0.03 Average 0.8 1.5 32.7 0.16 −1.15 3.40 A-DNAb 0.0 1.4 30.7 0.0 −1.92 3.44 B-DNAb 0.0 0.9 35.6 0.0 0.08 3.38
aAveraged values (angles in degrees and distances in Å) and their standard deviations calculated for 20 energy-refined DYANA-conformers using the program RNA (Babcock et al., 1994).
bFrom Table 2 in Hartmann and Lavery (1996).
cLocal parameters as defined in Babcock et al. (1994). For a comparison with global parameters see Hartmann and Lavery (1996).
Comparison with the crystal structure of r(gcaguggc)·r(gcca)d(CTGC)
A recent X-ray crystal structure of the presently in-vestigated RNA/RNA–DNA hybrid (Mueller et al., 1998) differs markedly from our NMR solution struc-ture. The crystal structure exhibits C30-endo sugar conformations for all nucleotides, including the four deoxyribonucleotides. The sugar puckers, along with a small rise per base pair, an average twist value of 33◦ and a uniform minor groove width of 10.1 Å, indicate that the structure very closely resembles an ideal A-helix in the crystal. In contrast, the NMR structure shows a shift from an A-like to a B-like conformation in the chimeric strand, and a concomitant decrease in the minor groove width. Thus, unlike the crys-tallographic data, the NMR solution structure points to structural differences between the RNA/RNA and DNA/RNA segments.
Discrepancies between corresponding X-ray crys-tal and NMR solution structures are well documented for hybrid oligonucleotide duplexes. Crystal structures
of duplexes comprising a chimeric DNA–RNA strand and a complementary DNA strand exhibit nearly ideal A-conformations, irrespective of the number of ri-bonucleotides and their sequence locations in the chimeric chain (Egli et al., 1992, 1993). Remarkably, a single ribonucleotide has been shown to lock an entire duplex in an A-like conformation (Egli et al., 1993; Ban et al., 1994). In sharp contrast, NMR stud-ies of DNA/DNA–RNA duplexes revealed that these adopt neither A- nor B-type conformations in solu-tion (Fedoroff et al., 1993; Lane et al., 1993). For the crystal structure of the presently studied RNA/DNA– RNA duplex, Mueller et al. (1998) suggested that the RNA strand may induce the formation of the uniform A-conformation. The solution structure disagrees with this suggestion, and there are indications that appar-ent discrepancies between NMR solution and X-ray crystal structures are presumably attributable to crystal packing forces and dehydration during crystallization (Salazar et al., 1994; Wahl and Sundaralingam, 1995; Fedoroff et al., 1996).
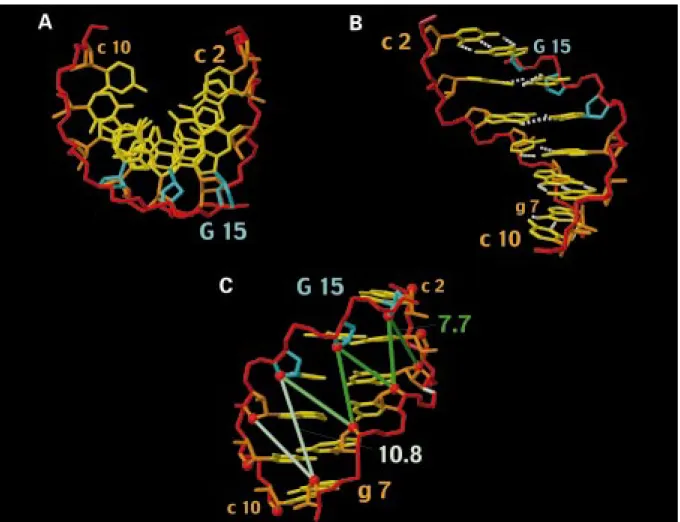
Figure 5. Structure of r(gcaguggc)·r(gcca)d(CTGC) represented by the energy-refined DYANA conformer with the lowest residual target
function value. (A) View along the helix axis obtained after rotating the conformer from its orientation in Figure 4 by 90◦about a horizontal axis in the projection plane. The large displacement of the bases from the helix axis is typical for an A-type duplex. The same color code has been chosen as in Figure 4. (B) View into the major groove obtained after rotating the conformer from its orientation in Figure 4 by 180◦about a vertical axis in the plane. Hydrogen bonds are represented by white dashed lines to indicate the large propeller twists (Table 2) observed for the base pairs at the RNA–DNA junction (g4≡C13and u5=a12). (C) Same view into the minor groove as in Figure 4. O40–O40 distances across the minor groove are indicated by green bars. The gradual change from light green to dark green indicates the narrowing of the minor groove when crossing the DNA–RNA junction. From top to bottom, the following O40–O40distance ranges (in Å) are observed for the 20 energy-refined DYANA conformers: G15–g4, 7.0–8.4; G15–u5, 6.7–8.1; T14–u5, 6.4–7.6; T14–g6, 7.0–8.4; c13–g6, 7.7–9.1; C13–g7, 10.0–11.5; a12–g7, 9.3–10.7. The averaged O40–O40distances are given for C13–g7(10.8) and G15–g4(7.7). The minor groove width can be estimated by subtraction of 2.8 Å from these values (e.g. Han et al., 1997), i.e. the width decreases from about 7.5 Å to 4.5 Å when moving from the dsRNA to the hybrid segment. The O30-P bond between g4and u5, which is primarily cleaved by RNaseH during the initiation, is located on the right and is indicated in white.
Implications for the specificity of RT-associated RNaseH
Structure determinations of DNA/RNA hybrid du-plexes in solution (Lane et al., 1993; Fedoroff et al., 1993) as well as modeling studies (Nakamura et al., 1991; Fedoroff et al., 1993) have previously led to the hypothesis that the minor groove width of a du-plex represents a key structural feature for specific interactions between RNaseH and its nucleic acid
sub-strates. In particular, it has been suggested that a minor groove width of about 8–9 Å should be optimal (Fe-doroff et al., 1993) for efficient recognition (Salazar et al., 1994, 1996; Zhu et al., 1995; Fedoroff et al., 1996, 1997; Horton et al., 1996; Han et al., 1997; Bachelin et al., 1998). The presently described solu-tion structure of r(gcaguggc)·r(gcca)d(CTGC), which is the first structure determination of an RNA/RNA– DNA hybrid duplex in solution, now indicates
alterna-tive interaction mechanisms. Firstly, the minor groove diameter (Figure 5C) is only about 4.5 Å to 5.5 Å in the hybrid segment and at the RNA–DNA junction, respectively, where the RNA strand is cut by the RT-associated RNaseH during initiation of HIV-1 reverse transcription. Secondly, the minor groove width in the dsRNA segment is closer to the putative optimum, but cleavages within the dsRNA are exclusively seen in stalled RT–tRNALys3/(+)RNA complexes (Götte et al., 1995).
There are other recent studies that also indicate that the minor groove width may not necessarily be a key structural feature determining RNaseH specificity. Firstly, two structural studies have been pursued to shed light on the observation that the DNA/RNA hy-brid corresponding to the polyribopurine tract (PPT) of the HIV genome is resistant to RNaseH digestion, where the two groups arrived at contradictory conclu-sions: one suggests that it is widening of the minor groove (Fedoroff et al., 1997), and the other claims that it is narrowing of the minor groove (Han et al., 1997) that can explain the resistance to RNase di-gestion. Secondly, no apparent relationship between the minor groove width and E. coli RNaseH cleav-age sites could be identified in two recently published NMR solution structures of chimeric hybrid duplexes (Nishizaki et al., 1995).
It has also been proposed that not only the mi-nor groove width but also bending of the dou-ble helix (Fedoroff et al., 1996) may confer RT RNaseH specificity at RNA–DNA junctions. In this respect it is of interest to compare the solution structure of d(GCAGTGGC)·r(gcca)d(CTGC) (Fe-doroff et al., 1996), which includes the DNA– tRNA junction that is cleaved during the primer removal reaction, with the presently studied du-plex r(gcaguggc)·r(gcca)d(CTGC). The two duplexes contain the same chimeric strand, which is an-nealed either with a DNA or an RNA strand. For d(GCAGTGGC)·r(gcca)d(CTGC), a wider minor groove width is observed in the hybrid segment when compared with the dsDNA segment. Hence, assuming that the RT RNaseH domain follows the polymerase during DNA synthesis as a part of an ‘elongation com-plex’ (Lanchy et al., 1996), inverse shifts in groove widths would have to be accommodated, i.e., the RNaseH domain would encounter a narrowing of the groove during the initiation of reverse transcription but a widening during the primer removal reaction. Con-sidering that the minor groove widths at the respective cleavage sites are also different, the comparison of the
two structures indicates that the minor groove width may not, after all, be a decisive factor in determining RT RNase specificity. On the other hand, a large vari-ation of the minor groove width along the sequence of the presently studied duplex (Figure 5C) suggests (Chuprina et al., 1991a) that it may be bent [A six base-pair segment is too short to reliably identify a bend. However, analysis with the program CURVES (Ravishankar et al., 1988) indicates a bend for all 20 energy-refined DYANA conformers]. A bend has been described for d(GCAGTGGC)·r(gcca)d(CTGC), and it is thus tempting to speculate (Fedoroff et al., 1996) that the preformation of a bend in the free du-plex would lower the cost for the site-specific strand cleavages documented for RT RNaseH.
The available data thus show that the three-dimensional structure of an oligonucleotide duplex alone is not sufficient for predicting its susceptibility to RNaseH digestion, indicating that the protein– nucleic acid interaction may involve substantial con-formational rearrangements of the nucleic acid, a view initially set forth by Nakamura et al. (1991). Accordingly, it is the increased malleability of the hybrid segment mediated, for example, by the inher-ently higher flexibility of deoxyribose versus ribose moieties, which allows for the adaptation of the hy-brid duplex to the enzyme. Protein binding-induced changes in the sugar puckers of a DNA duplex retain-ing its B-conformation upon complex formation have very recently been demonstrated for an Antennapedia homeodomain–DNA system (Szyperski et al., 1998). This indicates that the specificity of RT RNaseH might be partly based on the conformational adaptability of deoxyriboses. Such an ‘induced-fit’ scenario is also indicated by the investigation of the backbone dynam-ics of E. coli ribonuclease HI (Mandel et al., 1995), which revealed increased flexibility for the polypep-tide segments comprising the active site residues, and by a kinetic analysis of E. coli RNaseH (Kanaya et al., 1995).
Induced-fit interactions, facilitated by the inher-ent flexibility of DNA residues, might also explain the 50-fold increased rate for nucleotide incorporation which is observed once the RT has passed the initially bound RNA/RNA duplex and synthesizes the hybrid instead (Lanchy et al., 1996). In fact, the very re-cently determined X-ray crystal structure of the active DNA polymerase from Bacillus stearothermophilus showed that the sugar puckers of the terminal base pair change conformation upon incorporation of the sub-sequent nucleotide triphosphate (Kiefer et al., 1998).
With regard to RT, such a mechanism has not been proven yet, but the crystal structure of an RT–dsDNA complex (Jacobo-Molina et al., 1993) indicates that the enzyme enforces an A-conformation for the ter-minal six base pairs that are located in the vicinity of the polymerase active site. It has been suggested that the A-form is induced by dehydration of the nu-cleic acid in the polymerase active site (Ding et al., 1994), and an underwound A-form DNA has actually been identified in the active DNA polymerase from Bacillus stearothermophilus. In contrast, the oligonu-cleotide is comparably solvent-exposed at the RNaseH active site. Hence, induced-fit interactions between RT RNaseH and oligonucleotide substrates might addi-tionally be modulated by the hydration of the oligonu-cleotide as it is manifested in solution (Liepinsh et al., 1992), i.e., RT RNaseH might distinguish dsRNA, RNA–DNA junctions and hybrid duplexes according to their distinct hydration patterns. Consistent with this hypothesis, it has recently been shown that ribose 20 OH groups serve as a scaffold for a water network in the minor groove that may be involved in protein– dsRNA interactions (Egli et al., 1996). Moreover, it has recently been suggested that the interaction of the minor groove of a given primer/template substrate with a structural motif dubbed the ‘minor groove bind-ing track’ located near the polymerase active site of HIV-1 RT plays an important role for initiation of re-verse transcription (Bebenek et al., 1997). Considering the remarkably narrow minor groove of the presently studied duplex, this interaction might likewise depend on an ‘induced fit’ being important for the transition from initiation to elongation of reverse transcription (Isel et al., 1996).
Finally, the action of RNaseH plays a key role for the antisense strategy for medical and biochemi-cal applications (De Mesmaeker et al., 1995). Hence, the insights into RNaseH-oligonucleotide duplex in-teractions inferred from the present structural study might well support future rational design of antisense oligonucleotides.
Acknowledgements
Financial support was obtained from the Schweiz-erischer Nationalfonds (project 31.32033.91), and the Bundesamt für Bildung und Wissenschaft (Nr. 97.0593) as a part of an EU Biomed concerted action (Nr. BMH4-CT 97-2641).
References
Anil Kumar, Ernst, R.R. and Wüthrich, K. (1980) Biochem.
Bio-phys. Res. Commun., 95, 1–6.
Arnott, S., Chandrasekaran, R., Millane, R.P. and Park, H.-S. (1986)
J. Mol. Biol., 188, 631–640.
Babcock, M.S., Pednault, E.P.D. and Olson, W.K. (1994) J. Mol.
Biol., 237, 125–156.
Bachelin, M., Hessler, G., Kurz, G., Hacia, J.G., Dervan, P.B. and Kessler, H. (1998) Nat. Struct. Biol., 5, 271–275.
Baltimore, D. (1970) Nature, 226, 1209–1211.
Ban, C., Ramakrishnan, B. and Sundaralingam, M. (1992) Curr.
Opin. Struct. Biol., 5, 282–295.
Bartels, C., Xia, T., Billeter, M., Güntert, P. and Wüthrich, K. (1995)
J. Biomol. NMR, 6, 1–10.
Bebenek, K., Beard, W. A., Darden, T. A., Li, L., Prasard, R., Luton, B.A., Gorenstein, D.A., Wilson, S.H. and Kunkel, T.A. (1997)
Nat. Struct. Biol., 4, 194–197.
Blain, S.W. and Goff, S.P. (1993) J. Biol. Chem., 268, 23585–23592. Cheatham, T.E. and Kollman, P.A. (1996) J. Am. Chem. Soc., 119,
4805–4825.
Chuprina, V.P., Fedoroff, O.Y. and Reid, B.R. (1991a) Biochemistry,
30, 561–568.
Chuprina, V.P., Lipanov, A.A., Fedoroff, O.Y., Kim, S.-G., Kinta-nar, A. and Reid, B.R. (1991b) Proc. Natl. Acad. Sci. USA, 88, 9087–9091.
Davies, J.F., Hostomska, Z., Hostomsky, Z., Jordan, S.R. and Matthews, D.A. (1991) Science, 252, 88–95.
DeMesmaeker, A., Altmann, K.-H., Waldner, A. and Wendeborn, S. (1995) Curr. Opin. Struct. Biol., 5, 343–355.
Dickerson, R.E. (1992) Methods Enzymol., 211, 67–111.
Ding, J., Jacobo-Molina, A., Tantillo, C., Lu, X., Nanni, R.C. and Arnold, E. (1994) J. Mol. Recogn., 7, 157–161.
Dock-Bregeon, A.C., Chevrier, B., Podjarny, A., Johnson, J., de-Bear, J.S., Gough, G.R., Gilham, P.T. and Moras, D. (1989) J.
Mol. Biol., 209, 459–474.
Egli, M., Usman, N., Zhang, S. and Rich, A. (1992) Proc. Natl.
Acad. Sci. USA, 89, 534–538.
Egli, M., Usman, N. and Rich, A. (1993) Biochemistry, 32, 3221– 3273.
Egli, M., Portmann, S. and Usman, N. (1996) Biochemistry, 35, 8489–8494.
Fedoroff, O.Y., Salazar, M. and Reid, B.R. (1993) J. Mol. Biol., 233, 509–523.
Fedoroff, O.Y., Salazar, M. and Reid, B.R. (1996) Biochemistry, 35, 11070–11080.
Fedoroff, O.Y., Ge,Y. and Reid, B.R. (1997) J. Mol. Biol., 269, 225– 239.
Fernández, C., Szyperski, T., Bruyére, T., Ramage, P., Mösinger, E. and Wüthrich, K. (1997) J. Mol. Biol., 266, 576–593.
Furfine, E.S. and Reardon, J.E. (1991) Biochemistry, 30, 7041– 7046.
González, C., Stec, W., Kobylanska, A., Hogrefe, R.I., Reynolds, M. and James, T.L. (1994) Biochemistry, 33, 11062–11072. Gorenstein, D.G., Schroeder, S.A., Fu, J.M., Metz, J.T., Roongta, V.
and Jones, C.R. (1988) Biochemistry, 27, 7223–7237.
Götte, M., Fackler, S., Hermann, T., Perola, E., Cellai, L., Gross, H.J., Le Grice, S.F.J. and Heumann, H. (1995) EMBO J., 14, 833–841.
Griesinger, C., Sørensen, O. and Ernst, R.R. (1985) J. Am. Chem.
Soc., 107, 6394–6396.
Griesinger, C., Otting, G., Wüthrich, K. and Ernst, R.R. (1988) J.
Guéron, M. and Leroy, J.L. (1995) Methods Enzymol., 261, 383– 413.
Güntert, P., Braun, W. and Wüthrich, K. (1991) J. Mol. Biol., 217, 517–530.
Güntert, P., Dötsch, V., Wider, G. and Wüthrich, K. (1992) J.
Biomol. NMR, 2, 619–629.
Güntert, P., Mumenthaler, C. and Wüthrich, K. (1997) J. Mol. Biol.,
273, 283–298.
Güntert, P., Billeter, M., Ohlenschläger, O., Brown, L.R. and Wüthrich, K. (1998) J. Biomol. NMR, 12, 543–548.
Han, G.W., Kopka, M.L., Cascio, D., Grzeskowiak, K. and Dickerson, R.E. (1997) J. Mol. Biol., 269, 811–826.
Hartmann, B. and Lavery, R. (1996) Q. Rev. Biophys., 29, 309–368. Horton, N.C. and Finzel, B.C. (1996) J. Mol. Biol., 264, 521–533. Hostomsky, Z., Hughes, S.H., Goff, S.P. and Le Grice, S.F.J. (1994)
J. Virol., 68, 1970–1971.
Isel, C., Landry, J.M., LeGrice, S.F., Ehresmann, C., Ehresmann, B. and Marquet, R. (1996) EMBO J., 15, 917–924.
Jacobo-Molina, A., Ding, J., Nanni, R.G., Clark, A.D., Lu, X., Tantillo, C., Williams, R.L., Kamer, G., Ferris, A.L., Clark, P., Hizi, A., Hughes, S.H. and Arnold, E. (1993) Proc. Natl. Acad.
Sci. USA, 90, 6320–6324.
Kanaya, E. and Kanaya, S. (1995) Eur. J. Biochem., 231, 557–562. Kennard, O. and Hunter, W.N. (1991) Angew. Chem. Int. Ed. Engl.,
30, 1254–1277.
Kiefer, J.R., Mao, C., Braman, J.C. and Beese, L.S. (1998) Nature,
391, 304–307.
Kim, S.-G., Lin, L.-J. and Reid, B.R. (1992) Biochemistry, 31, 3564–3574.
Klinck, R., Sprules, T. and Gehring, K. (1997) Nucleic Acid Res.,
25, 2120–2137.
Koradi, R., Billeter, M. and Wüthrich, K. (1996) J. Mol. Graph., 14, 51–55.
Lanchy, J.-M., Ehresmann, C., Le Grice, S.F.J., Ehresmann, B. and Marquet, R. (1996) EMBO J., 15, 7178–7187.
Lane, A.N., Ebel, S. and Brown, T. (1993) Eur. J. Biochem., 215, 297–306.
Liepinsh, E., Otting, G. and Wüthrich, K. (1992) Nucleic Acid Res.,
20, 6549–6553.
Luginbühl, P., Güntert, P., Billeter, M. and Wüthrich, K. (1996) J.
Biomol. NMR, 8, 136–146.
Mak, J. and Kleiman, L. (1997) J. Virol., 71, 8087–8095.
Mandel, A.M., Akke, M. and Palmer III, A.G. (1995) J. Mol. Biol.,
246, 144–162.
Marino, J.P., Schwalbe, H., Glaser, S.J. and Griesinger, C. (1996) J.
Am. Chem. Soc., 118, 4388–4395.
Marquet, R., Isel, C., Ehresmann, C. and Ehresmann, B. (1995)
Biochimie, 77, 113–124.
Müller, U., Maier, G., Onori, A.M., Cellai, L., Heumann, H. and Heinemann, U. (1998) Biochemistry, 37, 12005–12011.
Nakamura, H., Oda, Y., Iwai, S., Inoue, H., Ohtsuka, E., Kanaya, S., Kimura, S., Katsuda, C., Katayanagi, K., Morikawa, K., Miyashiro, H. and Ikehara, M. (1991) Proc. Natl. Acad. Sci. USA,
88, 11535–11539.
Nelson, H.C.M., Finch, J.T., Bonaventura, F.L. and Klug, A. (1986)
Nature, 330, 221–226.
Nishizaki, T., Iwai, S., Ohkubo, T., Kojima, C., Nakamura, H., Kyogoku, Y. and Ohtsuka, E. (1995) Biochemistry, 34, 4016– 4025.
Otting, G., Orbons, L.P.M. and Wüthrich, K. (1990) J. Magn.
Reson., 89, 423–430.
Piotto, M., Saudek, V. and Sklenáˇr, V. (1992) J. Biomol. NMR, 2, 661–665.
Rance, M., Sørensen, O.W., Bodenhausen, G., Wagner, G., Ernst, R.R. and Wüthrich, K. (1983) Biochem. Biophys. Res. Commun.,
117, 479–485.
Ravishankar, G., Swaminathan, S., Beveridge, D.L., Lavery, R. and Sklenar, H. (1988) J. Biomol. Struct. Dyn., 6, 669–699. Salazar, M., Fedoroff, O.Y., Zhu, L. and Reid, B.R. (1994) J. Mol.
Biol., 241, 440–455.
Salazar, M., Fedoroff, O.Y. and Reid, B.R. (1996) Biochemistry, 35, 8126–8135.
Sklénaˇr, V. and Bax, A. (1987) J. Magn. Reson., 74, 469–474. Smith, J.S. and Roth, M.J. (1992) J. Biol. Chem., 267, 15071–
15079.
Szyperski, T., Güntert, P., Otting, G. and Wüthrich, K. (1992) J.
Magn. Reson., 99, 552–560.
Szyperski, T., Fernández, C., Ono, A., Kainosho, M. and Wüthrich, K. (1998) J. Am. Chem. Soc., 120, 821–822.
Telesnitsky, A. and Goff, S.P. (1997) Retroviruses (Eds, Coffin, J.M., Hughes, S.H. and Varmus, H.E.), Cold Spring Harbor Laboratory Press, Cold Spring Harbor, NY, U.S.A., pp. 21–160. Temin, H.M. and Mizutani, S. (1970) Nature, 226, 1211–1213. Varani, G. and Tinoco Jr., I. (1991) Q. Rev. Biophys., 24, 479–532. Wahl, M.C. and Sundaralingam, M. (1995) Curr. Opin. Struct. Biol.,
5, 282–295.
Wang, A.C., Kim, S.G., Flynn, P.F., Chou, S.-H., Orba, J. and Reid, B.R. (1992) Biochemistry, 31, 3940–3946.
Weiner, S.J., Kollman, P.A., Nguyen, D.T. and Case, D.A. (1986) J.
Comput. Chem., 7, 230–252.
Wijmenga, S.S., Mooren, M.M.W. and Hilbers, C. (1993) In NMR of
Macromolecules. A Practical Approach (Ed., Roberts, G.C.K.),
Oxford University Press, Oxford, U.K., pp. 217–283.
Wüthrich, K. (1986) NMR of Proteins and Nucleic Acids, Wiley, New York, NY, U.S.A.
Zhu, L., Salazar, M. and Reid, B.R. (1995) Biochemistry, 34, 2372– 2380.
![Figure 1. Spectral region of a 2D [ 1 H, 1 H]-NOESY spectrum of r(gcaguggc) · r(gcca)d(CTGC) comprising the ω 1 (H1 0 )/ ω 2 (H6,H8) connectivities](https://thumb-eu.123doks.com/thumbv2/123doknet/14863133.636139/2.892.464.789.96.482/figure-spectral-region-noesy-spectrum-gcaguggc-comprising-connectivities.webp)
![Figure 2. 2D [ 13 C, 1 H]-HSQC spectrum recorded for the sugar moieties of r(gcaguggc) · r(gcca)d(CTGC)](https://thumb-eu.123doks.com/thumbv2/123doknet/14863133.636139/5.892.221.681.96.583/figure-hsqc-spectrum-recorded-sugar-moieties-gcaguggc-ctgc.webp)