RESEARCH PAPER
Real-time monitoring of immobilized single yeast cells
through multifrequency electrical impedance spectroscopy
Zhen Zhu&Olivier Frey&Felix Franke& Niels Haandbæk&Andreas Hierlemann
Received: 6 April 2014 / Revised: 30 May 2014 / Accepted: 5 June 2014 / Published online: 11 July 2014 # Springer-Verlag Berlin Heidelberg 2014
Abstract We present a microfluidic device, which enables single cells to be reliably trapped and cultivated while simul-taneously being monitored by means of multifrequency elec-trical impedance spectroscopy (EIS) in the frequency range of 10 kHz–10 MHz. Polystyrene beads were employed to char-acterize the EIS performance inside the microfluidic device. The results demonstrate that EIS yields a low coefficient of variation in measuring the diameters of captured beads (~0.13 %). Budding yeast, Saccharomyces cerevisiae, was afterwards used as model organism. Single yeast cells were immobilized and measured by means of EIS. The bud growth was monitored through EIS at a temporal resolution of 1 min. The size increment of the bud, which is difficult to determine optically within a short time period, can be clearly detected through EIS signals. The impedance measurements also re-flect the changes in position or motion of single yeast cells in the trap. By analyzing the multifrequency EIS data, cell mo-tion could be qualitatively discerned from bud growth. The results demonstrate that single-cell EIS can be used to monitor cell growth, while also detecting potential cell motion in real-time and label-free approach, and that EIS constitutes a sen-sitive tool for dynamic single-cell analysis.
Keywords Microfluidics . Single-cell analysis . Electrical impedance spectroscopy . Cell trapping . S. cerevisiae
Introduction
Cellular heterogeneity is a fundamental characteristic in any population of cells [1–4]. With the emergence of single-cell analysis methods, researchers have gained new insights into the mechanisms and kinetics of single-cell processes in cell biology, systems biology, and clinical biology [5–7]. The two most frequently used methods for single-cell analysis are flow cytometry [8] and microscopy. Flow cytometry provides high-throughput readout of cellular information based on fluores-cent markers in suspended cells. However, cells of a sampled population are measured at a defined time point while moving through the detector of the instrument, and therefore, only momentary cellular information can be extracted. It is difficult to track individual cells over an extended time with high temporal resolution. Time-lapse microscopy, in contrast, is a powerful method to obtain information on dynamic cellular behavior and detailed information on intracellular compo-nents. The resulting data can be assigned to monitored indi-vidual cells. Flow cytometry and microscopy imaging require fluorescently labeled cells or cellular compartments [9,10]. The labeling procedure, either by directly applying fluorescent stains, or by transfection of genetically encoded fluorophores into the cellular genome, may interfere with cellular functions. The rapid development of microfabrication technologies has fueled the application of microfluidic or lab-on-a-chip systems in the fields of biology, chemistry, and medical diag-nosis. Microfluidic systems, which may include multiple functions, provide new means to manipulate and study single cells [11,12]. For instance, alternating current (AC) electro-kinetics and electrical impedance spectroscopy (EIS) are elec-trical techniques that can be used to identify individual cells
Published in the topical collection Single Cell Analysis with guest editors Petra Dittrich and Norbert Jakubowski.
Z. Zhu (*)
:
O. Frey:
F. Franke:
N. Haandbæk:
A. Hierlemann Bio Engineering Laboratory (BEL), Department of Biosystems Science and Engineering (D-BSSE), ETH Zürich, Mattenstrasse 26, 4058 Basel, Switzerlande-mail: zhen.zhu@bsse.ethz.ch
Present Address: Z. Zhu
Key Lab of MEMS of Ministry of Education, Southeast University, Sipailou 2, Nanjing 210096, China
based on their size and dielectric properties [13,14] in a nonin-vasive and label-free approach. AC electrokinetics, primarily electrorotation (ROT) and dielectrophoresis (DEP), have been used to study the motion of cells exposed to an external AC electric field [15–17]. The dielectric properties of cells can be extracted from the measured ROT spectrum after an analysis based on a simplified single-shell model of the biological cells [18]. However, the throughput of ROT is limited, since it usually takes seconds to measure the rotation speed of a single cell. DEP, integrated within microfluidic systems, is more applicable to the manipulation and separation of single cells than their analysis [19,20]. In contrast, EIS enables the frequency-dependent mul-tiparameter readout of cellular and even subcellular information in a high-throughput setting [21,22] or dynamically [23]. EIS provides information related to the cell size at lower frequencies (from hundreds of kHz to MHz), related to the cell membrane capacitance at higher frequencies (several MHz), and informa-tion on intracellular features at even higher frequencies. By using microfabrication techniques, EIS can be integrated in microfluidic systems to detect single cells at high throughput and with good sensitivity.
Microfluidic devices with integrated EIS functions have been developed already for single-cell analysis in the past decade [13,14,21]. Most of those microfluidic devices, called electrical impedance cytometers, were used to characterize suspended biological samples in a flow-through setup. Holmes et al. has used impedance cytometry to identify T lymphocytes, monocytes, and neutrophils and, later, count CD4+ T cells in human whole blood for a point-of-care blood diagnostic system [24,25]. Impedance cytometry has also been used to charac-terize cell disease states [26] and identify the differentiation state of single stem cells [27]. Chen et al. [28] and Zheng et al. [29] have designed a specific impedance cytometer in which single cells were deformed to pass through a constriction chan-nel by aspiration. They used the measured impedance and transit time to classify different cell types. In order to measure single cells continuously through EIS, the function of cell seeding or cell immobilization has to be integrated into microfluidic systems by means of specifically designed elec-trode geometries or fluidic structures. Asphahani et al. has cultured adherent cells on metal electrodes and recorded the cellular response to drug treatment over a longer time period [30]. Ghenim et al. has monitored cell migration of single cells through EIS [31]. The variations in the measured impedance could be attributed to cell attachment, cell-substrate interaction, and cell motility. Park et al. [32] and Lan and Jang [33] have compared impedance magnitudes before and after capturing a single cell in a microfluidic trap, which enabled them to identify the presence/absence of single cells. Malleo et al. has shown the time-dependent measurements of single cell impedance in response to dynamic chemical perturbations [34].
To the best of our knowledge, EIS has not yet been used for real-time monitoring of cellular dynamics, e.g., cell growth, at
single-cell resolution. In this work, we have integrated EIS into a microfluidic device for single-cell analysis. The concept of single-cell manipulation has been characterized and validated previously [35,36] and has been adapted and extended with specifically designed electrodes. The device features reliable immobilization and the possibility to cultivate of single cells under controlled environmental conditions while performing real-time impedance measurements of the immobilized cells. Polystyrene beads have first been used to characterize the EIS function through size measurements of beads. Then, budding yeast, Saccharomyces cerevisiae, has been employed as a biological model organism in subsequent experiments. Differ-ent cell shapes during cell growth could be discriminated by using multifrequency EIS data. Moreover, cell immobilization in different orientations could be discerned. Finally, we have been able to continuously monitor the budding process and to detect potential movements of immobilized single yeast cells during measurements by extracting representative vectors from the multifrequency EIS data.
Materials and methods
Design and fabrication of the device
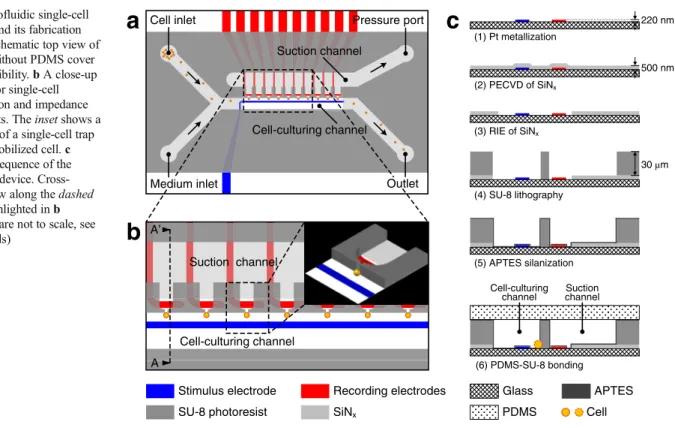
Figure 1a, bschematically shows the microfluidic single-cell EIS device and a 3D close-up of a cell trap. The fluidic network of the device consists of a cell-culturing channel (150μm wide), a suction channel (300 μm wide), and 10 cell traps that are formed as bottleneck-like horizontal orifices with 4-μm-wide necks. The cell traps, interconnecting the cell-culturing and suction channels, are located at one sidewall of the cell-culturing channel. Only one trap is used and monitored at a time during impedance measurements. The cell suspension and me-dium are continuously delivered into the cell-culturing channel at a flow rate of 0.5μl/min. To capture cells, an underpressure in the range of−30 to −5 mbar is applied to the suction channel via a precise pressure controller, and single cells are dragged to-wards the side of the channel by hydrodynamic forces. As soon as a single cell is captured at the monitored trap, the pressure is raised to and maintained at a value between +5 and +15 mbar to prevent the capturing of additional cells. The flow (total flow rate of 1μl/min) generates a relatively high pressure in the cell-culturing channel, so that there is still a sufficient pressure difference across the trap to reliably retain the immobilized cell at the trap, although the pressure has been raised to positive values (overpressure). The required pressure values have to be optimized at the beginning of each set of experiments.
The EIS function is integrated into the microfluidic device by patterning a common electrode (20μm wide) serving as the stimulus electrode in the cell-culturing channel and indi-vidual electrodes (20μm wide), working as recording elec-trodes, at each respective trap. When a cell is immobilized at a
trap, the impedance is measured by using the stimulus elec-trode and the corresponding recording elecelec-trode. The narrow neck of the bottleneck-like orifice has two functions. First, it prevents cells from passing into the suction channel, since the width of the neck is smaller than the diameter of the used cells. Second, the orifice constrains the electric current to flow through the small opening of the neck towards the recording electrodes. Any variation of the cross-sectional opening of the neck caused by bead/cell immobilization or cell growth will lead to a substantial change in the impedance signal and so that there is a high sensitivity of the impedance measurement to any change in the orifice. Potential electric crosstalk be-tween adjacent electrodes is reduced with a SiNx insulation layer, which has been deposited over the whole chip surface to cover all metal tracks. This SiNxlayer has been reopened only in the sensing regions close to the traps to define the electrodes and along the chip border to provide access to the electrical contact pads.
The microfluidic single-cell EIS device was fabricated by using a hybrid multilayer process as schematically shown in Fig.1c: (1) 200-nm-thick Pt electrodes with a 20-nm-thick TiW adhesion layer underneath were patterned on the Pyrex glass wafer by a lift-off process. (2) A 500-nm SiNxinsulation layer was deposited on the entire wafer by plasma-enhanced chemical vapor deposition (PECVD). (3) This SiNxlayer was reopened at the sensing and contact pad regions by reactive-ion etching (RIE). (4) A 30-μm-thick layer of SU-8 3025 photoresist (MicroChem, Co., USA) was spin-coated on top of the wafer and patterned to define the microfluidic channels
and traps. By using a mask aligner, SU-8 patterns were pre-cisely aligned with the Pt electrodes on the substrate. This alignment ensures accurate positioning of the cell traps be-tween the stimulus and recording electrodes. (5) The wafer was then diced into single chips. The SU-8 surface of each chip was modified with (3-aminopropyl)triethoxysilane (APTES) (Sigma-Aldrich Co., USA) in a vapor phase silanization process. (6) In order to seal the microfluidic channels irreversibly, each chip with the modified SU-8 sur-face was ultimately bonded to an unstructured poly(dimethyl-siloxane) (PDMS) (Sylgard® 184, Dow Corning Co., USA) cover with punched holes for fluidic inlets and outlets. The used materials, glass, SU-8, and PDMS feature excellent light transmittance, except for the 500-nm SiNx layer, which is slightly yellow. However, the SiNxhas been etched away in the sensing regions, so that completely transparent regions for optical observation of cell morphology are collocated with cell-trapping sites.
Experimental setup
The assembled microfluidic device was placed on a custom-made aluminum holder, which fits onto an inverted micro-scope stage (Olympus IX81, Olympus Co., Japan) for imag-ing. The device was clamped tightly between the aluminum holder and a poly(methylmethacrylate) (PMMA) cover by using screws. A printed circuit board (PCB), comprising manual switches and spring-loaded contacts, was positioned on top of the PMMA cover. These spring-loaded pins SU-8 photoresist SiNx
Cell inlet Medium inlet Pressure port Outlet Suction channel Cell-culturing channel
a
Cell-culturing channel Suction channel A A’b
Cell trapStimulus electrode Recording electrodes Glass PDMS APTES Cell
c
(1) Pt metallization (2) PECVD of SiNx (3) RIE of SiNx (4) SU-8 lithography (5) APTES silanization (6) PDMS-SU-8 bonding 30 µm 500 nm 220 nm Suction channel Cell-culturing channelFig. 1 Microfluidic single-cell EIS device and its fabrication process. a Schematic top view of the device without PDMS cover for better visibility. b A close-up of the area for single-cell immobilization and impedance measurements. The inset shows a 3D close-up of a single-cell trap with an immobilized cell. c Fabrication sequence of the microfluidic device. Cross-sectional view along the dashed line AA′ highlighted in b (dimensions are not to scale, see text for details)
contacted the electrode pads on the device when screwed to the aluminum holder. A commercial impedance spectroscope (HF2IS, Zurich Instruments AG, Switzerland) and a transimpedance amplifier (HF2TA, Zurich Instruments AG, Switzerland) were connected to the electrodes on the device via the PCB. For fluidic access, poly(tetrafluoroethylene) (PTFE) tubing (Bohlender GmbH, Germany) was connected through holes in the PMMA cover to the inlets and outlets of the device.
Beads, cell suspensions, and media were initially loaded into glass syringes (ILS Innovative Labor Systeme GmbH, Germany) and then delivered to the cell-culturing channel by using syringe pumps (neMESYS, Cetoni GmbH, Germany). The underpressure for capturing cells was applied to the pressure port of the suction channel by using a pressure controller (DPI 520, Druck Ltd., UK), supplied with in-house compressed air and vacuum. The instruments, including the impedance spectroscope, syringe pumps, and pressure controller, were controlled with a personal computer. Bead and cell preparation
Commercial monodisperse polystyrene (PS) beads (Fluka, Sigma-Aldrich Production GmbH, Switzerland) with standard diameters of 8 and 10μm (CV of the diameter calibration is 1.2 %, by manufacturer) were first employed for the EIS characterization inside the microfluidic device. Beads were mixed with 0.01 M phosphate-buffered saline (PBS) solution (Sigma-Aldrich Co., USA). Bead clusters in the suspension were mechanically separated into individual beads through ultrasonic agitation (Bioblock® Scientific 86480, Fisher Sci-entific GmbH, Germany). Finally, the resulting bead suspen-sion was loaded in a syringe.
Standard methods were used to grow cultures of budding yeast cells (S. cerevisiae). The used yeast cells were a diploid wild-type strain. Cells were grown in a complete synthetic medium made of 0.17 % yeast nitrogen base (YNB) (Difco™, BD GmbH, Germany), 0.5 % ammonium sulfate (Sigma-Aldrich Co., USA), and 2 % glucose sulfate (Sigma-(Sigma-Aldrich Co., USA) at 30 °C. The prepared yeast cell suspension was diluted to reach a concentration of approximately 1×10⁶cells/ ml in the cell-culturing medium. Before delivering the cell suspension and cell-culturing medium into the chip, the fluidic channels were flushed with 1 % bovine serum albumin (BSA) (Sigma-Aldrich Co., USA) solution in order to achieve a bubble-free channel network and a protein-coated channel surface to reduce stickiness for cells.
Electrical impedance spectroscopy
For an experiment, a bead/cell was captured at a trap, and an AC signal (Vsti, amplitude 1 V), swept over a frequency range from 10 kHz to 10 MHz and including 92 sampling
frequencies, was applied to the stimulus electrode by the impedance spectroscope. The resulting signal, received by the respective recording electrode, was amplified (gain G ) and converted to a voltage signal (Vrec ) through the transimpedance amplifier, and, ultimately, recorded by the impedance spectroscope. This recorded complex signal was displayed in the format of separated magnitude (A ) and phase (θ ) signals. In parallel, a bright-field image of the immobilized bead/cell was taken by means of the inverted microscope. Afterwards, the bead/cell was released by simply increasing the pressure in the suction channel. To measure the baseline characteristics (Ae andθe), which must be consistent during a series of measurements, the same impedance mea-surement was performed for the empty trap before and after particle immobilization. This measurement procedure was repeated for each immobilized bead/cell and provided a set of electrical impedance data with corresponding images for subsequent analysis. The budding process of immobilized yeast cells was monitored by using both EIS and time-lapse imaging at an interval of 1 min. The reference measurements of the empty trap were carried out before and after the cell impedance recording.
Deduced from Ohm’s law, the measured impedance can be expressed as follows:
Z ¼ Vð sti⋅GÞ=Vrec ð1Þ
Vrec¼ A⋅ejθ ð2Þ
Vsti and G are known values of the measurements. The impedance, Z, is therefore inversely proportional to the mea-sured voltage Vrec. Hence, the magnitude (A ) and phase (θ) signals recorded by the impedance spectroscope can be di-rectly used to display impedance variations during the exper-iments. In order to eliminate the variations of the electrode impedance and the surrounding bulk medium resistance, dif-ferential values have been employed: The impedance changes resulting from the immobilized bead/cell were calculated rel-ative to the values of the signals of the empty trap. The relrel-ative magnitude (Ar=A/Ae) was defined by dividing the magnitude signal when a bead/cell was trapped, through the magnitude signal of the empty trap. The relative phase (θr=θ−θe) was defined by subtracting the phase signal of the empty trap from that of the trap with an immobilized bead/cell.
Data analysis of multifrequency EIS signals
To analyze if the EIS signals alone contain enough informa-tion to determine the orientainforma-tion and growth state of each cell, we represented each measurement of a cell as a vector in a
184-dimensional feature space (92 dimensions for the relative magnitude and 92 dimensions for the relative phase at 92 frequencies). Having more dimensions than data points might, however, pose problems for classification through, e.g., over fitting. Therefore, we projected all data points into a low-dimensional subspace: we used principal component analysis (PCA) [37], an established orthogonal projection method. We computed the covariance of all data points and projected each data point on its first two eigenvectors, the“principal compo-nents” (PCs). We estimated the number of necessary PCs so that more than 80 % of the variance of the original data was represented in the projected subspace. All data points in the subspace were then classified using linear discriminant anal-ysis (LDA) [38] and leave-one-out cross validation. If the group, which a cell was assigned to, was identical to the original group, we counted it as a correct classification, oth-erwise as an error.
Next, we investigated if cell motion and bud growth could be discriminated according to the asso-ciated impedance signal variations. In contrast to the method detailed above, we here used temporally re-solved data, i.e., multiple measurements per cell. We computed, for each cell individually, the first PC over all measurements. We averaged all first PCs of cells that were visually identified as either growing or moving and obtained two vectors, which were nor-malized to unit length: pgrowth and pmotion . The two vectors represent the dimensions, along which the cell motion and bud growth cause largest variations in the EIS data. For better visualization, these two vectors were orthogonalized:
bpgrowth¼ pgrowth−pmotion pgrowth;pmotion
D E
ð3Þ
bpmotion¼ pmotion−pgrowth pmotion;pgrowth
E D
ð4Þ
Then, all recorded impedance data points were projected in the space spanned bybpgrowth and bpmotion, to recognize and qualify the effects of bud growth and cell motion.
Results and discussion Characterization of EIS
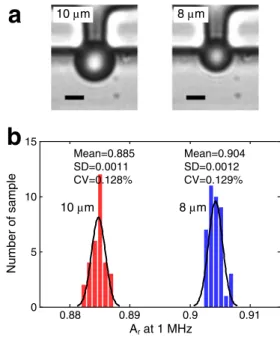
To characterize the functionality and sensitivity of the microfluidic single-cell EIS device, we performed impedance measurements of immobilized PS beads with two different diameters, 8 and 10 μm. Figure 2 shows two images of
immobilized beads as well as the measurement results of 72 beads in total, plotted as relative magnitude at 1 MHz. One megahertz was chosen as a common frequency in the bead characterization here and the cell measurements later on. The two groups of beads can be clearly discriminated, as can be seen in Fig.2b. The mean value of the relative magnitude at 1 MHz in the case of 10-μm beads is 0.885±0.0011, which is lower than that of 8-μm beads, 0.904±0.0012. The signal difference between the two groups of beads is caused by the difference in the cross-sectional opening of the cell-trapping orifice obstructed by the immobilized beads. A 10-μm bead obstructs more of the orifice cross-sectional area than an 8-μm bead, thereby remaining a smaller cross-sectional opening, through which the electric current flows. Therefore, the mea-sured impedance is higher when a 10-μm bead is immobilized, which leads to a lower relative signal magnitude (Ar=A/Ae) than that upon immobilization of an 8-μm bead. Moreover, the small CV (~0.13 %) within each group of beads demonstrates the high sensitivity and precision of the microfluidic single-cell EIS device in measuring the size of immobilized particles.
Measuring cell growth states of budding yeast through EIS Cell growth of budding yeast is accompanied with corre-sponding morphological changes. Cells can be classified into unbudded and budded cells in a first simple approach. We observed that cells with small buds tend to lie down flat on the horizontal substrate with the bud pointing inside or outside the
8 µm 0.88 0.89 0.9 0.91 0 5 10 15 Nu mb er o f samp le Arat 1 MHz 8 µm Mean=0.904 SD=0.0012 CV=0.129%
b
a
10 µm 10 µm Mean=0.885 SD=0.0011 CV=0.128%Fig. 2 Characterization results of the microfluidic single-cell EIS device by using PS beads. a Images of immobilized single 10- and 8-μm beads at a trap. Scale bar is 5μm. b Histograms of impedance measurements of 10-μm (n=31) and 8-μm (n=41) beads plotted as the relative magnitude Ar=A/Ae
trapping orifice as a consequence of hydrodynamic forces. In contrast, cells at a more advanced growth state with larger buds, i.e., with buds of a diameter larger than the width of the cell-trapping orifice, can be retained at the trap in a vertical position. Figure3shows representative microscopy images of typical orientations of immobilized single yeast cells and their corresponding cross-sectional views in schematics, including an unbudded cell (UB, Fig.3a), a horizontally immobilized cell with the bud inside the trap (HBI, Fig.3b), a horizontally immobilized cell with the bud outside the trap (HBO, Fig.3c), and a vertically immobilized cell with the bud and mother cell stacked vertically (VB, Fig.3d).
For an empty trap (Fig. 3e), the measured impedance includes the electrical double-layer capacitances (Cdl1, Cdl2) and the resistances (Re1, Re2) of both electrodes, and the impedance (Zte ) of the bulk medium across the empty trap, which consists of a resistance (Rte) and a capacitance (Cte) in parallel. Thus, the impedance across the stimulus and record-ing electrodes is as follows:
Ze¼ Re1þ Re2þ 1 jωCdl1 þ 1 jωCdl2 þ Zte ð5Þ
For a trap with an immobilized cell as shown in Fig.3a–d, an additional element, the impedance (Zc or Zc′) of the immobilized cell, is added in parallel to the impedance (Ztc or Ztc′) of the bulk medium across the trap. The cell impedance is composed of the cell membrane capacitance (Cmcor Cmc′) and the Ohmic cell resistance (Rcor Rc′). Hence, the modeled impedance of a trap with an immobilized unbudded cell in Fig.3ais the following:
Zubc¼ Re1þ Re2þ 1 jωCdl1 þjωC1 dl2 þ ZtckZc ð6Þ
The modeled impedance of a trap with a budded cell in Fig.3dcan be expressed as follows:
Zbc¼ Re1þ Re2þ 1 jωCdl1þ 1 jωCdl2þ Ztc 0 Zc 0 ð7Þ
From the three formulas above, we can see that several factors collectively influence the measured impedance of a trap with an immobilized cell: The impedance of the elec-trodes, the impedance of the bulk medium across the trap (Zte, Ztc, or Ztc′), and the impedance of the immobilized cell (Zcor Zc′). Generally, the impedance of electrodes, including the resistances (Re1and Re2) and the double-layer capacitances (Cdl1and Cdl2), are present in measurements at low frequen-cies, typically below 100 kHz. This portion of the impedance
c
b
a
d
Empty trape
UB HBI HBO VB Stimulus electrode Recording electrode Cdl2 Zte Re2 Cdl1 Re1 Rte Cte Glass substrate PDMS SU-8 Cdl2 Z ’tc Cmc’Rc’ Cmc’ Zc’ Re2 Cdl1 Re1 Glass substrate PDMS SU-8 Glass substrate PDMS SU-8 Glass substrate PDMS SU-8 Cdl2 Ztc CmcRcCmc Zc Re2 Cdl1 Re1 Glass substrate PDMS SU-8Fig. 3 Images of immobilized single yeast cells in all observed orientations and their corresponding cross-sectional views in sche-matics with the impedance components of the equivalent circuits. a UB, unbudded cell. b HBI, horizontally immobilized cell with bud inside the trap. c HBO, horizontally immobilized cell with bud outside the trap. d VB, vertically immobilized cell with mother cell and bud stacked vertically. e Empty trap. Buds are marked with arrowheads. Scale bar is 5 μm
stays relatively constant whether there is a cell immobilized or not, because it depends on the characteristics of the electrode and the surrounding medium. When a cell is immobilized, the impedance of the bulk medium across the trap, Ztc or Ztc′, increases, since the yeast cell with its volume blocks a signif-icant portion of the trapping orifice and forces the electric current to flow around the obstacle through a reduced open-ing. The impedance, therefore, is dominated by the parallel resistance of the cell and the trap, which will consequently show a variation in the magnitude spectrum of the EIS signals
at frequencies typically below 1 MHz. At higher frequencies, from hundreds of kilohertz on, the electric current starts to penetrate the cell wall and plasma membrane partially. Thus, the capacitance of the cell membrane will lead to a variation in the phase spectrum especially around several megahertz, in clear contrast to the phase spectrum of an empty trapping site. This variation is most pronounced for a VB cell (Fig. 3d), which blocks the largest fraction of space of the trapping orifice and features more cell membrane areas in comparison to a UB cell. Therefore, it is expected that UB and VB cells are
0.2 0.6 1 1.4 1.8 0.87 0.89 0.91 0.93 0.95 0.97 Ar a t1 0 0 kHz rat 900 kHz [°] UB HBI HBO VB HBI HBI
a
d
b
c
e
f
1 1.5 2 2.5 3 3.5 4 4.5 0.87 0.89 0.91 0.93 0.95 0.97 rat 4 MHz [°] Ar at 1 MHz VB UB HBI HBO VB Score on 1stPC [a.u.] S co re on 2 nd PC [a .u.] -3 -2 -1 0 1 2 5 6 7 8 9 10 UB HBI HBO 0.88 0.92 0.94 0.96 0.98 1 Ar 104 105 106 107 Frequency [Hz] 1 MHz 100 kHz 0.90 UB HBI HBO VB -2 -1 0 1 2 3 4 r [°] 104 105 106 107 Frequency [Hz] 4 MHz 900 kHz UB HBI HBO VB 104 105 106 107 1 2 3 4 5 6 x 10⁻³ Frequency [Hz] A[ V ] -220 -200 -180 -160 -140 -120 [° ] UB HBI HBO VB Empty trapFig. 4 Multifrequency EIS of immobilized single yeast cells: UB (n= 34), HBI (n=10), HBO (n=13), and VB (n=11), with reference measure-ments of the empty traps. a Magnitude and phase spectra of raw signals over the swept frequency range from 10 kHz to 10 MHz. b, c Relative magnitude and phase spectra. The color curves and shaded regions in a, b, and c represent the mean values and standard deviations in the mea-surements, respectively. d Separation of VB cells by using the relative magnitude at 1 MHz versus the relative phase at 4 MHz shown in a scatter
plot. e Separation of HBI cells by using the relative magnitude at 100 kHz versus the relative phase at 900 kHz shown in a scatter plot. Inserts show images of cell samples. Buds are marked with arrowheads. Scale bar is 5μm. f Discrimination of UB, HBI, and HBO cells by means of LDA on the full multifrequency data set (projections on first two PCs shown). Colored areas depict the regions in which a cell sample is assigned to the respective group, and dashed lines show classification boundaries
distinguishable according to their impedance magnitude and phase signals.
Figure4 shows the results of impedance measurements of immobilized cells in all four orientations that have been men-tioned above and of the empty trap as reference. Among the four groups of cells, one can observe differences in the magni-tude spectra of EIS signals, especially at low frequencies from 100 kHz to a few megahertz, while the differences in the phase spectra are more pronounced at high frequencies above 1 MHz (Fig.4a). The relative magnitude and phase signals in Fig.4b, c
give a better representation of those signal differences. Selected frequencies at which the relative magnitude and phase vary most between the four groups have, therefore, been chosen to classify the orientations of immobilized cells. The largest dif-ferences can be observed in the relative magnitude spectra at around 1 MHz and in the relative phase spectra at around 4 MHz. By using the corresponding data at those two frequen-cies, VB cells can be clearly separated from the other cells, as shown in Fig.4d. The differences between the EIS signals of the VB cells and the other groups of cells mainly arise from the additional volume of the bud. Compared to horizontally immobilized cells, the vertical stack of bud and mother cell of a VB cell obstructs a larger cross-sectional area of the cell-trapping orifice, which is reflected in the EIS signals. In some cases, VB-classified cells do not feature a perfectly vertical stack of bud and mother cell. An example is inserted as a picture in Fig.4d. The values of the EIS signals are, in this case, closer to those of horizontally immobilized cells.
HBI cells can be discriminated from the data clusters of UB, HBI, and HBO cells by means of the relative magnitude and phase signals at other frequencies, as shown in Fig.4e. Distinct signal differences of immobilized HBI cells occur at around 100 kHz in the relative magnitude spectra (Fig.4b) and at around 900 kHz in the relative phase spectra (Fig.4c), compared to those of VB, HBO, and UB cells. Plotting the signals of all measured cells at these two frequencies allows for separating three clusters of cell orientations. The buds of HBI cells are oriented horizontally towards the inside of the trap. This orientation of buds, in contrast to the vertically stacked buds, obstructs less of the cross-sectional opening of the cell-trapping orifice and consequently leads to a smaller impedance change. Further, compared to UB cells, the buds of HBI cells are still situated in the opening of the orifice, thereby influencing the impedance values. However, some cells with small buds, as for example, the cell shown in the left image inserted in Fig.4e, are difficult to distinguish from UB and HBO cells solely on the basis of EIS data.
It is difficult to discriminate HBO cells from UB cells by simply looking at the spectra of the relative signals over the whole frequency range, since the buds of HBO cells are often dragged to the downstream side of the trap by flow-induced hydrodynamic forces (see Fig.3c). In such a scenario, a bud, even though it may feature a big volume, does not produce
any effective contribution to cross-sectional obstruction of the cell-trapping orifice, so that no distinctive feature or change in the EIS signal is observed. The multifrequency EIS data were, therefore, analyzed by means of PCA. Since VB cells can be directly discriminated through the EIS data (Fig. 4d), only UB, HBI, and HBO cells have been classified by LDA based on the first and second PCs (accounting for 89 % of the variance), through PCA, as shown in Fig.4f. The three orien-tations of immobilized cells can be classified into 3 groups with 14 out of 57 misclassifications (20 % average error rate per class, leave-one-out cross-validation, 67 % chance error rate). It can be seen that some HBO and UB cells are not located with their class boundaries, which shows the limita-tion of the current system. Some of the misclassificalimita-tions can be explained by the small size of the bud, which, for an HBO-classified cell, lies outside of the trap and only minimally contributes to an impedance variation. Therefore, HBO cells with small buds show, over all frequencies, EIS signal values that are similar to those of UB cells.
Overall, all four orientations of immobilized single yeast cells can be discriminated either by directly using the relative impedance signals at specific frequencies or by using statisti-cal analysis of the multifrequency EIS data. VB cells display more distinct features that can be used for classification in comparison to other cell orientations. Therefore, the vertical immobilization of single yeast cells yields the highest sensi-tivity for monitoring cell growth and the budding process by means of EIS and will be used in the next sections.
b
Rec 1 Rec 2 Rec 3 Rec 4 Rec 5 0 2 4 6 8 10 -8 -6 -4 -2 0 Time [min] x 10-3 Ar a t1M H z 5 min Rec 2 Mother cell Mother cellFig. 5 Real-time EIS recordings of the budding process of five immobilized single yeast cells. a Images of an immobilized budding yeast cell at the beginning and the end of Rec 2. Buds are marked with arrowheads. Scale bar is 5μm. b Growth curves displayed as variations in relative magnitude signals at 1 MHz versus time
Real-time monitoring of bud growth through EIS
Budding yeast, S. cerevisiae, proliferates in that the new cell (daughter) develops from a bud on the old cell (mother) at one particular site. The dynamic budding process of vertically immobilized budding cells was re-corded in real-time by using simultaneously EIS and time-lapse imaging. Figure 5a shows the microscopy images of an immobilized yeast cell at the beginning and end of a recording. Figure 5b shows five independent EIS-based recordings of the budding process of five different yeast cells plotted as the variation of relative magnitude at 1 MHz versus time. It can be clearly seen that the relative magnitude signals of all five cells decrease over the re-cording period. The magnitude decrease is attributed to the growth of the bud, which obstructs more and more cross-sectional area of the cell-trapping orifice and, consequent-ly, induces an increase in the measured impedance. The bud growth can be clearly detected through the signal variations in the impedance measurements, even within a comparably short time period (Rec 2). In contrast, the size increase of a bud during 5 min is hardly measurable by optical images (Fig. 5a). The relative magnitude variation between the empty trap before and after the recordings at 1 MHz in Figs.5 and 6 is below 1×10⁻³, a value, which is much smaller than the signal variations derived from the cellular dynamics. The measured signals can, therefore, be clearly assigned to bud growth and demonstrate suffi-cient stability, sensitivity, and temporal resolution of the EIS method for real-time monitoring of vertically immobilized yeast cells.
Real-time monitoring of cell motion/growth through EIS In order to monitor the entire budding process of S. cerevisiae by using EIS, a mother cell with a tiny bud has to be captured, held in place, and will then be recorded. The continuous medium flow along the traps may, however, cause a move-ment of the immobilized cell, since the bud is initially too small to be clamped in the cell-trapping orifice. Figure 6a
shows time-lapse images of a cell starting with a tiny bud and then growing the bud size during 42 min. During the recording, we can observe several movements. At 7 min, the bud together with the mother cell starts to rotate into a more upright position so that the contours of the bud in the optical image partially overlap with that of the mother at around 12 min. This rotation leads to a sudden drop in the magnitude signal of EIS recording (Fig.6b), as the cell with the bud in a more vertical orientation obstructs more of the orifice open-ing. The medium flow then pushes the growing bud towards the right side of the orifice, where the further growth of the bud becomes almost invisible in the impedance measurement. Between 29 and 30 min, the immobilized cell again undergoes an upward rotation, which results in a stronger overlap of the bud and mother cell contours in the optical image. This rotation also triggers a steep decrease in the magnitude signal. Moreover, some cells with an already large bud, which had been initially trapped vertically (VB), also moved and changed their orientations during EIS recording. This motion and reorientation can be attributed to the growth of buds, which squeezed the mother cells out of the trap. Figure 6c
shows the time-lapse images of such an event. At 0 min, a budding yeast cell has been immobilized with its bud and
0 min 7 min 11 min 12 min
42 min 30 min 29 min
a
b
0 10 20 30 40 0.91 0.92 0.93 0.94 0.95 Time [min] 7m in 11 min 12 min 29 min 4 2m in 30 mi n Ar at 1 M Hzc
18 min 9 min 5 min 0 min Mother cell 4 min 3 min 2 mind
0 5 10 15 20 0.85 0.875 0.9 0.925 0.95 Time [min] Ar at 1 M Hz 18 min 9m in 2 m in 3 min 4m in 5m inFig. 6 Real-time EIS recordings of cell motion of immobilized budding yeast cells. a Images at defined time points showing an immobilized cell with its bud growing and moving around in the trap. b Recorded bud growth and movement, displayed as relative magnitude signal at 1 MHz versus time. c Images at specific time points showing the bud of an immobilized cell at the trap with the mother cell moving towards the outside of the trap. d Recorded cell movement displayed as relative magnitude signal at 1 MHz versus time. In a and c, buds are marked with arrowheads, and the scale bar is 5μm
mother cell stacked vertically. As the bud grows within the first 5 min, the mother cell is squeezed out of the trap and then remains in the resulting position until the end of the recording (18 min). This cell movement is analogous to a class transition from VB to HBO. Accordingly, the relative magnitude in the real-time EIS recording increases during the movement of the mother cell (Fig.6d). Once in the horizontal position, the signal remains relatively constant. Compared to the growth-only recordings in Fig.5b, the curve in Fig.6dshows different characteristics: the move of the mother cell into a more hori-zontal position decreases the fraction of obstructed cross-sectional opening area of the cell-trapping orifice, thereby decreasing the measured impedance, which, consequently, gives rise to an increase of the relative magnitude signal.
As is evident from the results above, any motion of the immobilized budding yeast cell, of the mother cell or of the bud, affects the EIS signals to a much larger extent than the potential signal variation during growth or upon a size in-crease of the bud. However, this issue can, to some extent, be addressed by using the complete multifrequency EIS data set and conducting a statistical analysis as described in the“Data analysis of multi-frequency EIS signals” section. Two vectors,
which represent cell growth and cell motion, have been ex-tracted from all data sets and the associated image information (cell relative position with respect to orifice). Then the record-ings of Figs.5and6have been projected with respect to these two vectors. The results are shown in Fig.7. We cans see that the data points of the bud-growth recordings are aligned with the growth vector, whereas the data points of the recordings that include cell motion are prevailingly aligned along the motion vector. Since the cell in Mot 1 moves from a horizontal position to a more vertical position, whereas the cell in Mot 2 transits from a VB to a HBO orientation, the data points of the
two recordings align along opposite directions in Fig.7. More-over, the more horizontal sections of Mot 1 reflect the bud growth of the cell, which can be correlated to the respective periods in Fig.6b(12–29 and 30–42 min). The
multifrequen-cy EIS recording data can be used to qualitatively correlate the variation in impedance signals to cell activities, i.e., cell growth and cell motion for the given device and immobiliza-tion scenario.
Conclusion
A microfluidic device that combines immobilization and lo-calized multifrequency electrical impedance measurements of single cells has been presented in this work. Monodisperse polystyrene beads have been used to characterize the device and yielded results that demonstrate the high precision of measuring the size of particles through EIS.
The experiments using budding yeast cells, S. cerevisiae, have validated the functionality and sensitivity of the EIS-integrated microfluidic device. The yeast cells have been captured in different orientations as a consequence of the specific configuration of the cell traps and of the cell mor-phologies (with buds or without buds). VB and HBI cells have been discriminated from other immobilized single yeast cells directly by using the raw data of the impedance measure-ments. By analyzing the multifrequency EIS data with PCA, HBO and UB cells have been classified with 20 % misclassi-fication. Among the four potential orientations of immobilized cells, VB cells, where the bud and the mother cell are stacked vertically, can be most sensitively monitored by impedance measurements. The signal contribution of the buds is largest in VB orientation so that this orientation has been chosen to perform real-time monitoring of bud growth. The budding process of vertically immobilized yeast cells has been suc-cessfully monitored by using EIS. Only cells with a large enough pre-developed bud can be vertically immobilized and reliably measured as a consequence of the geometry of the cell traps, and the accessible recording periods are rela-tively short (10 min). Moreover, the immobilized yeast cells are subject to movements induced by either the medium flow or the growth of bud. These movements significantly influ-ence the EIS signals and may completely mask a bud-growth-induced signal variation. By extracting vectors, which repre-sent cell growth and cell motion, from the multifrequency EIS data, a potential movement of immobilized single cells can be identified during the cell growth process.
In summary, the results demonstrate that multifrequency EIS enables real-time monitoring of cell growth and cell motion at immobilization sites. We believe that EIS provides a sensitive approach for dynamic analysis of single-cell pro-liferation in real-time and label-free monitoring. The microfluidic device and the immobilization geometry (defined
-0.5 0 0.5 1 1.5 -2 0 2 4 6
Growth vector [a.u.]
Motion
vector
[a.u.]
Rec 1 Rec 2 Rec 3 Rec 4 Rec 5 Mot 1 Mot 2Fig. 7 Projection of multifrequency EIS data with respect to cell growth and cell motion vectors, which show the possibility to discriminate cell activities during the overall recording duration. Rec 1 to Rec 5 are from the five bud-growth recordings in Fig.5. Mot 1 and Mot 2 represent the two cell motion/growth recordings in Fig.6. For each recording, the temporally first data point was set to (0, 0) for better illustration
cell orientation and stable cell positioning) will have to be optimized so as to allow for long-term impedance recordings without cell movement.
Acknowledgments The yeast cells used in this study were kindly supplied by Diana Ottoz and Dr. Fabian Rudolf, ETH Zurich, D-BSSE, CSB Group. This work was financially supported through the Swiss SystemX.ch program within the RTD project“CINA”, the Commission for Technology and Innovation (CTI project) in Switzerland, and the ERC Advanced Grant NeuroCMOS (AdG 267351). Zhen Zhu received indi-vidual funding from the Chinese Scholarship Council.
References
1. Altschuler SJ, Wu LF (2010) Cell 141:559–563
2. Dexter DL, Kowalski HM, Blazar BA, Fligiel Z, Vogel R, Heppner GH (1978) Cancer Res 38(10):3174–3181
3. Dexter DL, Spremulli EN, Fligiel Z, Barbosa JA, Vogel R, VanVoorhees A, Calabresi P (1981) Am J Med 71(6):949–956 4. Elowitz MB, Levine AJ, Siggia ED, Swain PS (2002) Science
297(5584):1183–1186
5. Fritzsch FSO, Dusny C, Frick O, Schmid A (2012) Annu Rev Chem Biomol Eng 3(1):129–155
6. Schubert C (2011) Nature 480(7375):133–137
7. Di Carlo D, Lee LP (2006) Anal Chem 78(23):7918–7925 8. Macey MG (2007) Flow cytometry: principles and applications.
Humana, Totowa
9. Nolan JP, Sklar LA (1998) Nat Biotech 16(7):633–638 10. Krutzik PO, Nolan GP (2006) Nat Methods 3(5):361–368 11. Lecault V, White AK, Singhal A, Hansen CL (2012) Curr Opin Chem
Biol 16(3–4):381–390
12. Yin H, Marshall D (2012) Curr Opin Biotech 23(1):110–119 13. Morgan H, Sun T, Holmes D, Gawad S, Green NG (2007) J Phys D:
Appl Phys 40(1):61–70
14. Heileman K, Daoud J, Tabrizian M (2013) Biosens Bioelectron 49: 348–359
15. Holzapfel C, Vienken J, Zimmermann U (1982) J Membr Biol 67(1):13– 26
16. Jones TB (2003) IEEE Eng Med Biol 22(6):33–42
17. Gawad S, Cheung K, Seger U, Bertsch A, Renaud P (2004) Lab Chip 4(3):241–251
18. Han SI, Joo YD, Han KH (2013) Analyst (Cambridge, U K) 138(5): 1529–1537
19. Valero A, Braschler T, Rauch A, Demierre N, Barral Y, Renaud P (2011) Lab Chip 11(10):1754–1760
20. Vahey MD, Pesudo LQ, Svensson JP, Samson LD, Voldman J (2013) Lab Chip 13(14):2754–2763
21. Sun T, Morgan H (2010) Microfluid Nanofluid 8(4):423–443 22. Haandbaek N, Burgel SC, Heer F, Hierlemann A (2014) Lab Chip
14(2):369–377
23. Yang L, Arias LR, Lane T, Yancey M, Mamouni J (2011) Anal Bioanal Chem 399(5):1823–1833
24. Holmes D, Pettigrew D, Reccius CH, Gwyer JD, van Berkel C, Holloway J, Davies DE, Morgan H (2009) Lab Chip 9(20):2881–2889 25. Holmes D, Morgan H (2010) Anal Chem 82(4):1455–1461 26. Du E, Ha S, Diez-Silva M, Dao M, Suresh S, Chandrakasan AP
(2013) Lab Chip 13(19):3903–3909
27. Song H, Wang Y, Rosano JM, Prabhakarpandian B, Garson C, Pant K, Lai E (2013) Lab Chip 13(12):2300–2310
28. Chen J, Zheng Y, Tan Q, Shojaei-Baghini E, Zhang YL, Li J, Prasad P, You L, Wu XY, Sun Y (2011) Lab Chip 11(18):3174–3181 29. Zheng Y, Shojaei-Baghini E, Azad A, Wang C, Sun Y (2012) Lab
Chip 12(14):2560–2567
30. Asphahani F, Wang K, Thein M, Veiseh O, Yung S, Xu J, Zhang MQ (2011) Phys Biol 8(1):15006
31. Ghenim L, Kaji H, Hoshino Y, Ishibashi T, Haguet V, Gidrol X, Nishizawa M (2010) Lab Chip 10(19):2546–2550
32. Park H, Kim D, Yun KS (2010) Sens Act B 150(1):167–173 33. Lan KC, Jang LS (2011) Biosens Bioelectron 26(5):2025–2031 34. Malleo D, Nevill JT, Lee LP, Morgan H (2010) Microfluid Nanofluid
9(2–3):191–198
35. Zhu Z, Frey O, Ottoz DS, Rudolf F, Hierlemann A (2012) Lab Chip 12(5):906–915
36. Zhu Z, Frey O, Haandbaek N, Ottoz DS, Rudolf F, Hierlemann A (2013) In: Proceedings of the international conference on solid state sensors and actuators, transducers’13. Barcelona, Spain, pp 1527– 1530
37. Jolliffe IT (2002) Principle component analysis, 2nd edn. Springer, New York
38. McLachlan GJ (2004) Discriminant analysis and statistical pattern recognition. Wiley, Hoboken