HAL Id: hal-00474896
https://hal.archives-ouvertes.fr/hal-00474896
Submitted on 4 May 2021HAL is a multi-disciplinary open access
archive for the deposit and dissemination of sci-entific research documents, whether they are pub-lished or not. The documents may come from teaching and research institutions in France or abroad, or from public or private research centers.
L’archive ouverte pluridisciplinaire HAL, est destinée au dépôt et à la diffusion de documents scientifiques de niveau recherche, publiés ou non, émanant des établissements d’enseignement et de recherche français ou étrangers, des laboratoires publics ou privés.
Platinum/ceria/alumina catalysts on microstructures for
carbon monoxide conversion
G. Germani, Pierre Alphonse, Matthieu Courty, Yves Schuurman, Claudine
Mirodatos
To cite this version:
G. Germani, Pierre Alphonse, Matthieu Courty, Yves Schuurman, Claudine Mirodatos. Plat-inum/ceria/alumina catalysts on microstructures for carbon monoxide conversion. Catalysis Today, Elsevier, 2005, 110 (1-2), pp.114-120. �10.1016/j.cattod.2005.09.017�. �hal-00474896�
Platinum/ceria/alumina catalysts on microstructures for
carbon monoxide conversion
G. Germani, P. Alphonse, M. Courty, Y. Schuurman
and C. Mirodatos
Institut de Recherches sur la Catalyse, CNRS, 2 Avenue Albert Einstein, 69626 Villeurbanne, France
CIRIMAT, UMR-CNRS 5085, Université Paul Sabatier, 118 route de Narbonne, 31062 Toulouse Cedex 04, France
Abstract
Platinum/ceria/alumina catalysts have been prepared by a sol–gel method and coated in the microchannels of stainless steel platelets. These catalysts are very active for the water-gas shift reaction between 300 and 400 °C. Moreover, they are non-pyrophoric and thus well suited for the purification of hydrogen for PEM fuel cells. The obtained coatings show good adherence and catalytic activity. The influence of the amount of platinum and ceria as well as the effect of a binder on the catalytic performance has been investigated. The samples have been characterized before reaction by XRD, SEM and by N2 adsorption measurements. The
kinetics, free from internal diffusion limitations, over these thin films have been described by a power law rate equation. An activation energy of 86 kJ/mol has been found and at 260 °C the TOF corresponds to 0.6 ± 0.1 s−1 for all investigated samples. The superior activity of the platelets compared to the powder samples is attributed to the diffusion limitations inside the powder pellets. Thus catalysts deposited on microstructured platelets lead to a better platinum utilization.
Keywords: Water-gas shift; Hydrogen purification; Microreactors; Kinetics; sol–gel; Catalyst
1. Introduction
2. Experimental
2.1. Experimental set-up
2.2. Synthesis of sols
2.3. Coating of the microstructured plates
2.4. Characterization of catalysts
3. Results
3.1. Activity tests
3.2. X-ray diffraction
3.3. Electron microscopy
3.4. Porosity and surface area by gas adsorption
4. Discussion
5. Conclusions
Acknowledgements
References
1. Introduction
The generation of high-purity hydrogen is required for efficient operation of the solid polymer electrolyte membrane (PEM) fuel cell. This hydrogen can be produced from
hydrocarbon fuels or alcohols by a reforming step. This typically yields a mixture of
hydrogen, carbon monoxide, carbon dioxide and steam. The carbon monoxide level must be reduced below 50 ppm to avoid poisoning of the fuel cell electrodes [1]. This is generally accomplished in several steps that might include the high and low temperature water-gas shift (HT-/LT-WGS) as well as a preferential oxidation step. The WGS converts CO into CO2 by
the reaction with water over a suitable catalyst and provides additional hydrogen. The reaction generally attains thermodynamic equilibrium. Two types of catalysts are commonly used in industry: a FeCr based catalyst for HT-WGS and a CuZn catalyst for LT-WGS. The volume of the WGS takes a considerable part of the overall fuel processor due to the thermodynamic constraint to operate at the lowest possible temperatures to achieve high conversions. At these low temperatures most catalysts are not very active. In view of new applications such as on board hydrogen generation for PEM fuel cells, more active catalyst formula are required for down-scaling the reformer, together with fast response, long catalyst lifetime and non-pyrophoric materials [2].
Several new WGS catalysts have been reported in the literature such as Au/Fe2O3 [3]
promising catalysts for fuel cell applications as they are highly active in the range of 250– 400 °C and they are non-pyrophoric. However these catalysts are expensive and optimum use of the precious metal is required. Metal microstructured platelets which allow a precise temperature control and the use of thin catalyst layers that lead to high efficiency could meet the on board reformer requirements as new compact and efficient systems [11]. This paper reports on the development of platinum/ceria/alumina catalysts on microstructured platelets for the WGS reaction. The focus is on developing methods that lead to strongly adhesive and stable catalyst layers on stainless steel plates that retain their high activity. Sol–gel methods were selected for this purpose, on the basis of literature results [12] and lab experience. It is shown that this strategy leads indeed to a better usage of the precious metal.
2. Experimental
2.1. Experimental set-up
The used microstructured platelets are made of stainless steel and have the following dimensions: 50 mm × 50 mm × 1 mm, containing 49 channels 400 m deep and 600 m wide. The steel grade was ASTM 316Ti (DIN 1.4571). They are placed together with some filler plates inside a stainless steel housing. Care was taken to assure that no bypassing of the gas occurred. In the initial experiments bypassing was revealed by the fact that the
thermodynamic equilibrium was not attained at higher temperatures. By using the proper filler platelets this issue has been solved. The housing is sealed with graphite rectangular seals. This housing allows a proper gas distribution through the microstructured platelets. Moreover, it can be opened up after reaction and the platelets can be taken out for analysis purposes. The heating is provided by means of six 500 W heating cartridges inserted into the housing body. The reactor temperature was measured with a thermocouple located in the reactor housing close to the exit. Preliminary measurements showed that the temperature deviation between the inlet and outlet is less than 2°.
Mass flow controllers regulate the gas flows. Water is dosed by a syringe pump, vaporized and then mixed into the gaseous reactants stream.
The product gas analysis is carried out at the reactor exit by an Inficon Transpector CIS2 mass spectrometer.
Prior to the activity test, each batch of platelets was reduced in a flow of 10% H2 in
argon (total flow = 200 N ml/min). The temperature was raised from 25 to 450 °C at a rate of 4 °C/min, and then kept at 450 °C for 30 min. The reactor temperature is lowered to 200 °C in a flow of 10% H2 in argon. The flow is then switched to pure argon and subsequently to the
reactive flow with a feed composition of: 32.2% H2, 9.6% CO, 8.4% CO2, 23.0% H2O, 26.8%
Ar with a total flow of 200 N ml/min. Such feed composition is typical of the outlet of a gasoline autothermal reformer, after steam addition for favouring the WGS.
Two platelets of each batch were used for the activity tests. The exact amount of catalyst that could be coated on each platelet depended on the batch, but was about 100 mg on average. In one case a powder catalyst was used for comparison. The catalyst was sieved to obtain the particle fraction between 200 and 300 m. This powder catalyst was tested in a 6 mm inner diameter quartz tube under similar conditions as the platelets.
Both carbon and hydrogen balances were established that both amounted to 101 ± 1%. At temperatures above 350 °C traces of methane were detected, its concentration amounted to maximum 0.05% at 420 °C. In the current paper and for all calculations the methane
concentration has been neglected.
2.2. Synthesis of sols
The synthesis of the alumina sols, precursor of the catalyst, is based on the method originally proposed by Yoldas [12]. The first step of the process was the hydrolysis of
aluminum alkoxide (in this work, aluminum tri-sec-butoxide, Al(OC4H9)3—Acros Organic) at
85 °C in large excess of water (H2O/Al = 100). This gives an aluminium hydroxide slurry that
was subsequently peptized, at 85 °C, to a clear sol by addition of nitric acid (HNO3/Al = 0.07).
The required amount of the platinum precursor (H2PtCl6, 6H2O—Prolabo Analytical)
was dissolved in the water used for the hydrolysis whereas the ceria precursor
(Ce(NO3)3·6H2O—Acros Organic) – dissolved in the minimum amount of water – was added
after peptization. Yoldas [12] suggested that the peptization can be done by an acid solution containing the water soluble salt. But it has been observed that, under these conditions, the peptization becomes very slow and several days are needed to obtain a clear sol. Therefore we have preferred to add the solution of the ceria precursor after the complete peptization.
Several sols have been synthesized, in order to prepare catalysts containing about 1 or 2 wt.% of Pt (referred to as P1 or P2) and 10 and 20 wt.% of CeO2 (referred to as C1 or C2).
To some of the sols a polyvinyl alcohol (Rhodoviol™ 4/125—Prolabo) has been added (referred to as R). This polymer can adsorb at the surface of the colloïdal particles, thus stabilizing the sol.
The diluted sols prepared according to this procedure are suitable only for the
synthesis of thin layers (<1 m). For the synthesis of thicker layers that were needed to attain the required amount of catalyst (about 100 mg of catalyst per microstructured platelet), sols have been prepared loaded with catalyst powder made by firing the same sol at 500 °C.
These loaded sols contained 10 wt.% of catalyst powder mixed with Rhodoviol™ (5 wt.%). The mixture was ball milled for 30 min. These loaded sols allowed preparing thick layers with a good quality of coating because very little shrinkage occurs during drying. The synthesis parameters are summarized in Table 1 for the various samples.
Table 1.
Summary of the synthesis parameters
Sample reference Pt (wt.%) CeO2 (wt.%) Rhodoviol in sol (wt.%) Reduction under H2
P1C2 0.8 19.6 5 No
P1C2R 0.8 19.6 15 No
P1C1 0.9 9.8 5 No
P2C1 1.7 10.7 5 No
P2C1H 1.7 10.7 5 Yes
2.3. Coating of the microstructured plates
The first step was the conditioning of the steel in order to ensure the best adhesion between the layer and the substrate. In this operation the plates were immersed into an alkaline cleaner (Turco™ 4181) at 75 °C for 30 min. Then they were rinsed with water in an ultrasound bath. Finally they were dried and heated in air at 200 °C for 2 h.
The coating was performed by tape casting in such a way that the sol remains only inside the microchannels. After coating, the plates were dried overnight at room temperature. The final step was a calcination in air at 500 °C for 2 h.
2.4. Characterization of catalysts
The crystal structure was investigated by powder X-ray diffraction (PXRD). Data were collected on a Seifert 3003TT θ–θ diffractometer in the Bragg–Brentano geometry, using filtered Cu Kα radiation and a graphite secondary-beam monochromator. Diffraction intensities were measured by scanning from 5° to 90° (2θ) with a step size of 0.02° (2θ).
Scanning electron microscopy (SEM) analyses were done on a JEOL JSM-6700 (equipped with a field emission gun). Transmission electron microscopy (TEM) analyses were done on a JEOL 2010. A small amount of sample powder was put in ethanol and dispersed in an
ultrasound bath during 1 min. Then the carbon-coated grid was dipped in the suspension and allowed to dry at room temperature.
The nitrogen adsorption–desorption isotherms and the krypton adsorption isotherms were determined at 77 K by volumetric method with a Micromeretics ASAP 2010.
3. Results
3.1. Activity tests
Table 2 gives the characteristics of the different samples that have been tested. The amounts of both ceria and platinum measured on the samples P2C1 and P2C1H are somewhat lower than the amount deduced from the preparation method. The platinum dispersion of the P2C1 sample has been measured by H2 chemisorption according to the protocol outlined in [13]. The dispersion amounted to 58%. The five different samples have been tested for their catalytic activity with the flow composition given above, typical of a reformate gas at the outlet of an autothermal gasoline reformer.
Table 2.
Platelet Catalyst mass for two platelets (mg) CeO2 (%) Pt (%) Rate at 260 °C (mmol/s kgcat) TOF (s−1) at 260 °Cb P2C1 252 8.3a 1.4a 34 0.7 P2C1H 226 8.3a 1.4a 25 0.5 P1C1 164 9.8 0.9 14 0.5 P1C2 200 19.6 0.8 15 0.6 P1C2R 200 19.6 0.8 16 0.7 Powder – 8.3a 1.4a 26 0.5 a
Measured by atomic absorption spectroscopy, all other values have been deduced from the preparation method.
b
Based on the amount of Pt as determined from the preparation method and assuming a dispersion of 58%.
The carbon monoxide conversions as a function of the temperature for the different microstructures are shown in Fig. 1. From 250 °C onwards a rapid increase of the carbon monoxide conversion is observed for all samples that levels off at higher temperatures to attain the thermodynamic equilibrium conversion. The measured conversions cannot be compared directly to rank the platelets in activity, due to the different amounts of catalyst per platelet, but the use of the same volumetric flow rate. However, a comparison of the initial reaction rates can be performed at low conversions. Therefore the initial reaction rates have been calculated at 260 °C (XCO < 6%) and are reported in Table 2. The data of the P2C1
sample have been modeled according to a power law rate equation. The model consists of a one dimensional plug flow reactor that explicitly takes into account the mass and heat balance in the axial direction as well as over the catalyst layer/particle at each grid point. The least square non-linear regression analysis of the integral experimental carbon monoxide conversions is based on a Marquardt optimization routine. All this is implemented in a FORTRAN code (for more details on the model and the used correlations see [14] and [15]).
(2)
(3)
Fig. 1. Conversion of carbon monoxide over the different microstructured samples as a function of temperature (note that the lines are just a guide to the eye).
The 95% confidence intervals on the estimated parameters are reported in Eq. (1). The fit of the data as a function of temperature is shown in Fig. 2. The reaction orders of carbon monoxide and hydrogen were determined by separate experiments over different samples by varying the partial pressures of carbon monoxide and hydrogen (data not reported here). Only the pre-exponential factor and the activation energy were estimated from the data presented in Fig. 1. An adequate description of the data over the entire temperature range is observed. By only adjusting the relative activity, a similar fit of all the other data can be obtained. Using this rate equation, the activity of the other samples can be estimated by correcting for the different catalyst amounts. It was found that the activity of the different samples did not vary more than ±15%, similar to that of the TOF (turnover frequency) at 260 °C reported in Table 2.
Fig. 2. Comparison between the experimental data (symbols) and the model calculations (line) for the P2C1 sample.
The sample P2C1 was also tested in the form of a powder, in order to see how the coating procedure influences the activity. Therefore 252 mg of powder (equivalent to two platelets of the stated sample) where loaded into a quartz tube reactor with an inner diameter of 6 mm, and tested under the same conditions as for the platelets. Fig. 3 compares the carbon
monoxide conversion levels for the microstructured platelet and powder catalyst. The graph shows a much lower activity for the powder sample compared to the platelet. Again the relative activity could be calculated by using the rate Eq. (1) and amounted to approximately 60% compared to that of the platelet.
Fig. 3. Comparison between the samples P2C1 deposited on stainless steel microstructured platelets (grey) and in powder form (black). Symbols: experimental data, solid lines: model calculations.
3.2. X-ray diffraction
Powder X-ray diffraction patterns of platinum/ceria/alumina catalysts are reported in Fig. 4. To show the effect of the ceria, a pattern of pure γ-alumina has been added. The addition of ceria to the alumina renders the oxide more amorphous (the presence of ceria delays the crystallization of alumina) and the lines of cubic CeO2 (calculated pattern at the bottom of the
graph) are visible. The lines of CeO2 almost have disappeared after a reduction of the catalyst
in hydrogen at 500 °C (Fig. 5). From this pattern it is difficult to know if metallic platinum was formed after reduction, as the line (1 1 1) of metallic platinum can hardly be identified.
Fig. 4. Powder XRD patterns of the platinum/ceria/alumina catalysts calcined at 500 °C in air (λCu = 0.154184 nm). Calculated lines of cubic CeO2 have been added at the bottom of the
Fig. 5. Effect of hydrogen reduction on powder XRD patterns of the P2C1 catalyst sample (λCu = 0.154184 nm). Calculated lines of cubic Pt(0) have been added at the bottom of the
figure.
3.3. Electron microscopy
Measurements by transmission electron microscopy do not allow the proper detection of the platinum particles because of the lack of contrast between the ceria support and the metal crystallites [16] and [13] and instead high-resolution electron microscopy is needed [17]. This has been confirmed for both the 2 and 1 wt.% platinum samples in this study.
Scanning electron micrographs of a catalyst containing 10% of CeO2 show the very porous
texture of catalyst powders prepared from the sol–gel process (Fig. 6). The scanning electron micrographs presented in Fig. 7 illustrates the effect of the addition of Rhodoviol™ on the texture of the coatings. These micrographs show, at different magnification, the surface of the coatings made consisting of 1% platinum on 20% ceria/alumina. The decomposition of Rhodoviol™ creates a network with a large porosity.
Fig. 7. SEM of the P1C2R sample coated on SS plates.
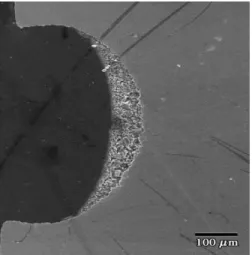
Fig. 8 shows the deposited catalyst layer inside the microstructure. It can be observed that the majority of the catalyst has been deposited on the bottom in a “triangular shape” with an equivalent particle diameter (that is the ratio of the surface area and the wetted perimeter) of 37 m.
3.4. Porosity and surface area by gas adsorption
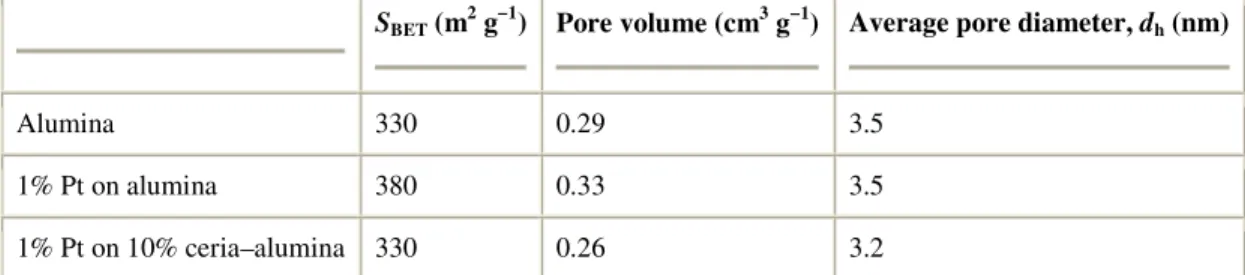
Nitrogen adsorption–desorption isotherms have been measured at 77 K on the powder catalysts. BET surface areas and pore volumes are reported in Table 3. The pore size distributions (PSD) presented in Fig. 9 show that the addition of platinum and/or ceria does not induce strong modifications to the porosity of γ-alumina. Addition of the platinum produces a slight increase in porous volume (≈10%) but no change in the mean pore diameter dh. Addition of ceria induces both a decrease of the pore volume and of the mean pore
diameter dh.
Table 3.
The effect of the addition of platinum and ceria on the porosity of alumina
SBET (m2 g−1) Pore volume (cm3 g−1) Average pore diameter, dh (nm)
Alumina 330 0.29 3.5
1% Pt on alumina 380 0.33 3.5
1% Pt on 10% ceria–alumina 330 0.26 3.2
The BET and pore volume are calculated from the nitrogen adsorption isotherms (the mean pore diameter dh is calculated assuming a cylindrical pore geometry, SBET being taken as the
pore surface area, dh = 4V/S).
Fig. 9. Pore size distributions of alumina, Pt/alumina and Pt/ceria–alumina powder catalysts (calcinated at 500 °C under air) computed from N2 adsorption isotherm using BJH method.
The surface area of the catalyst coatings on the microstructured platelets has been studied by gas adsorption. Due to the low surface areas involved, krypton has been used as the adsorbate. The surface enhancement factor (SEF), expressed in m2/m2, is defined as the ratio of the real surface area (as measured by gas adsorption) over the geometric surface. The values of SEFs, as calculated from surface area measurements by Kr adsorption on platelets coated with various catalysts, have been reported in Table 4. In order to help the interpretation of the data, in the last column the ratio of the SEF to the coating thickness has also been calculated. From these results one can conclude that almost the complete catalyst surface area remains
accessible to Kr even when the thickness of the layer increases. On the other hand, loading sols with catalyst powder does not decrease the surface area.
Table 4.
Surface enhancement factors (SEF) of platinum/ceria–alumina coatings
Coating thickness ( m) SEF (m2/m2) SEF ( m)
1%Pt + 10% Ce(NO3)3 1.1 1000 909
1%Pt + 10% Ce(NO3)3 + powder 8.6 7700 895
1%Pt + 10% Ce(NO3)3 + powder 12.3 10300 837
The data presented here confirm that platinum/ceria catalysts are indeed very active for the WGS reaction at temperatures above 250 °C. The initial rate data measured for the P2C1 sample corresponds approximately to a turnover frequency of 0.7 s−1 at 260 °C. The initial rates do not vary to a large extent, within approximately a factor of 2, with the different catalyst compositions. However, the turnover frequency for all samples is 0.6 ± 0.1 s−1, assuming similar Pt dispersions for all samples. Apparently the amount of ceria does not alter the catalyst activity to a great extent. Moreover, no change in activity is observed by
increasing the amount of the binder. Similarly, the initial rates obtained over the powder sample compare well with those obtained over the microstructured platelet. However, the data between powder and platelet deviate substantially at higher temperatures and conversion levels (Fig. 3). The conversion over the powder samples is lower than that of the platelets indicating that there might be diffusion limitation inside the pellets, as the pellet size (250 m) is substantially larger than the equivalent particle diameter of the catalyst layer (37 m) inside the microchannel. To verify this hypothesis, a simulation has been performed that takes into account explicitly the diffusion of matter inside the pellets. This simulation was based on a value of the average particle diameter of 250 m, a tortuosity factor of 5 and the mean pore diameter and pellet porosity as calculated from the N2 adsorption data. Fig. 3
compares the experimental data and the simulation. It can be observed that at 260 °C, the powder and platelet indeed give similar initial rates. Above this temperature the rates are lower due to diffusion limitation inside the pores, until the thermodynamic equilibrium is reached where the rate for the reverse water-gas shift is close to the forward rate and hence the overall rate is low. The model still overestimates the conversions in the medium
temperature range. This can be due to an underestimation of the diffusion coefficients or the contribution of the smaller pores has been underestimated. The model evaluated the activity of the powder catalysts to be 60% of that of the thin layer catalysts deposited on the
microstructured platelet. Thus the thin layer microstructured catalyst gives an optimum use of the platinum metal. This will be even worse for commercial catalysts in pellet form that usually have sizes in the millimeter range. In that case an eggshell design will be necessary to reduce the quantity of platinum needed. Recently a similar conclusion was reached for monolith-based catalysts [14].
Platinum/ceria/alumina catalysts have been prepared by a sol–gel method and coated in the microchannels of stainless steel platelets. The obtained coatings show good adherence and catalytic activity. Hardly any influence of the amount of ceria as well as the effect of a binder on the catalytic performance has been observed. The kinetics over these thin films has been described by a power law rate equation. An activation energy of 86 kJ/mol has been found and at 260 °C the TOF corresponds to 0.6 ± 0.1 s−1 for all investigated samples. The superior activity of the platelets compared to the powder samples is attributed to the diffusion
limitations inside the powder pellets. Thus catalysts deposited on microstructured platelets lead to a better platinum utilization.
Acknowledgements
Part of this work has been funded by the EU “MINIREF” project (NNE5-2001-00056). IMM—Institut für Mikrotechnik Mainz GmbH is gratefully acknowledged for providing the microstructured platelets.
References
D.C. Papageorgopoulos, M. Keijzer and F.A. de Bruijn, Electrochem Acta 48 (2002), p. 197.
W. Ruettinger, O. Ilinich and R.J. Farrauto, J. Power Sources 118 (2003), p. 61.
D. Andreeva, V. Idakiev, T. Tabakova and A. Andreeva, J. Catal. 158 (1996), p. 354.
A. Luengnaruemitchai, S. Osuwan and E. Gulari, Catal. Commun. 4 (2003), p. 215. D. Andreeva, V. Idakiev, T. Tabakova, L. Ilieva, P. Falaras, A. Bourlinos and A. Travlos, Catal. Today 72 (2002), p. 51.
T. Shido and Y. Iwasawa, J. Catal. 141 (1993), p. 71.
O. Goerke, P. Pfeifer and K. Schubert, Appl. Catal. A: Gen. 263 (2004), p. 11.
A. Goguet, F.C. Meunier, J.P. Breen, R. Burch, M.I. Petch and A. Faur Ghenciu, J. Catal. 226 (2004) (2), p. 382.
A. Holmgren, B. Andersson and D. Duprez, Appl. Catal. B 22 (1999), p. 215.
W. Ehrfeld, V. Hessel and H. Loewe, Microreactors, Wiley–VCH, Weinheim (2000).
B.E. Yoldas, Transparent activated non-particulate alumina and method of preparation, US Patent 3,941,719 (1976).
V. Perrichon, L. Retailleua, P. Bazin, M. Daturi and J.C. Lavalley, Appl. Catal. A: Gen. 260 (2004), p. 1.
Y. Schuurman, A.S. Quiney, G. Germani, C. Mirodatos, Proceedings of the Seventh World Congress of Chemical Engineering, in press.
J.M. Moe, Chem. Eng. Progr. 58 (1962), p. 33.
P.J. Levy and M. Primet, Appl. Catal. 70 (1991), p. 263.
S. Bernal, J.J. Calvino, M.A. Cauqui, G.A. Cifredo, A. Jobacho and J.M. Rodriquez-Izquierdo, Appl. Catal. A: Gen. 99 (1993), p. 1.