The Mg II index for upper atmosphere modelling
Texte intégral
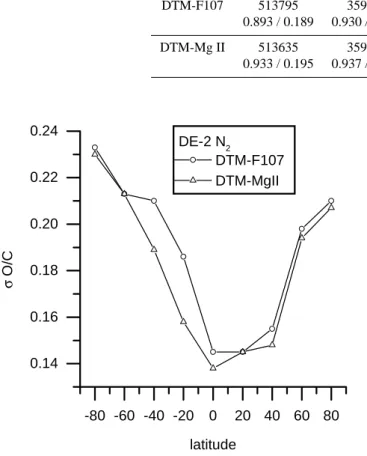
Figure
Documents relatifs
The Stella data is at the highest altitude of the three data- sets used here. We have used data over the duration of an entire solar cycle, overlapping GOCE and GRACE, and in
Following Bolch and others (2012) and Frey and others (2014) the HK region is divided into four sub-regions: the Karakoram, and the western, central and eastern Himalaya (Fig.
The benzene absorption cross sections measured were added to a bigger set of laboratory results, and used to analyze 4 stellar occultations by Titan’s atmosphere (T21, T41, T41 II,
To investigate whether thought recall showed primacy and recency effects, we divided the walk of each par- ticipant in 4 time bins of equal duration and calculated the number
7 above the 16 km curve (with low depression values for both bands) are primarily an effect of the random calibration error, and shall not be taken as detections of high
A53, page 6 of 7.. Atmospheric temperature at the lower thermosphere of Venus: comparison and time evolution. A) and B) show our temperatures at the subsolar meridian and the
In the present study, we have computed the outgoing shortwave radiation (OSR) at the top of atmosphere (TOA) at 2.5 ◦ longitude- latitude resolution and on a mean monthly basis for
The height-latitude contour plots of monthly mean zonal and meridional winds for all months of the year, and of annual mean wind, amplitudes and phases of annual and
