HAL Id: hal-00295305
https://hal.archives-ouvertes.fr/hal-00295305
Submitted on 29 Jul 2003
HAL is a multi-disciplinary open access
archive for the deposit and dissemination of
sci-entific research documents, whether they are
pub-lished or not. The documents may come from
teaching and research institutions in France or
abroad, or from public or private research centers.
L’archive ouverte pluridisciplinaire HAL, est
destinée au dépôt et à la diffusion de documents
scientifiques de niveau recherche, publiés ou non,
émanant des établissements d’enseignement et de
recherche français ou étrangers, des laboratoires
publics ou privés.
Ultrathin Tropical Tropopause Clouds (UTTCs): II.
Stabilization mechanisms
B. P. Luo, Th. Peter, H. Wernli, S. Fueglistaler, M. Wirth, C. Kiemle, H.
Flentje, V. A. Yushkov, V. Khattatov, V. Rudakov, et al.
To cite this version:
B. P. Luo, Th. Peter, H. Wernli, S. Fueglistaler, M. Wirth, et al.. Ultrathin Tropical Tropopause
Clouds (UTTCs): II. Stabilization mechanisms. Atmospheric Chemistry and Physics, European
Geo-sciences Union, 2003, 3 (4), pp.1093-1100. �hal-00295305�
www.atmos-chem-phys.org/acp/3/1093/
Chemistry
and Physics
Ultrathin Tropical Tropopause Clouds (UTTCs): II. Stabilization
mechanisms
B. P. Luo1, Th. Peter1, H. Wernli1, S. Fueglistaler1, M. Wirth2, C. Kiemle2, H. Flentje2, V. A. Yushkov3, V. Khattatov3,
V. Rudakov3, A. Thomas4, S. Borrmann4, G. Toci5, P. Mazzinghi6, J. Beuermann7, C. Schiller7, F. Cairo8,
G. Di Don-Francesco9, A. Adriani8, C. M. Volk10, J. Strom11, K. Noone12, V. Mitev13, R. A. MacKenzie14,
K. S. Carslaw15, T. Trautmann16, V. Santacesaria17, and L. Stefanutti18
1Institute for Atmospheric and Climate Science, ETH Zurich, Switzerland 2Institute for Atmospheric Physics, DLR Oberpfaffenhofen, Germany 3Central Aerological Observatory, Moscow, Russia
4Institute for Atmospheric Physics, University of Mainz, Germany
5Quantum Electronics Institute, National Research Council (IEQ-CNR), Florence, Italy 6National Institute of Applied Optics, Florence, Italy
7Institute I: Stratosphere, Forschungszentrum J¨ulich GmbH, J¨ulich, Germany 8Institute for Atmospheric Science and Climate,CNR, Roma, Italy
9ENEA Casaccia, Roma, Italy
10Institut fr Meteorologie und Geophysik, Universit¨at Frankfurt, Germany 11Institute of Applied Environmental Research, Stockholm University, Sweden 12Department of Meteorology, Stockholm University, Sweden
13Observatoire cantonal, Neuchˆatel, Switzerland
14Environmental Science Department, Lancaster University, UK 15School of the Environment, University of Leeds, UK
16Institute of Meteorology, University of Leipzig, Germany 17IROE – CNR “Nello Carrara”, Firenze, Italy
18Geophysica-GEIE – “CNR”, Firenze, Italy
Received: 6 December 2002 – Published in Atmos. Chem. Phys. Discuss.: 19 March 2003 Revised: 25 June 2003 – Accepted: 25 June 2003 – Published: 29 July 2003
Abstract. Mechanisms by which subvisible cirrus clouds
(SVCs) might contribute to dehydration close to the tropical tropopause are not well understood. Recently Ultrathin Trop-ical Tropopause Clouds (UTTCs) with optTrop-ical depths around 10−4have been detected in the western Indian ocean. These clouds cover thousands of square kilometers as 200–300 m thick distinct and homogeneous layer just below the tropical tropopause. In their condensed phase UTTCs contain only 1–5% of the total water, and essentially no nitric acid. A new cloud stabilization mechanism is required to explain this small fraction of the condensed water content in the clouds and their small vertical thickness. This work suggests a mechanism, which forces the particles into a thin layer, based on upwelling of the air of some mm/s to balance the ice par-ticles, supersaturation with respect to ice above and subsat-uration below the UTTC. In situ measurements suggest that
Correspondence to: B. P. Luo
these requirements are fulfilled. The basic physical proper-ties of this mechanism are explored by means of a single par-ticle model. Comprehensive 1-D cloud simulations demon-strate this stabilization mechanism to be robust against rapid temperature fluctuations of ±0.5 K. However, rapid warm-ing (1T > 2 K) leads to evaporation of the UTTC, while rapid cooling (1T < 2 K) leads to destabilization of the par-ticles with the potential for significant dehydration below the cloud.
1 Introduction
Cirrus clouds may be remnants of outflow of deep convec-tive systems (e.g. Danielsen, 1982; Sherwood and Dessler, 2000) or they may form as a result of in situ nucleation of ice crystals in the upper troposphere in the course of slow cooling and upwelling (e.g. Jensen et al., 2001). As de-scribed in the companion paper (Peter et al., 2003), recently
1094 B. P. Luo et al.: Ultrathin Tropical Tropopause Clouds (UTTCs)
Ultrathin Tropical Tropopause Clouds (UTTCs) have been investigated by means of simultaneous remote and in situ measurements. UTTCs are characterized by extensive lay-ers of remarkable homogeneity with extremely low optical thickness, τ ≈ 10−4, which is the consequence of (a) a low geometrical thickness of only 200–300 m, and (b) low num-ber densities, n = 5 − 10 L−1, of relatively small particles with radii r ≈ 5 µm. The low geometrical thickness and concomitant horizontal homogeneity comes as a surprise, as in situ formation of ice from preexisting droplets caused by homogeneous nucleation is expected to lead to cirrus clouds of at least 1.5 km thickness (Jensen et al., 2001). Also, out-flow from deep convection cannot be expected to display this degree of homogeneity (unless, may be, subject to very high vertical wind shear). The low particle number densities and sizes are an even larger surprise, as they result in a condensed phase mass corresponding to a mixing ratio of just a few tens of ppbv (Peter et al., 2003; Luo et al., 2003; Thomas et al., 2002), i.e. much less than the total water available.
2 Summary of UTTC measurements
Here we briefly summarize information given in the com-panion paper (Peter et al., 2003) on the measurements per-formed during the APE-THESEO (Airborne Platform for Earth Observation – Third European Stratospheric Experi-ment on Ozone) campaign in February/March 1999 in the western Indian Ocean. UTTCs have the following character-istics:
1. the coverage of UTTCs was found to be high, around 31%;
2. the vertical thickness of UTTCs is only 200–300 m;
3. they reside only a few hundred meters below the cold point tropopause;
4. their horizontal extent may reach thousands of square kilometers;
5. the central parts of the cloud layer is characterized by a high degree of homogeneity;
6. they consist of water ice particles with little or no indi-cation of co-condensed nitric acid;
7. the condensed matter in the cloud particles corresponds to only 25–100 ppbv H2O, or 1–5% of the total available
water vapor;
8. ice crystal radii are 5–6 µm, number densities 5– 10 L−1.
As Luo et al. (2003) argue, the unique combination of high altitude and low number density makes UTTCs highly suited to serve as drying agent during the last step of dehydration
of air directly before troposphere-to-stratosphere exchange. They investigate the conditions under which UTTCs serve this purpose, and conclude that UTTCs in a global average are likely to yield a lowering of 0.35 ppmv of H2O in the air
exchanged from the troposphere to the stratosphere.
3 The UTTC paradox
How is it possible that the condensed phase of UTTCs can consist of 25–100 ppbv H2O, which is only 1–5% of the
totally available water? And how can this at first sight very fragile arrangement be stable and form an only 200– 300 m thick, relatively homogeneous layer, which extends over thousands of square kilometers? For comparison, in a controlled laboratory experiment with a container filled with 3 ppmv H2O at a total pressure of 90 hPa it would require a
tremendous effort to stabilize the temperature at 0.11 K be-low the frost point of 188.96 K, in order to keep just 2% of the water in the condensed phase. Only one tenth of a degree warmer or colder and the particles would be gone or grow to twice the mass, either result conflicting with the observa-tions. Furthermore, particles with 5–6 µm radius sediment by about 400 m per day, while they have been observed al-ways a few hundred meters below the tropopause during five flights covering the period of one month. If they sedimented during their lifetime, the frost point would also have to de-scend, which is unlikely. The thinness, homogeneity, dura-tion and persistent altitude of these layers demonstrate that nature is able to overcome this stabilization problem.
Three potential solutions come to mind:
(a) the natural clouds are not composed of ice;
(b) the particles are composed of ice, but they are nucleated in-situ and not in equilibrium with their environment, in contrast to the lab experiment envisaged above;
(c) they are composed of ice in equilibrium and subject to a delicate stabilization mechanism.
We will show that there are favorable conditions for (c), while (a) and (b) should be rejected.
Any kind of non-volatile material, such as mineral dust or meteoritic material can be excluded as source of UTTCs. There is no reason why, in the absence of very strong wind shear, such matter should accumulate in a distinct, very thin layer right below the tropopause. Also the in situ mea-surements suggest the condensed phase to consist mainly of water (Peter et al., 2003). Rather, it is conceivable that volatile compounds, such as those in HNO3-containing polar
stratospheric cloud particles, might condense at the tropical tropopause (Hamill and Fiocco, 1988; Hervig and McHugh, 2002). About 5–10 ppbv of HNO3 condensed as a hydrate
could explain the stability of the particles against temper-ature fluctuations. However, from the CVI-TDL (Counter-flow Virtual-Impactor – Tunable Diode Laser, detection limit
≈0.2 ppb) measurements onboard Geophysica during the APE-THESEO campaign there is no evidence for HNO3 in
the particles (see Luo et al., 2003). The measurements made on ER-2 flights in the tropics show a HNO3mixing ratio
typ-ically 0.1–0.5 ppbv (Jensen and Drdla, 2002), which is too low to explain either the HALOE extinctions (Jensen and Drdla, 2002) or the UTTCs. Furthermore, a detailed in-vestigation of the UTTC lidar data reveals that evidence for a distinct difference between ice clouds and HNO3-hydrate
clouds, as known from lidar measurements in the polar re-gions (Type-1 versus Type-2 polar stratospheric clouds), is missing.
Next, we investigate the possibility (b) that the layers consist of ice particles, which nucleate in slowly upwelling and cooling air masses and then sediment to lower subsat-urated altitudes where they again evaporate. Though ex-treme wind shear could help forming thin layers initially, the survival of the particles requires Sice = 1 while they
sed-iment by 400 m/day, which is unlikely. Assuming homoge-neous nucleation of ice in background aerosol droplets, mod-eling work by Jensen et al. (2001) showed that this mecha-nism is suited for SVC formation and maintenance. How-ever, SVCs maintained by continuous homogeneous nucle-ation with subsequent sedimentnucle-ation and evapornucle-ation require an ice saturation ratio Sice ≈ 1.6 in the liquid phase (Koop
et al., 2000), corresponding to a relative humidity of 160% with respect to ice in the gas phase (which can be assumed to be in equilibrium with the solution droplets). In con-trast, the water vapor measurements during APE-THESEO shown in Fig. 1 reveal only slight supersaturations above the UTTC layer, reaching about Sice ≈1.2. Moreover,
continu-ously nucleating SVCs must be geometrically much thicker than UTTCs. The minimum thickness of such clouds is at least 800 m, as can be estimated from the necessity to reach
Sice ≈1.6 (equivalent to a supercooling of 3–4 K below the
frost point required for homogeneous ice nucleation in the background aerosol droplets). This condition is met 400 m above the frost point altitude (assuming constant H2O mixing
ratio and a lapse rate of 10 K/km), so that the particles grow in free fall over 400 m and then need another 400 m under subsaturated conditions before they are completely evapo-rated. This is a lower bound, and Jensen et al. (2001) showed that clouds forming by this mechanism are indeed typically 1.5–2 km thick. In the case of homogeneous freezing, the particles would grow to sizes >20 µm when they fall from the level of nucleation to the level of ice saturation (∼400 m), which is also in clear contradiction to the observed size of
∼5 µm.
If there were ice nuclei (IN) enabling heterogeneous nu-cleation, this could considerably reduce the necessary super-cooling, and hence allow for much thinner clouds. For exam-ple, silver iodide (AgI) is known as a very potent IN, and lab-oratory experiments suggest that Sice ≈1.1 (T = 263.7 K)
might suffice to activate a fraction of 10−5 in an ensemble of pure water droplets including 45 nm AgI nuclei (median
360 370 380 390 400 potential temp. [K] 0.0 0.5 1.0 1.5 ice saturation 185 188 191T [K]194 197 200 360 370 380 390 400 0.001 0.010volume [um0.100 1.000 10.000 3/cm3] 14.6 16.1 17.26 17.9 18.2 approx. altitude [km]
Fig. 1. Profiles of particulate volume density on 24 February 1999 measured by the FSSP-300 (diamonds), 100-m vertical averages of temperature (crosses) and of the ice saturation ratio Sicecalculated
from the measurement by the Ly-α hygrometer FLASH (stars), which is the second hygrometer on board Geophysica measuring gas-phase water only. The Sice = 1 level is marked by the
verti-cal bar. The cold point tropopause is about 400 m above the centre of the UTTC. Temperatures are uncertain by ±1 K and have been taken at the lower limit in order to achieve Sice = 1 level at cloud
altitude.
radius) (Pruppacher and Klett, 1997). Provided that the het-erogeneous freezing rate in solutions at constant saturation decreases with decreasing temperature (as is the case for the homogeneous rate, and also for the heterogeneous rate if the physical properties of the nucleation site, e.g. the contact an-gle, do not depend on temperature themselves), we can make a conservative estimate and apply the fraction of 10−5found in the laboratory for the warm pure water droplets to solution droplets about 200 m above the UTTC (with Sice ≈ 1.1) in
Fig. 1. This would then imply that each of the approximately 103cm−3 background aerosol particles must contain an IN
as potent as AgI in order to produce clouds as thin as the observed UTTCs, a quite unlikely scenario. Furthermore, re-cent low-temperature laboratory measurements suggest that insoluble particles (such as dust or soot) lower the thresh-old for ice nucleation to only about Sice = 1.3 (M¨ohler et
al., poster presentation, EGS-AGU General Assembly, Nice 2003).
1096 B. P. Luo et al.: Ultrathin Tropical Tropopause Clouds (UTTCs) -0.3 -0.2 -0.1 -0.0 0.1 0.2 ice supersaturation 16.6 16.8 17.0 17.2 altitude [m] 0.00 0.25vertical speed [cm/s]0.50 0.75 1.00 0 50 100 150 200 250 time [h] 0 2 4 6 8 radius [um] -80 -40 0 40 80 altitude [m]
ice saturation
vertical
wind
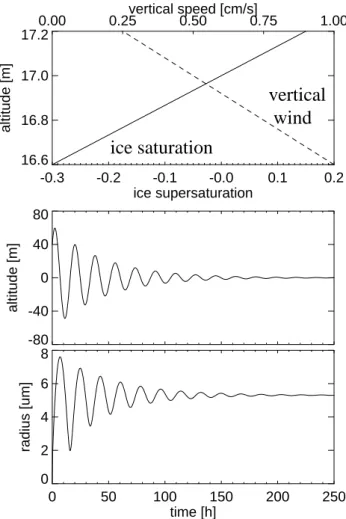
Fig. 2. One-particle simulation. Upper panel: prescribed ice satu-ration ratio and wind profile used for the calculation. Middle and lower panel: the altitude and size evolution of a small ice particle released 40 m above the equilibrium level.
4 UTTC stabilization mechanism
UTTCs require a completely new concept for cloud mainte-nance. Nucleation would become unnecessary to maintain the cloud if the ice particles were levitated by large-scale up-welling air motion, provided it is strong enough to balance their sedimentation speed, and provided there is some mod-erate supersaturation above the cloud. In such a case particles can stably oscillate about the altitude given by Sice =1, i.e.
∼17.3 km (Fig. 1). This means, Sice =1 defines a point of
stability: if particles happen to sink below this level they en-ter a region of subsaturation, start to evaporate, deposit waen-ter in the gas phase, become lighter, and the upwelling drives them back to the Sice =1 level; conversely, the air above is
supersaturated, growth of the particles increases their weight, they deplete the gas phase, and then sediment back to the
Sice=1 level.
Here we model this mechanism in two steps: first we model the motion of a particle under the outlined conditions
using a single-particle model with a fixed gas phase; sec-ond we use a comprehensive column model to describe the particle-gas interaction, and we compare the results of cloud thickness and density with the measurements (Sect. 5).
The coupled growth/evaporation and the vertical motion of ice particles in a presence of an upwelling velocity vair can be described by the following equations:
dz dt =ν air(z) −2gρr2 9η , (1) dr2 dt =2 m ρDH2On vap H2O[Sice(z) −1]. (2)
Equation (1) describes the sedimentation of the ice particles.
z is the altitude, r the radius of ice particles, g the grav-ity constant (980 cm/s2), ρ the density of ice (0.91 g/cm3),
η the viscosity of air, respectively. Equation (2) describes the growth/evaporation of ice particles. dr2/dt is the time-derivative of the second power of radius of ice particles. Sice
is the saturation ratio with respect to ice, m the mass of a water molecule, DH2Othe gas phase diffusion coefficient of
water molecules, nvapH
2O is the molecular H2O density of the
equilibrium vapor phase over ice. We used a highly simpli-fied profile for Sice and vair in the single particle model as
shown in the upper panel of Fig. 2. nvapH
2O can be calculated
from the vapor pressure over ice by using the ideal gas equa-tion. We also fixed the temperature T at 190 K and the total pressure at 90 mbar, which are used to calculate nvapH
2O, DH2O
and η (Pruppacher and Klett, 1997). An example for the cal-culated trajectory of a single particle is shown in Fig. 2. The vertical speed has a slope of −1.25 cm/s/km and equals to 0.5 cm/s at 17 km. A subtle point is that the vertical compo-nent of the wind must weaken with altitude in order to damp the oscillation of the ice particles about the Sice = 1 level
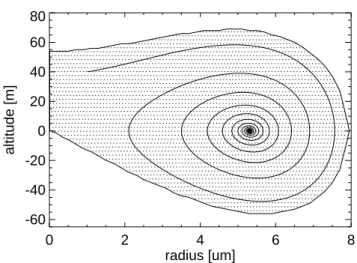
(in the case of constant wind they oscillate without damping until they have flattened the relative humidity profile by con-tinuous downward transport of water, while the solution of the coupled microphysical growth and sedimentation equa-tions leads to an unstable oscillation if winds are increasing with altitude). In Fig. 3, the stability region of ice particles is shown. Depending on the initial size of the ice particles, they may stabilize even when they are 60 m below or above the equilibrium altitude.
The mechanism discussed here would not lead to efficient stabilization of the particle if it depended strongly on the profiles of Sice and vair in Fig. 2 (upper panel). However,
this dependence is very moderate and the stabilization con-sequently very strong. Smaller gradients in Sice, as they were
frequently observed during APE-THESEO, lead to a larger altitude ranges of the stable region. Conversely, larger gra-dients, which have been observed only rarely, lead to some-what smaller stability regions. The only requirement for the vertical wind, vair, is that its gradient should be negative,
with larger gradients leading to stronger damping of the os-cillation. Changes in the overall wind speed simply lead to
corresponding changes in the particle equilibrium size. In summary, the stabilization mechanism is relatively insensi-tive to the assumed input vertical profiles.
5 UTTC column modeling
In the column model, a vertical resolution of 10 m is used for the gas phase. Each individual particle is followed by its size and altitude. The simulation starts with a 1-km thick SVC, which for example might have nucleated similarly to the cloud modeled by Jensen et al. (2001), for example nu-cleating in gravity waves. Alternatively, the particles may be due to flow out from deep convection. The base area can vary depending on the ice particle number density of the initial SVC. A total 5000 individual particles with mono-disperse size distribution interacting with the gas phase are used in the present calculation (poly-disperse distributions do not change the results). The water molecules, condensing on or evaporating from the ice particles, are subtracted from or added to the corresponding gas phase altitude bin according to the following equation:
dp dt = X i kT Vbox dNi dt , (3)
here p is the water partial pressure and Vboxis the gas phase
volume of the vertical gas phase size bin (i.e. base area × vertical resolution) and Ni number of water molecules in ice
particle i. k is the Boltzmann constant. All the ice parti-cles i within the altitude bin are summed up. dNi/dtcan be
calculated from Eq. (2) and the radius of ice particles:
dNi dt = 2πρr m dr2 dt . (4)
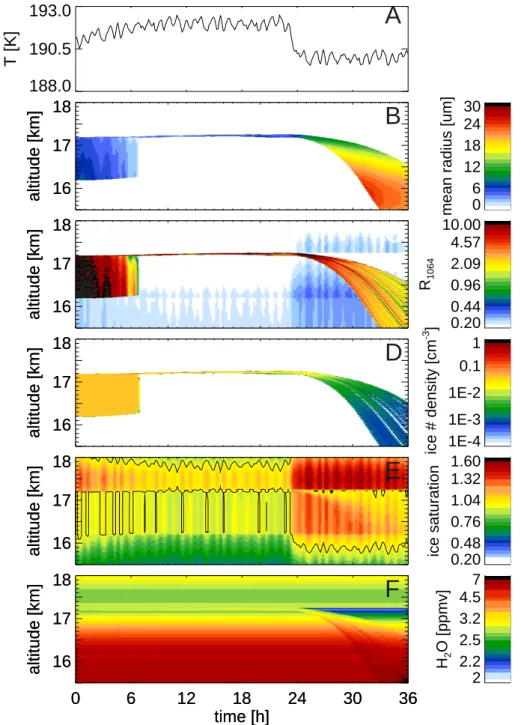
The prescribed vertical winds and the missing coupling to a radiation model should not compromise the principal mi-crophysical results. We assume a vertical wind field that vanishes at 18.25 km altitude and increases downward with 0.4 cm/s per kilometer. The results are shown in Fig. 4. A slight warming (panel A) makes the SVC evaporate, but leaves a UTTC at 17.3 km behind, because Sice remains
slightly larger than unity above this altitude (E). Between 12 h and 25 h particle radii (B) and number densities (D) are similar to those measured inside the UTTCs. The optical thickness of the simulated and measured clouds are very sim-ilar. However, there is a higher backscatter ratio and a thinner vertical thickness of the modeled cloud, as an idealized parti-cle distribution, wind and temperature fields were used in the model. In particular, the larger vertical thickness of the mea-sured UTTCs may be due to small-scale turbulence, which is not considered in the column model. Temperature fluctua-tions of ±0.5 K were applied in the calculation to test the sta-bility of the UTTCs. The aerosol backscatter ratio at 1064 nm in panel C shows that in addition a moist layer is left at the lower edge of the original SVC from particles sedimenting
0 2 4 6 8 radius [um] -60 -40 -20 0 20 40 60 80 altitude [m]
Fig. 3. Stability region of UTTCs. The ice particles starting within the stability region (given by initial size and altitude) survive and spiral to the equilibrium size and altitude. Particles outside this re-gion evaporate at the lower altitude with Sice<1. Trajectory refers
to an ice particle with r = 1 µm released 40 m above the equilib-rium position. The altitude given here is relative to the equilibequilib-rium position of the UTTCs.
to this altitude before complete evaporation, leading to water uptake by the background droplets. Upon a cooling of 2 K from 25 h to 36 h, the air below the UTTCs becomes super-saturated with respect the ice. The ice particles sediment into supersaturated air, where they grow to larger sizes and sedi-ment rapidly enough to dehydrate the air significantly before it enters the stratosphere (see Luo et al., 2003). Had there been a warming instead of a cooling the UTTC would evap-orate without effect on the gas phase water.
6 Discussion
The simulation requires upwelling velocities of 5 mm/s just below the tropical tropopause in order to stabilize the UTTC. This value appears to be rather large considering the absence of moist convection and visible cloud formation. Accord-ing to recent radiation calculations, mean net diabatic heat-ing rates become positive above about 15 km and appear to reach values up to 0.5 K/day close to the tropical tropopause (Hartmann et al., 2001). Given the potential temperature pro-files measured by the Geophysica in the vicinity of UTTCs, such diabatic heating rates would result in vertical veloci-ties exhibiting a peak of about 2.5 mm/s a few hundred me-ters below the tropopause, with a sharp decline above, sim-ilar to the study of Jensen et al. (2001). Clearly, large tem-poral and regional variations to these mean upwelling rates are possible. For example, the Indonesian region appears to permanently exhibit sinking motion of a few mm/s in the tropopause layer (Sherwood, 2000), which has to be bal-anced by additional uplift over less convective regions in the
1098 B. P. Luo et al.: Ultrathin Tropical Tropopause Clouds (UTTCs)
time [h]
188.0
190.5
193.0
T [K]
A
0
6
12
18
24
30
36
time [h]
16
17
18
altitude [km]
0
6
12
18
24
30
36
time [h]
16
17
18
altitude [km]
F
2 2.2 2.5 3.2 4.5 7 H2 O [ppmv]16
17
18
altitude [km]
16
17
18
altitude [km]
E
0.20 0.48 0.76 1.04 1.32 1.60 ice saturation16
17
18
altitude [km]
16
17
18
altitude [km]
D
1E-4 1E-3 1E-2 0.1 1 ice # density [cm -3 ]16
17
18
altitude [km]
16
17
18
altitude [km]
C
0.20 0.44 0.96 2.09 4.57 10.00 R106416
17
18
altitude [km]
16
17
18
altitude [km]
B
0 6 12 18 24 30mean radius [um]
Fig. 4. Modelling of the 24-h evolution of a cirrus balanced by upwelling: 0–8 h slow evaporation of 1-km thick SVC due to warming of air column by 1 K; 8–23 h persistent UTTC at 17.3 km stable against 0.5-K fluctuations and accompanied by diffuse humidified H2SO4/H2O
layer; 24–36 h cooling of air column by 2 K and subsequent destabilization of cloud with strong particle growth and sedimentation leading to dehydration. (A) temperature at 17.3 km altitude (assuming a vertical temperature profile as in Fig. 1); (B) mean radius of ice particles; (C) backscatter ratio at 1064 nm from ice crystals assuming spheroidal prolate shape with aspect ratio 0.5; (D) ice particle number density;
(E) saturation ratio (Sice) with respect to ice, black contours mark the Sice =1 level (i.e. equilibrium between gas and condensed phase);
(F) gas phase water mixing ratio.
tropics. Indeed, VHF radar measurements over Christmas Island by Gage et al. (1991) reach monthly mean values of 3 mm/s close to the tropopause, and in some months even up to 10 mm/s. Interestingly, peak upwelling velocities of 5 mm/s just below the tropical tropopause are also consistent with the ozone measurements onboard the Geophysica when
one assumes a simple balance between upwelling and photo-chemical production of ozone above 15.5 km as for example done by Folkins et al. (1999). Upwelling velocities increas-ing from 0 (at 14.9 km) to a peak of 5 mm/s at 16.7 km and dropping to typical stratospheric values (0.2 mm/s) at higher altitudes yield an ozone profile in full agreement with the
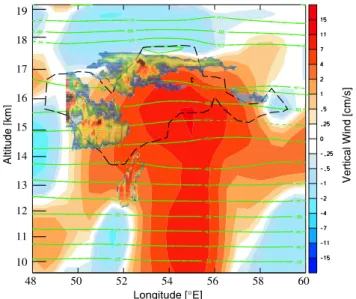
mean ozone profile during the APE-THESEO campaign. Inspection of the assimilated data from the European Cen-tre for Medium-range Weather Forecasts (ECMWF) on 24 and 27 February 1999 supports the existence of relatively large upward motions just below the cold point tropopause. This is seen in Figs. 5 and 6. Figure 5 shows the lidar observations on 27 February 1999 for a flight leg in west-east direction at 10◦S superimposed on the ECMWF verti-cal velocity field. The ECMWF data is in agreement with the hypothesis that the UTTC was generated by the 1–2 km thick Ci cloud which was slowly evaporating at the boundary of a broad region characterized by upward motion (colored red in Fig. 5), and that the UTTC was right above the cen-ter of the upwelling and almost at the top of a moist layer (dashed black curve). The upwelling of 5–10 mm/s given by the ECMWF matches surprisingly well the requirement for the balance of the UTTC. UTTCs were also observed in re-gions with an upwelling motion of ∼5 mm/s on 24 February 1999, see Fig. 6. On that day there were thicker cirrus some 2–3 km below the UTTC level, whereas they have presum-ably already evaporated higher up. On both days ECMWF vertical winds show a vertical gradient as required to stabi-lize the UTTCs. A comparison of Meteosat cloud images on that day with ECMWF precipitation and mid-tropospheric cloud cover reveals a very good agreement, showing no pre-cipitation and scattered cloud cover along the flight path sur-rounded by three groups of precipitating Cbs at least 150 km from the flight path with cloud tops at 12–13 km. Following a model of the tropical tropopause layer by Sherwood and Dessler (2000) one possible explanation for the stabilization of the UTTCs might be that it is part of the larger-scale up-ward motion required to match the strong descent above the Cbs. At that time of the year, according to ECMWF fields, such mesoscale regions of upwelling appear with some regu-larity in the western Indian ocean and last typically 24 hours. It must be emphasized that the temporal (6 hr) and verti-cal (≈1 km) resolution of the ECMWF data is not sufficient to study the motions of tropical air in great detail and that it is not clear how strongly the vertical motion field is in-fluenced by shortcomings of the model parameterizations. However, we checked all mission flights and find again re-markable support for the applicability of the analysis data: UTTCs were found only when ECMWF indicates both up-welling and sufficiently humid air, whereas they were absent otherwise. Slow uplift and sufficiently humid air are essential conditions for UTTCs anyway, may they be remnants from thicker clouds or formed in situ by suitable IN.
The temperature range, where UTTCs may remain upon the evaporation a thicker SVC during a warming event, is defined by the maximum ice saturation above the clouds (the upper limit, say 1.5) and the frost point of the SVC (including ice water content, say 1.1). This 1Sice =0.4 corresponds to
a temperature range of about 2 K. We would argue that this temperature range is relatively large compared to the ubiq-uitous gravity waves in the tropics. Even the temperature
Fig. 5. ECMWF vertical winds (in cm s−1, red = upwelling, blue =
downwelling), temperatures (in◦C, green contour lines, minimum at −91◦C 300 m above the UTTC) and relative humidity with re-spect to ice (black dashed line for Sice=110%) along 10◦S on 27
February 1999 at 6 UTC. Aerosol backscatter ratio R1064at 1064
nm measured by OLEX .
amplitudes of Kelvin waves might be small enough (Boehm and Verlinde, 2000), and such waves offer sufficient horizon-tal scale to simultaneously affect many 1000s of square kilo-metres. However, waves on even larger scales might develop amplitudes too high for UTTCs to survive (i.e. they fully evaporate) or might lead to new ice nucleation. We feel that this offers a comfortable range for the generation of UTTCs, though a statistical analysis is beyond this paper.
Furthermore, Holton and Gettelman (2001) make the point of the above referenced paper is that horizontal velocities are typically orders of magnitude greater than vertical ve-locities near the tropical tropopause so that horizontal advec-tion through “cold pools” near the tropopause must be con-sidered. This seems consistent with the UTTCs discussed here, since the enhanced vertical motions that are required to explain the stabilization of the UTTCs are most likely asso-ciated with inertia-gravity waves of short vertical and long horizontal scale (and hence large horizontal and weak verti-cal velocities).
UTTCs are an important finding of the APE-THESEO campaign in the western Indian ocean. The ice particles ap-pear to be wind-balanced. Hence, the size of these cloud par-ticles is a direct measure of the upwelling velocity. The cloud model developed here is capable of describing the essential microphysical features of this new cloud type and reveals its dehydration potential. In a global perspective the quantifica-tion of the dehydraquantifica-tion potential of UTTCs remains an open issue, which challenges our understanding of tropical upper tropospheric meteorology.
1100 B. P. Luo et al.: Ultrathin Tropical Tropopause Clouds (UTTCs)
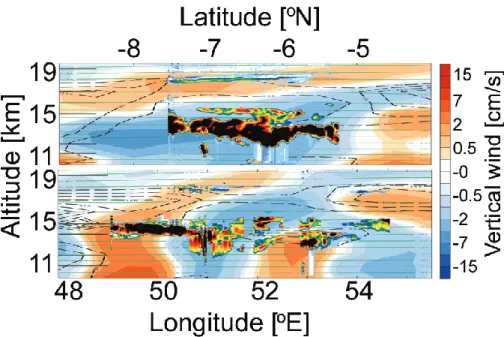
Fig. 6. Similar to Fig. 5, but for 24 February 1999. The top panel shows the North-South flight leg and the lower panel the East-West rebound flight leg on that day. The noise of the lidar signal at ∼50.5◦E was due to icing of the windows of the lidar instrument. UTTCs are clearly visible around 18km altitude, but only in regions with upwelling (reddish colours) and sufficient moisture (dashed lines corresponding to Sice=90%, 100% and 110%).
Acknowledgements. We are grateful to Adrian Tompkins at
ECMWF and Marcia Baker at the University of Washington for fruitful discussions. We thank the European Commission for fund-ing the APE-THESEO campaign, and several national agencies for additional support.
References
Boehm, M. T. and Verlinde, J.: Stratospheric influence on uppertro-pospheric cirrus, Geophys. Res. Lett., 27, 3209–3212, 2000. Danielsen, E. F.: A dehydration mechanism for the stratosphere,
Geophys. Res. Lett. 9, 605–608, 1982.
Folkins, I., Loewenstein, M., Podolske, J., Oltmans, S. J., and Prof-fitt, M.: A barrier to vertical mixing at 14 km in the tropics: Evi-dence from ozonesondes and aircraft measurements, J. Geophys. Res., 104, 22 095–22 102, 1999.
Gage, K. S., McAfee, J. R., Carter, D. A., Ecklund, W. L., Riddle, A. C., Reid, G. C., and Balsley, B. B.: Long-term mean vertical motion over the tropical Pacific – wind profiling Doppler radar measurements, Science, 254, 1771–1773, 1991.
Hamill, P. and Fiocco, G.: Nitric acid aerosols at the tropical tropopause, Geophys. Res. Lett., 15, 1189–1192, 1988. Hartmann, D. L., Holton, J. R., and Fu, Q.: The heat balance of the
tropical tropopause, cirrus, and stratospheric dehydration, Geo-phys. Res. Lett., 28, 1969–1972, 2001.
Hervig, M. and McHugh, M.: Tropical Nitric Acid Clouds, Geo-phys. Res. Lett., 29, 10.1029/2001GL014271, 2002.
Holton, J. R. and Gettelman, A.: Horizontal transport and the dehy-dration of the stratosphere, Geophys. Res. Lett., 28, 2799–2802, 2001.
Jensen, E. J., Pfister, L., Ackerman, A. S., Toon, O. B., and Tabazadeh, A.: A conceptual model of the dehydration of air due to freeze-drying by optically thin, laminar cirrus rising slowly across the tropical tropopause, J. Geophys. Res., 106, 17 237– 17 252, 2001.
Jensen, E. J. and Drdla, K.: Nitric acid concentrations near the trop-ical tropopause: Implications for the properties of troptrop-ical ni-tric acid trihydrate clouds, Geophys. Res. Lett., 29(20), 2001, doi:101029/2002GL015190, 2002.
Koop, Th., Luo, B. P., Tsias, A., and Peter, Th.: Water activity as the determinant for homogeneous ice nucleation in aqueous solutions, Nature, 406, 611–614, 2000.
Luo, B. P., Peter, Th., Fueglistaler, S., et al.: Dehydration potential of ultrathin clouds at the tropical tropopause, Geophy. Res. Lett., 30, doi:10.1029/2002GL016737, 2003.
Peter, Th., Luo, B. P., Wernli, H., et al.: Ultrathin Tropical Tropopause Clouds (UTTCs): I. Cloud Morphology and Occur-rence, Atmos. Chem. Phys., 3, 1083–1091, 2003.
Pruppacher, H. R. and Klett, J. D.: Microphysics of clouds and pre-cipitation, Kluwer Akad. Publ., Dordrecht, 1997.
Sherwood, S. C.: A stratospheric 11 drain” over the maritime con-tinent, Geophys. Res. Lett., 27, 677–680, 2000
Sherwood, S. C. and Dessler, A. E.: On the control of stratospheric humidity, Geophy. Res. Lett., 27, 2513–2516, 2000.
Thomas A., Borrmann, S., Kiemle, Ch., Cairo, F., Volk, M., Beuermann, J., Lepuchov, B., Santacesaria, V., Matthey, R., Rudakov, V., Yushkov, V., MacKenzie, A. R., and Stefanutti, L.: In situ measurements of background aerosol and subvisible cirrus in the tropical tropopause region, J. Geophys. Res., 107, doi:10.1029/2001jd001385, 2002.