HAL Id: hal-02063115
https://hal-amu.archives-ouvertes.fr/hal-02063115
Submitted on 10 Mar 2019
HAL is a multi-disciplinary open access archive for the deposit and dissemination of sci-entific research documents, whether they are pub-lished or not. The documents may come from teaching and research institutions in France or abroad, or from public or private research centers.
L’archive ouverte pluridisciplinaire HAL, est destinée au dépôt et à la diffusion de documents scientifiques de niveau recherche, publiés ou non, émanant des établissements d’enseignement et de recherche français ou étrangers, des laboratoires publics ou privés.
the Strait of Gibraltar in September 1997
Evgeny Dafner, Melchor Gonzalez-Davila, J. Magdalena Santana-Casiano,
Richard Sempere
To cite this version:
Evgeny Dafner, Melchor Gonzalez-Davila, J. Magdalena Santana-Casiano, Richard Sempere. Total organic and inorganic carbon exchange through the Strait of Gibraltar in September 1997. Deep Sea Research (1953), Elsevier, 2001, 8 (5), pp.1217 - 1236. �10.1016/S0967-0637(00)00064-9�. �hal-02063115�
* Correspondence address: Center for Marine Science, University of North Carolina at Wilmington, One Marvin K. Moss Lane, Wilmington NC 284 09, USA. Tel.:#1-910-962-2361; Fax: #1-910-962-24 10.
E-mail address: dafnere@uncwil.edu (E. Dafner).
Deep-Sea Research I 4 8 (2001) 1217}1235
Total organic and inorganic carbon exchange
through the Strait of Gibraltar in September 1997
Evgeny Dafner!!*, Melchor GonzaHlez-DaHvila",
J. Magdalena Santana-Casiano", Richard SempeHreH!
!Microbiologie Marine (CNRS/ INSU, EP2032), Universite& de la Mediterrane&e - Campus de Luminy, Case 907, Marseille
Cedex 9, France
"Departamento de Qun&mica, Universidad de Las Palmas de Gran Canaria, 35017 Las Palmas GC, Spain Received 27 September 1999; received in revised form 9 March 2000; accepted 7 June 2000
Abstract
The total organic carbon (TOC) and total inorganic carbon (C") exchange between the Atlantic Ocean and the Mediterranean Sea was studied in the Strait of Gibraltar in September 1997. Samples were taken at eight stations from western and eastern entrances of the Strait and at the middle of the Strait (Tarifa Narrows). TOC was analyzed by a high-temperature catalytic oxidation method, and C" was calculated from alkalinity}pH" pairs and appropriate thermodynamic relationships. The results are used in a two-layer model of water mass exchange through the Strait, which includes the Atlantic in#ow, the Mediterranean out#ow and the interface layer in between. Our observations show a decrease of TOC and an increase of C" concentrations from the surface to the bottom: 71}132 !M C and 2068}2150 !mol kg#$ in the Surface Atlantic Water, 74 }95 !M C and 2119}214 8 !mol kg#$ in the North Atlantic Central Water, 63}116 !M C and 2123}2312 !mol kg#$ in the interface layer, and 61}78 !M C and 2307}2325 !mol kg#$ in the Mediterranean waters. However, within the Mediterranean out#ow, we found that the concentrations of carbon were higher at the western side of the Strait (75}78 !M C, 2068}2318 !mol kg#$) than at the eastern side (61}69 !M C, 2082}2324 !mol kg#$). This di!erence is due to the mixing between the Atlantic in#ow and the Mediterranean out#ow on the west of the Strait, which results in a #ux of organic carbon from the in#ow to the out#ow and an opposite #ux of inorganic carbon. We estimate that the TOC input from the Atlantic Ocean to the Mediterranean Sea through the Strait of Gibraltar varies from (0.97$0.8)10% to (1.81$0.90)10% mol C s#$ (0.3!10$& to 0.56!10$& mol C yr#$), while out#ow of inorganic carbon ranges from (12.5$0.4 )10% to (15.6$0.4 )10% mol C s#$ (3.99}4 .90!10$& mol C yr#$). The high variability of carbon exchange within the Strait is due to the variability of vertical mixing between in#ow and out#ow along the Strait. The prevalence of organic carbon in#ow and inorganic carbon out#ow shows the
0967-0637/01/$ - see front matter ! 2001 Elsevier Science Ltd. All rights reserved. PII: S 0 9 6 7 - 0 6 3 7 ( 0 0 ) 0 0 0 6 4 - 9
Mediterranean Sea to be a basin of active remineralization of organic material. ! 2001 Elsevier Science Ltd. All rights reserved.
Keywords: Water exchange; Chemical oceanography; Carbon
1. Introduction
The average annual increase of CO& in the atmosphere has been estimated to be about 1.4 ppm yr#$, with a year-to-year #uctuation about the mean of about$0.6 ppm yr#$ (Gammon et al., 1985; Conway et al., 1994 ). It has long been recognized that the oceans are the most intense sink of carbon dioxide in the global carbon cycle, absorbing about half of the carbon of anthropogenic origin released to the atmosphere (Siegenthaler and Sarmiento, 1993). The carbon dioxide sink in the ocean is dominated by the North Atlantic, despite its small area in comparison with the North Paci"c (Watson et al., 1995). To improve the determination of regional or global carbon #uxes (and uncertainties), it is clear that more carbon observations are needed.
Estimates of the meridional total carbon dioxide #ux have been presented for the whole North Atlantic (Martel and Wunsch, 1993) and for di!erent parts of this ocean: the subtropical North Atlantic (Brewer et al., 1989), the tropical Atlantic (Broecker and Peng, 1992; Keeling and Peng, 1995), and the temperate North Atlantic Ocean (Tans et al., 1990). Meridional #uxes of dissolved organic matter in the North Atlantic have been calculated by Walsh et al. (1992). Recently total inorganic carbon (C") and dissolved organic carbon (DOC) transports have been evaluated by Stoll et al. (1996a, b) for the northern North Atlantic Ocean. These authors have pointed out that the meridional transport of DOC cannot be ignored in the total carbon #ux.
One step toward better interpretation of the role of the North Atlantic in the global carbon cycle is to estimate the organic and inorganic carbon exchanges between di!erent marine basins. The Strait of Gibraltar is of special interest in this regard, because it is a single connection between the Atlantic and the Mediterranean Sea, and a comparatively well-studied region from a physical point of view. Despite this, there exists only one indirect estimate of organic and inorganic carbon exchange through this Strait (Copin-MonteHgut, 1993).
In response to increased interest in global carbon change and greenhouse warming, measure-ments of the marine carbon system (i.e., total organic carbon, titration alkalinity, pH) were completed in the CANIGO project (Canary Islands Azores Gibraltar Observations, MAST III Programme). This program included a synoptic survey of spatial variability within the Strait with an emphasis on seasonal monitoring, primarily designed to examine temporal variability and the mechanisms controlling the carbon exchange between the Atlantic and the Mediterranean basins. In this paper, we describe the results of total organic and inorganic carbon exchange through the Strait of Gibraltar measured in September 1997.
2. Study area
The Strait of Gibraltar is a narrow and shallow connection between the Atlantic Ocean and the Mediterranean Sea (Fig. 1). It is in an east}west orientation about 60 km long with a minimum
Fig. 1. Bathymetry in the Strait of Gibraltar and station grid during CANIGO 2 cruise of the RV Thalassa (2}9
September 1997). To the east of the Strait lies the Alboran Sea, the western-most basin of the Mediterranean Sea. To the west of the Strait lies the Gulf of Cadiz, an embayment in the northeast Atlantic Ocean. After La Violette and Lacombe (1988), the section made up of stations 1}3 is called the Spartel Sill section, between stations 4 and 5 the Tarifa Narrows section, and between Gibraltar and Ceuta the Gates of Hercules section.
width of about 12 km at the Tarifa Narrows and an average depth of about 600 m. Thirteen kilometers west of Tarifa Narrows lies the main bathymetric sill of the Strait, the Camarinal sill, with a maximum depth of about 285 m and an area of about 7.86 km& (Guimerans et al., 1988). Another sill (the Spartel sill) is situated 21 km west of the main sill and has a maximum depth of more than 350 m (La Violette and Lacombe, 1988). Between these two sills, is located the Tangier Basin, with a maximum depth of about 64 0 m.
3. Materials and methods
3.1. Sampling
The seawater samples were taken at eight stations within the Strait of Gibraltar from the RV
Thalassa with a CTD rosette system equipped with 10 l Niskin bottles between 2 and 9 September
1997 (Fig. 1). The bottles were "red at the depths of maximum or minimum distribution of temperature, salinity, oxygen and #uorescence, within and between di!erent water masses and at the interface layer between the Atlantic in#ow and Mediterranean out#ow. Samples were taken to within a few meters of the bottom. The positions of the stations are listed in Table 1.
Table 1
Location and depth of the stations with date and time of sampling during the cruise of the RVThalassa, 2}9 September
1997. Time of sampling corresponds to Greenwich Meridian Time and coincides with the beginning of the CTD cast St. no. Stations locations Depth (m) Sampling date Time of sampling
1 5354!W, 36302!N 160 2.09.1997 13 h 20 min 2 5355!W, 35358!N 278 3.09.1997 9 h 00 min 3 5355!W, 35353!N 4 17 4 .09.1997 9 h 06 min 4 5336!W, 35358!N 527 5.09.1997 9 h 10 min 5 5336!W, 35355!N 550 6.09.1997 10 h 11 min 6 5318!W, 36305!N 732 7.09.1997 9 h 35 min 7 5318!W, 36302!N 827 8.09.1997 7 h 50 min 8 5318!W, 35358!N 575 9.09.1997 9 h 22 min
3.2. Total organic carbon measurements
The 15 ml samples were collected in glass tubes, precombusted prior to the cruise (4 503C, at least 6 h) and closed with Te#on! PFA-backed screw caps that had been rinsed with Milli-Q water and dried. Samples were not "ltered and were drawn as soon as possible after the rosette sampler was on the deck of the ship (either "rst or immediately following the gas samples). During sampling, seawater was allowed to #ow directly from the Niskin stopcock without the stopcock touching the tubes to reduce the chance of contamination. Samples were taken in duplicate, poisoned by addition of HgCl& (10 mg l#$"nal concentration), stored in the dark and analyzed in the Laborat-ory of Marine Microbiology, CNRS, Marseille.
The Shimadzu instrument used in this study was the commercially available Model TOC-5000 total carbon analyzer with quartz combustion column in the vertical position "lled with 1.2% Pt silica pillows (Cauwet, 1994 ). A sample volume of 100 !l was used. Subsamples were acidi"ed with 10 !l of 85% H' PO% and sparged for 10 min at a #ow rate of 50 ml min#$ with CO& -free pure air to purge inorganic carbon. Each sample, standard or blank was injected 3}4 times. The nominal analytical precision of the procedure was within 2%, but some variability in results from two di!erent vials gives rise to an actual precision that is lower (4 }6%). The catalyst bed was conditioned by injecting 100 !l of acidi"ed and sparged Milli-Q water until the lowest stable integrated area was obtained. Standardization was carried out every day with potassium hydrogen phthalate diluted in Milli-Q water (three concentrations).
The instrument response factor, measured as the slope of the standard addition to Milli-Q water (r&'0.999 for 11 runs), remained relatively constant and reproducible over the time of
analysis. In general, calibration curves did not exhibit di!erences in slope (average slope: 5917$184 , N"11), and the bias between slopes was within approximately 3%. The system blank was determined by analyzing low-carbon water (LCW) from ampoules provided by J. Sharp (University of Delaware) and was found to be about 5 !M C (the average DOC concentration in the Deep Paci"c Water reference was 4 2$5 !M C). The total organic carbon (TOC) concentrations in samples were calculated by averaging all replicate sample injections, subtracting the average LCW value as the total blank and dividing by the slope of the standard curve.
Intercalibration exercises in 1995, organized by Dr. J.H. Sharp, indicated that our instrument was suitable for marine DOC studies.
3.3. Total inorganic carbon
Total inorganic carbon (C") was computed from experimental values of pH" and total alkalinity, the carbonic acid dissociation constants of Roy et al. (1993), and the boric acid dissociation constant of Dickson (1990). Several authors have examined the thermodynamic consistency of the measured components of the carbonate system (e.g., Millero et al., 1993; Clayton et al., 1995; Lee et al., 1997; McElligott et al., 1998). From these studies it appears that at present it is not possible to draw a "rm conclusion regarding the best set of constants to use. Considering the accuracy of photometric pH ($0.002) and potentiometric total alkalinity ($1 !mol kg#$) determinations (Mintrop et al., 1999), Lee et al. (1997) estimated that the probable errors in C" determined with the Roy et al. (1993) constants is around 4 !mol kg#$. This is slightly higher than the accuracy of the experimental value ($2 !mol kg#$, Johnson et al., 1993). Recent determinations of pH", A " and C" in the Azores area have shown internal consistency among these paramenters. C" measured was only, on average, 0.54 !mol kg#$ higher than C" calculated, with a standard deviation of $2.6 !mol kg#$, when the Roy et al. (1993) constants were used (Mintrop and GonzaHlez-DaHvila, unpublished observations).
The pH on the total scale was measured following the spectrophotometric technique of Clayton and Byrne (1993) using the m-cresol purple indicator (DOE, 1994 ). A system similar to that
described by Bellerby et al. (1995) was developed in our lab. The pH measurements were done with a Hewlett Packard Diode Array spectrophotometer in a 253C-thermostated 1-cm #ow-cell by using a Peltier system. Using a stopped-#ow protocol, seawater previously thermostated to 253C was analyzed for blank determinations at 730, 578 and 4 34 nm. The #ow was restarted and the indicator injection valve switched on to inject 10 !l dye through a mixing coil (2 m). Three photometric measurements were carried out for each injection in order to remove any dye e!ect on the seawater pH measurement.
Total alkalinity of seawater was determined by titration with HCl to the carbonic acid end point using two potentiometric systems (Millero et al., 1993) described previously (Mintrop et al., 1999). In brief, the titration systems consisted of a Titrino 702SM titrator (Metrohm, Herisau, Switzer-land) and a Titrino 719S, both interfaced to personal computers. All measurements were made in thermostated plastic cells provided by F. Millero of the Rosenstiel School of Marine and Atmo-spheric Sciences (RSMAS), Miami, Florida. Both the acid, in a water-jacketed burette, and the seawater sample, in a water-jacketed cell, were maintained at 253C with a constant temperature bath. The titration was performed by adding HCl to the seawater past the carbonic acid end point. A computer program was used to run the titration, record the volume of the acid added and the EMF readings of the electrodes. The HCl solution (25 l, 0.25 M) was made from concentrated analytical grade HCl (Merck!, Darmstadt, Germany) in 0.4 5 M NaCl, in order to yield an ionic strength similar to open ocean seawater. The acid was standardized by the titration of weighed amounts of Na& CO' dissolved in 0.7 M NaCl solution resulting in a value of 0.2505$0.0001 M. The acid concentration was also determined by coulometry at RSMAS (F. Millero). The results of both methods agree within $0.0001. The total alkalinity of seawater was evaluated from the proton balance at the alkalinity equivalence point, pH#$%&'"4.5, according to the exact de"nition
of total alkalinity (Dickson, 1981). A FORTRAN computer program (provided by F. Millero) was used to calculate the carbonate parameters (Millero et al., 1993). The precision of the "t (s value) is
better than 0.4 !mol kg#$ for the samples analyzed. The performance of the titration systems was monitored by titration of di!erent batches of CRM (!35) that have known C" and A ". The agreement of our alkalinity values with the CRM data was within $1.5 !mol kg#$.
4. Results and discussion
4.1. Hydrography
Over the past decade it has been shown that &the present dynamical understanding of the exchange through the Strait of Gibraltar is that it is hydraulically controlled so that the physical dimensions of the Strait combined with the overall evaporation over the Mediterranean basin determine how much #ow can get through the Strait and how much saltier the Mediterranean is than the Atlantic' (Bryden and Kinder, 1991; Kinder and Bryden, 1992). A classical model of water mass exchange through the Strait of Gibraltar suggests that two water layers interact in the Strait: the Atlantic in#ow, which spreads to the Mediterranean Sea, and the Mediterranean out#ow, which out#ows from the Mediterranean Sea. In#ow slightly exceeds out#ow to balance the net loss from the excess of evaporation over the Mediterranean Sea. The interaction of these water bodies within the Strait produces an extremely strong halocline, which allows identi"cation of a third transition or interface layer between them (Wesson and Gregg, 1994 ; Bray et al., 1995). Table 2 gives some characteristics of the water bodies found within the Strait in September 1997.
The Atlantic in#ow forms in the Gulf of CaHdiz and is a mixture of Surface Atlantic Water (SAW; salinity of about 36.4 6), North Atlantic Central Water (NACW, salinity less than 36.00), and Spanish Coastal Water (SCW, salinity of about 36.10 (Van Geen et al., 1988, 1991)). The thickness of the Atlantic in#ow is highly variable, and in September 1997 it decreased from about 120 m above the Southern Spartel sill to 4 0}50 m along the Gates of Hercules section (Table 2).
The interface layer is de"ned by a sharp halocline with a change in salinity of about 1.50, occurring at a depth between 4 0 and 230 m (Table 2). Lacombe and Richez (1982) used the salinity values 37.00}37.50, and Bryden et al. (1989) the values 36.50}38.00 to characterize the interface layer between the two #ows. Following Bryden et al. (1994 ) and Bray et al. (1995), we have divided the interface layer at its mid-depth and incorporated the upper part of the interface into the upper layer and the lower part into the lower layer. Salinity values for the mid-depth are 37.00 for the Spartel sill section, 37.32 for the Tarifa Narrows and 37.50 for the Gates of Hercules section. The interface layer was found to be deeper, thicker, fresher and colder on the west of the Strait. As seen from Table 2, along the Spartel sill section, there is evident slope of the interface layer from the north (4 6 m) to the south (125 m). The shallowest position of this layer was found along the Gates of Hercules section (4 0}50 m), where it continued to get saltier and warmer.
The high-density Mediterranean out#ow is marked by high salinity and temperature. It forms by a mixing of Levantine Intermediate Water (LIW) and Western Mediterranean Deep Water (WMDW). The LIW originates in the eastern Mediterranean and is characterized by intermediate maxima in temperature (about 13.003C) and salinity (about 38.50) (Kinder and Bryden, 1990). The residual LIW is found preferentially in the northwestern part of the Alboran Sea in a depth band of
Tab le 2 So m e ch ar ac te ri st ic s of w at er m as se s in th e St ra it o fG ib ra lta r, as ob se rv ed in S ep te m be r 19 97 .T O C an d C " re pr es en t w ei gh te d av er ag e co nc en tr at io n s. N A C W w as fo un d on ly abo ve th e Cam ari na l si ll sec ti on (st at ion s 1} 3) St . no . Su rf ace A tlan tic W ate r N o rt h A tl ant ic C en tr al Wa ter Inter fac e laye r M ed iter ra ne an Wa ter s De p th (m ) S TO C (! M) C " (!mo lk g #$ ) De p th (m) S TO C (! M) C " (!mol k g #$ ) De p th (m ) S TO C (! M) C " (!mo lk g #$ ) D ep th (m ) S TO C (! M) C " (!mo lk g #$ ) 10 }46 36 .0 8} 36 .4 4 95 20 85. 4 46 }63 36 .0 3} 36 .0 8 93 21 38 .0 63 }15 0 36. 08 }37 .23 83 2189 .4 ** * 23 00. 2 20 }67 36 .08 }36 .30 115 20 92. 7 67 }103 35 .9 9} 36 .0 8 96 21 42 .8 103 }22 0 36. 08 }38 .23 75 2227 .6 215 }25 7 38. 23 }38 .3 3 * 23 06. 4 30 }125 36 .08 }36 .34 85 20 90. 6 125 }158 36 .0 3} 36 .0 8 81 21 27 .0 158 }27 0 36. 08 }38 .24 75 2233 .1 270 }39 9 38. 24 }38 .3 5 69 23 15. 9 40 }108 36 .11 }36 .4 3 87 20 99. 5 ** * * 10 8} 21 8 36. 43 }38 .39 76 224 8.7 218 }50 3 38. 39 }38.4 8 66 23 06. 5 50 }94 36 .09 }36 .26 82 21 04 .5 ** * * 94 }28 5 36. 26 }38 .37 64 2222 .5 28 5} 52 9 38. 37 }38 .4 7 64 23 16. 4 60 }41 36 .40 }36 .50 87 20 89. 7 ** * * 41 }22 0 36. 50 }38 .32 74 2266 .0 220 }71 8 38. 32 }38 .5 0 69 23 17. 9 70 }44 36 .5 4} 36 .70 88 21 11. 7 ** * * 44 }23 0 36. 70 }38 .32 80 2265 .2 230 -82 2 38. 32 }38 .4 9 67 23 19. 7 80 }46 36 .2 1} 36 .35 * 21 11. 4 ** * * 46 }18 0 36. 35 }38 .33 * 22 44 .4 18 0} 55 2 38. 33 }38 .4 9 64 *
200}600 m and is essentially absent near the African coast. The maximum salinity values (ca. 38.50) were observed at the Tarifa Narrows and along the Gates of Hercules section (Table 2). WMDW is formed by the winter convection south of France (Medoc Group, 1970; Stommel, 1972) and is characterized by decreasing salinity and temperature (38.4 2}38.4 4 and (12.903C). The salinity distribution in Fig. 2 demonstrates that at Tarifa Narrows and along the Gates of Hercules, values of salinity in the near-bottom layer were about 38.4 5, always higher than those de"ning WMDW. A similar situation, which indicates a small contribution of WMDW to the out#ow, has been described previously by a number of other investigators (Roether and Weiss, 1975; Measures and Edmond, 1988; Minas et al., 1991).
The water exchange through the Strait is under the in#uence of periodic forces, such as tides (La Violette and Lacombe, 1988), and aperiodic forces, such as atmospheric pressure (Stanton, 1983), wind stress over the western Mediterranean Sea and the Gulf of CaHdiz (GruKndlich, 1981), formation of the WMDW during winter convection, and features of the Alboran Gyre circulation (Bryden and Stommel, 1982). As a result, the water #ow in the Strait is not in the form of continuous currents but rather in tidally induced pulses, which vary in the amount of water they contain according to the daily and monthly variation in the above-mentioned factors. Additionally, tide pulses are strongly a!ected by the bathymetric constriction (the small cross section and the presence of the sills). These short-period pulses are able to trigger very short internal waves and current fronts in the upper layer, which propagate eastward into the Alboran Sea during the #ood tide (Boyce, 1975; LaViolette and Lacombe, 1988; Alpers et al., 1996).
4.2. TOC and C" vertical distributions
Because of the great variability of the dynamic environment, it is di$cult to present any maps or vertical sections from direct observations from the Strait of Gibraltar. Moreover, our presentation here is limited to discussion of vertical pro"les of TOC and C" distributions (Fig. 2). For a general impression of spatial variability of both organic and inorganic carbon, the weighted concentrations of TOC and C" for each water layer were also calculated (Table 2).
The main feature of the TOC vertical distribution in Fig. 2 is the presence of several maxima, located in the SAW (almost at all stations) and in the interface layer (St. 2, 4 , 6, 7). The C" vertical distribution shows an increasing concentration from the surface to the base of the interface layer and homogeneous values within the Mediterranean waters. An additional feature of the C" vertical distribution is a subsurface maximum located in the NACW (St. 2, 3). Fig. 2 shows that the TOC concentrations in the SAW ranged from 71 !M C (St. 7, 30 m) to 132 !M C (St. 2, 60 m) while C" ranged from 2068 !mol kg#$(St. 1, 17 m) to 2150 !mol kg#$ (St. 4 , 108 m). Fig. 2 also shows that the upper maximum of TOC was related to the maximum of chlorophyll a. Table 2 shows the
decrease of TOC and the increase ofC" integrated concentrations within SAW from the Atlantic
Ocean side to the Mediterranean.
Signals of the NACW, with salinity values lower than 36.08, were found only above the Spartel sill (St. 1}3) with TOC and C" concentrations of 74 }95 !M C and 2119}214 8 !mol kg#$. In the interface layer TOC concentrations ranged from 63 !M C (St. 5, 237 m) to 116 !M C (St. 7, 51 m). For this layer, C" concentrations varied from 2123 !mol kg#$(St. 5, 100 m) to 2312 !mol kg#$ (St. 4 , 212 m). The lowest TOC and the highest C" values were observed in the Mediterranean waters (Table 2): 61 !M C (St. 6, 718 m; St. 7, 61 m; St. 8, 201 m) to 78 !M C (St. 6, 100 m) and
Fig. 2. Vertical distributions of salinity, chlorophylla (!g l#$), TOC (!M C) and C" (!mol kg#$) in the di!erent parts of the Strait of Gibraltar. Stations 1}3 were situated above Spartell Sill, stations 4 }5 at Tarifa Narrows, and stations 6}7 at Gates of Hercules.
2307 !mol kg#$ (St. 3, 301 m) to 2325 !mol kg#$ (St. 7, 398 m). However, in these waters, the Atlantic side in general shows higher TOC (75}78 !M C) and lower C" (2068}2318!mol kg#$) concentration than the Mediterranean side (65}69 !M C and 2082}2324 !mol kg#$). By contrast, the integrated values show (Table 2) that the di!erence between TOC concentrations in the Mediterranean waters above the Spartel sill and between Gibraltar and Ceuta is at the limit of TOC determination ($5 !M C).
TOC values measured in September 1997 are similar to those reported by various investigators in the di!erent seas of the Mediterranean basin (Cauwet et al., 1990; Cauwet, 1991; Avril and Copin-MonteHgut, 1992; Copin-MonteHgut and Avril, 1993a, b; Cauwet et al., 1997; Yoro et al., 1997) and in the Atlantic Ocean (Carlson et al., 1994 ; Thomas et al., 1995; Doval et al., 1997). Similar TOC concentrations were also found in the Strait of Gibraltar in June 1997 (Dafner et al., 1999). By contrast, Gasol et al. (1998) and Doval et al. (1999) presented DOC concentrations in deep waters of the Catalan-Balearic Sea as low as 4 4 }52 !M C. In April 1998, lower TOC concentrations (38}52 !M C) were also measured in the LIW in the western Alboran Sea (Dafner et al., 2000b). Comparison of TOC values measured near the Gates of Hercules section in June and September 1997 with observations from April 1998 suggests a seasonal cycle of organic carbon within the LIW, implying signi"cant bacterial turnover of the organic material in this water mass (Packard et al., 1988).
In the Mediterranean Sea, no directly measured C" values were found in the literature; all of them are based on pH}alkalinity data. The values reported by PeHrez et al. (1986), Copin-MonteHgut (1993) and Frankingnoulle et al. (1990) for LIW in the Mediterranean Sea (2320}2330 !mol kg#$) are similar to those reported here. Directly measured C" values for the North}East Atlantic Central Water ranged from 2128 to 2135 !mol kg#$ (Mintrop and GonzaHlez-DaHvila, 1999, unpub-lished data; Rios et al., 1995), consistent with the values reported here.
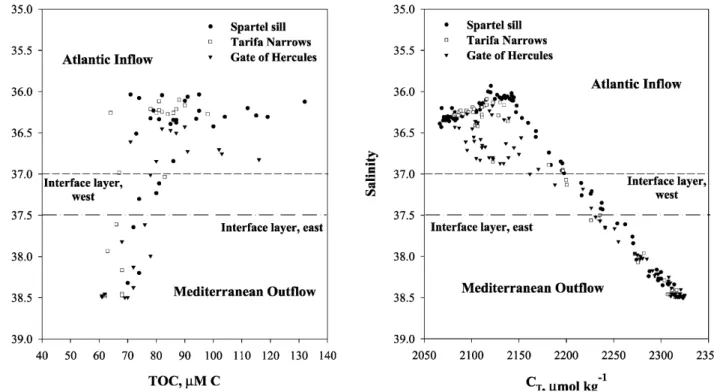
4.3. Relationships of TOC and C" to salinity
The description of vertical distribution of TOC and C" presented previously does not take explicit account of tidal variability in the exchange through the Strait. Most of the out#ow occurs in bursts during the semidiurnal tidal cycle: when the out#owing tide is strongest, the interface is relatively shallow and so there is a thick layer of Mediterranean water #owing swiftly over the Camarinal sill. Conversely, on the in#owing tide, the interface is relatively deep and so there is a thick layer of Atlantic water #owing swiftly into the Mediterranean. Such bursts account for more than half of the exchange across the Camarinal sill between the Atlantic and Mediterranean basins (Bryden et al., 1989; Bray et al., 1995).
To remove discrepancies caused by tidal #uctuations, relationships of TOC and C" to salinity were developed (Fig. 3). Fig. 3 shows large departures from linearity in both TOC and C" concentrations in the Atlantic in#ow and in the upper interface layer (salinity lower than 37.00), but a linear decrease of TOC and increase of C" values with salinity higher than 37.00. The departures are due either to biological processes or variability of salinity, which a!ects C" content in seawater. Although the correlation between TOC and salinity is weak (r&"0.56, n"25), it is still signi"cant. By contrast, a strong correlation is found between C" and salinity greater than 37.00 (r&"0.97, n"96). Fig. 3 also suggests that the relationship between C" and salinity is more signi"cant when data from the euphotic layer are removed (r&"0.99, n"131); a lower C" content
Fig. 3. Scatter plots of TOC and C" pools vs. salinity. Strong Atlantic in#ow is marked by salinity less than 36.50, the Mediterranean out#ow by salinity greater than 38.00. Intermediate salinities depict the interface layer between the two layers, a zone where substantial periods of both in#ow and out#ow are typical. The 37.00 isohaline approximates an average position of the interface layer above the Spartell sill section, 37.32 at the Tarifa Narrows and 37.50 along the Gates of Hercules section.
is found there due to consumption of inorganic carbon by photosynthesis. The regression line is C""2120($1.5)#79.24 ($0.83)(S!36.00),
which gives C" values similar to those obtained using only the Mediterranean out#ow. No C" variation is discernible at the computed precision between waters with the same salinity but from di!erent depths. This indicates that biological production does not have any appreciable in#uence on C" in this region and that there is only a binary mixing between the Atlantic and Mediterranean waters. Brunet et al. (1984 ) and Copin-MonteHgut (1993) have presented for the Alboran Sea similar relationships between C" and salinity. The C" values from them are slightly lower than those reported here, but these di!erences could be due to the systematic di!erences in the pH measurements (photometric pH vs. NBS potentiometric pH) and the error in the equilib-rium constants (Roy et al. (1993) vs. Dickson and Millero (1987).
The speci"c total inorganic carbon (C"/S) shows a linear relationship with salinity below 100 m. A similar relationship is found for the equivalent speci"c total organic carbon (TOC/S) with
salinity in the whole pro"le except for the chlorophyll maximum (Fig. 4 ). The regression lines between the speci"c C" (in !mol kg#$) and speci"c TOC (in !M C) and salinity
C"/S"4 0.39(0.75)#0.516(0.020)S, TOC/S"12.4 6(0.92)!0.279(0.025)S,
Fig. 4 . Scatter plot of speci"c TOC and C" vs. salinity. Linear regressions are found for C" values below 100 m and TOC except for TOC values in the chlorophylla maximum.
do not pass through the origin. The speci"c C" of the Mediterranean waters is higher than that of the less saline Atlantic waters. A substantial quantity of inorganic carbon is added to seawater during its residence time in the Mediterranean Sea. This enrichment may be explained by inputs from the rivers, the Black Sea, the atmosphere and the remineralization of organic carbon. The remineralization is clearly shown in the speci"c TOC vs. salinity plot, where the Mediterranean
in#ow shows a signi"cant reduction in TOC content with respect to the Atlantic in#ow.
According to Bryden et al. (1989), at salinities less than 36.50 there is a strong in#ow, which we show is characterized by highest TOC and lowest C" concentrations (64 }132 !M C and 2068}2170 !mol kg#$). For the Mediterranean water salinities greater than 38.00, there is strong out#ow, and the lowest TOC and highest C" contents (75}78 !M C and 2274 }2314 !mol kg#$ above the Spartel sill, and 65}69 !M C and 2278}2325 !mol kg#$ along the Gates of Hercules section) are found in the out#owing waters. For intermediate salinities, there are substantial periods of both in#ow and out#ow with intermediate values of TOC and C".
4.4. TOC and C" balance through the Strait of Gibraltar
In reviewing di!erent balance estimations, Bryden and Kinder (1988) have concluded that the #ows through the Strait are apparently limited, from 1 to 2!10( m' s#$. Later estimates suggest that transports through the Strait of Gibraltar are 30% smaller than historical estimates and, furthermore, tidal oscillations contribute nearly half of the total transport (Bryden and Kinder, 1991). Because of the great variability of the dynamic environment, it is di$cult to assign, from direct observations, mean values of water transports for TOC and C" balance calculations.
For our calculations, we use the two-layer model of water mass exchange through the Strait and present TOC and C" budgets calculated according to the water transport estimates measured
Table 3
Water transport (Sv), salinity, TOC (!M C) and C" (!mol kg#$) values applied for carbon balance estimations (Fig. 5) through the Strait of Gibraltar. According to Bray et al. (1995) and Tsimplis and Bryden (1999), errors in the in#ow and
out#ow transports are considered to be 0.06 Sv
Variables Spartel sill Tarifa Narrows Gates of Hercules
Atlantic inyow Transport 0.74 0.69 0.82 Salinity 36.30$0.06 36.4 2$0.02 36.67$0.17 TOC 95$9 80$8 89$7 C " 2116$12 2128$12 2129$15 Mediterranean outyow Transport 0.74 0.69 0.82 Salinity 37.65$0.50 38.28$0.02 38.36$0.02 TOC 71$1 66$3 67$3 C" 2277$10 2301$8 2310$2
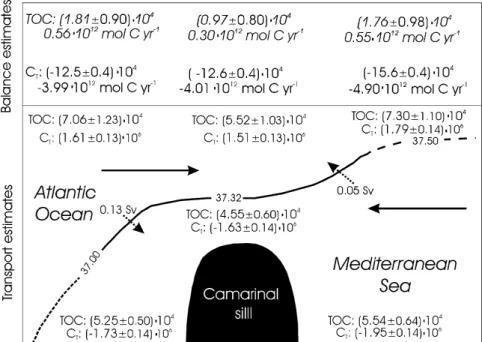
during the Gibraltar experiment (Bryden et al., 1994 ; Bray et al., 1995). Recent determinations in the framework of the CANIGO project have shown volume transport values for the eastern entrance of the Strait of 0.81 and!0.76 Sv with an accuracy of 0.06 Sv. These estimates are in good agreement with the measurements from Bryden et al. (1994 ) (0.72$0.16, !0.68$0.15 Sv). For the western entrance, the average out#ow is }0.67 Sv and the average in#ow 0.78 Sv (Tsimplis and Bryden, 1999). The in#ow and out#ow are in reasonable balance, with a slightly higher in#ow, as expected, to balance the net evaporation over the Mediterranean basin. Table 3 shows volume transport values used in this study for each section. In turn, TOC and C" transports were estimated by dividing the interface layer according to the salinity values (37.00, 37.32 and 37.50 from west, center and east of the Strait), and incorporating the upper part of the interface into the upper layer (Atlantic in#ow) and the lower part into the lower layer (Mediterranean out#ow). For budget estimations, integrated values of carbon for out#ow and in#ow at each station were averaged along longitudinal sections. Table 3 also shows the calculated average values of salinity, TOC and C" for these layers, taken for the carbon #uxes estimates. Multiplying the average TOC and C" concentra-tions by water transport of the upper and lower layers yields TOC and C" transports. Summarizing all carbon transports along longitudinal sections gives the carbon balance. Results of these calculations are presented in Fig. 5.
The dominant feature of carbon exchange through the Strait of Gibraltar is organic carbon in#ow to the Mediterranean Sea and inorganic carbon out#ow from the Mediterranean Sea. We estimate that the TOC transport from the Atlantic to the Mediterranean Sea varies from (0.97$0.87)10% to (1.81$0.90)10% mol C s#$ (0.30!10$& to 0.57!10$& mol C yr#$). Recently, we found that the TOC balance through the Strait was 0.4 5!10$& mol C yr#$ in June 1997 and 0.38!10$& mol C yr#$ in April 1998, on average (Dafner et al., 1999). This estimate is similar to the average value of TOC in#ow presented here for September 1997 (0.4 7!10$& mol C yr#$). The C" balance from the Mediterranean Sea to the Atlantic Ocean varies from (12.5$0.4 )10% to
Fig. 5. Two-layer model of water mass exchange through the Strait of Gibraltar with values of TOC and C" transports (lower panel) and balances (upper panel) along the Strait (2}9 September 1997).
(15.6$0.4 )10% mol C s#$ for the di!erent longitudinal sections, which gives annual estimates of 3.8!10$& }4 .9!10$& mol C yr#$.
The interaction between in#ow and out#ow results in strong shear, which induces vertical exchange between layers (Wesson and Gregg, 1994 ; Bray et al., 1995). In order to balance the salinity exchange in the Strait, and considering the input of water and the evaporation are negligible on this area, we estimate that the out#ow increases volume transport by the entrainment at 0.13 Sv from the western entrance. By contrast, the Atlantic in#ow increases its volume only by 0.05 Sv from the eastern entrance of the Strait by mixing with out#ow (Fig. 5). The di!erence in vertical mixing between in#ow and out#ow from the west and east of the Strait is }0.08 Sv, in agreement with recent observation of Tsimpis and Bryden (1999). In terms of carbon, these vertical exchanges correspond to 0.87!10( and !0.4 8!10% mol C s#$ for TOC, and 0.11!10( and !0.3!10( mol C s#$ for C". The vertical mixing on the Atlantic side results in an input of organic carbon compounds from the in#ow to the out#ow and in the opposite direction for inorganic carbon (Tables 2 and 3).
Indirect estimates of organic and inorganic carbon balances were recently published by Copin-MonteHgut (1993). For DOC, she presented a value of 1.25!10$& mol C yr#$, which is twice as high as our estimations for each longitudinal section. This di!erence is due to the TOC concentrations used (in her calculation she used DOC values of 67 !M C for the in#owing and 92 !M C for the out#owing waters), rather than di!erent water transport estimates. By contrast, C" balances obtained by Copin-MonteHgut and Brunet et al. (1984 ) (!4 .6!10$& and }6.1!10$& mol C yr#$) are the same as we present here despite their use of di!erent water transport estimates. It was estimated that in the Gulf of CaHdiz, entrainment increases the observed amount of carbon out#ow, to about 8.6!10( mol C s#$ for C" and 2.1!10) mol C s#$ for TOC on leaving the outer Gulf of CaHdiz (Dafner et al., 2000a). It gives the net carbon transport with the Mediterranean out#ow to the
Table 4
Historical estimates of meridional TCO& and DOC #uxes in the North Atlantic Ocean. Negative values correspond to southward transport
Areas Carbon transport (mol C s#$) References
Section at 25(N and through the Florida Straits !0.68!10( Brewer et al. (1989) Temperate North Atlantic !1.60!10( Broecker and Peng (1992) Tropical Atlantic !1.05!10( $0.4 8!10( Keeling and Peng (1995) Section&583N, North Atlantic !0.16!10( Stoll et al. (1996a) Section&583N, North Atlantic (DOC) 0.04!10( }0.16!10( Stoll et al. (1996b)
open ocean of about 8.8!10( mol C s#$. This carbon bulk is about 61.5% of the amount of fossil fuel CO& released into the atmosphere currently (ca. 14 .3!10( mol s#$) (Anderson et al., 1991). The estimates of carbon #uxes through the Strait of Gibraltar are similar to those presented recently for the meridional TCO& and DOC transports in the northern North Atlantic (Table 4 ). Polat and Tugrul (1996) obtained a value of 1.79!10% ton C yr#$ (or 0.15!10$* mol C yr#$) for the TOC export from the Sea of Marmora to the Aegean Sea and of about 0.4 1!10% ton C yr#$ (or 0.34!10+ mol C yr#$) for the TOC out#ow in the opposite direction. As we see, TOC in#ow and out#ow through the Strait of Gibraltar are two and three orders of magnitude higher than through the Turkish Straits. Several authors have evaluated the budget of dissolved organic nitrogen and phosphorus through the Strait (BeHthoux and Copin-MonteHgut, 1986; Coste et al., 1988). They have found that in#ow from the Atlantic Ocean exceeds out#ow from the Mediterranean Sea. Our data, together with the results quoted above, indicate that in#ow of organic material to the Mediterra-nean Sea through the Strait of Gibraltar is considerably higher than out#ow. The MediterraMediterra-nean Sea acts as a sink of organic carbon and source of inorganic carbon for the Atlantic Ocean.
Acknowledgements
The authors gratefully acknowledge F. Abrahansen and M. Goutx for their help with cruise preparation. We thank the crew of the RVThalassa for their help and support, and L.M. Laglera
for his help with sample collection and alkalinity determination. Our special thanks go to J. Sharp, who kindly provided the deep Paci"c and carbon-free water reference standards. We thank C. Goyet for critical reading and constructive comments on the developing manuscript. This research was funded by the European Commission, MAST III Programme (Contract MAS3-CT96-0060). Financial support for E.V. Dafner came from Ministere A!aires Etrange`res Francais and Conseil GeHneHral des Bouches du Rho(ne, France.
References
Alpers, W., Brandt, P., Rubino, A., Backhaus, J.O., 1996. Recent contributions of remote sensing to the study of internal waves in the Strait of Gibraltar and Messina. Bulletin de l'Institut oceHanographique, Monaco 17, 21}4 0.
Anderson, L.G., Holby, O., Lindergren, R., Ohlson, M., 1991. The transport of carbon dioxide into the Weddel Sea. Journal of Geophysical Research 96, 16679}16687.
Avril, B., Copin-Montegut, G., 1992. La matieHre organique dissoute lors d' &&Almofront-1''. Workshop Report, Fronts geostrophiques, Marseille-Luminy, octobre, pp. 14 }22.
Bellerby, R.G.J., Turner, D.R., Millward, G.E., Worsfold, P.J., 1995. Shipboard #ow injection determination of sea water pH with spectrophotometric detection. Analitica Chimica Acta 309, 259}270.
BeHthoux, P., Copin-MonteHgut, G., 1986. Biological "xation of atmospheric nitrogen in the Mediterranean Sea. Limnol-ogy and Oceanography 31 (6), 1353}1358.
Boyce, F.M., 1975. Internal waves in the Strait of Gibraltar. Deep-Sea Research 22, 597}610.
Bray, N.A., Ochoa, J., Kinder, T.N., 1995. The role of the interface in exchange through the Strait of Gibraltar. Journal of Geophysical Research 100 (C6), 10755}10776.
Brewer, P.G., Goyet, C., Dyrssen, D., 1989. Carbon dioxide transport by ocean currents at 253N latitude in the Atlantic Ocean. Science 24 6, 4 77}4 79.
Broecker, W.S., Peng, T.}H., 1992. Interhemispheric transport of carbon dioxide by ocean circulation. Nature (London) 356, 587}589.
Brunet, C., Poisson, A., Lebel, J., Porot, V., 1984 . AlkaliniteH totale}carbone inorganique}calcium}densiteH. In: Propri-eHtieHteHs Hydrologiques et Climatiques des Eaux du Basin Occidental de la MediterraneHe. Compagne Mediprod IV*15 Octobre}17 Novembre 1981, ReHsultats des Compagnes a la Mer, Vol. 26. Centre National pour l'Explotation des OceHans, BreHst, France, pp. 89}93.
Bryden, H.L., Stommel, H.M., 1982. Origins of the Mediterranean out#ow. Journal of Marine Research 4 0, 55}71.
Bryden, H.L., Kinder, T.N., 1988. Gibraltar experiment: a plan for dynamic and kinematic investigations of strait mixing, exchange and turbulence. Oceanologica Acta SP, 29}4 0.
Bryden, H.L., Brady, E.C., Pillsbury, R.D., 1989. Flow through the Strait of Gibraltar. In: Almazan, J.L., Bryden, H.L., Kinder, T.N., Parilla, G. (Eds.), Seminario Sobre la Oceanogra"a Fisica del Estrechode Gibraltar. SECEG, Madrid, pp. 166}194 .
Bryden, H.L., Kinder, T.N., 1991. Steady two-layer exchange through the Strait of Gibraltar. Deep-Sea Research 38 (Suppl. 1), S4 4 5}S4 63.
Bryden, H.L., Candela, J., Kinder, T.N., 1994 . Exchange through the Strait of Gibraltar. Progress in Oceanography 33, 201}24 8.
Carlson, C.A., Ducklow, H.W., Michaels, A.F., 1994 . Annual #ux of dissolved organic carbon from the euphotic zone in the northwestern Sargasso Sea. Nature 371, 4 05}4 08.
Cauwet, G.A., 1991. Distribution of organic carbon in the Gulf of Lions: the in#uence of Rho(ne inputs. In: Martin, J.M., Barth, H. (Eds.), Commission of the European Communities, Water Pollution Research Reports, EROS 2000, Second Workshop on the Northwest Mediterranean Sea, pp. 209}229.
Cauwet, G., 1994 . HTCO method for dissolved organic carbon analysis in seawater: in#uence of catalyst on blank estimation. Marine Chemistry 4 7, 55}64 .
Cauwet, G., SempeHreH, R., Saliot, A., 1990. Le carbone organique dissous dans de mer: con"rmation de la sous-estimation anteHrieure. Compe Rendus Academie des Sciences 311 (II), 1061}1066.
Cauwet, G., Miller, A., Brasse, S., Fengler, G., Mantoura, R.F.C., Spitzy, A., 1997. Dissolved and particulate organic carbon in the western Mediterranean Sea. Deep-Sea Research II 4 4 (3}4 ), 769}779.
Clayton, T.D., Byrne, R.H., 1993. Spectrophotometric seawater pH measurements: total hydrogen ion concentration scale calibration ofm-cresol purple and at-sea results. Deep-Sea Research I 4 2, 4 11}4 29.
Conway, T.J., Tans, P.P., Watermark, L.S., Thoning, K.W., Kitzis, D.R., Masarie, K.A., Zhang, N., 1994 . Evidence for interannual variability of the carbon cycle from NOAA/CMDL Global air sampling network. Journal of Geophysical Research 99 (D11), 22831}22855.
Copin-MonteHgun, C., 1993. Alkalinity and carbon budgets in the Mediterranean Sea. Global Biogeochemical Cycles 7 (4 ), 915}925.
Copin-MonteHgut, G., Avril, B., 1993a. Vertical distribution and temporal variation of dissolved organic carbon in the North}West Mediterranean Sea. Deep-Sea Research I 4 0 (10), 1963}1972.
Copin-MonteHgut, G., Avril, B., 1993b. Dissolved organic carbon in the NW Mediterranean Sea. Annales de l'Institut oceHanoqraphique, Paris 69 (1), 123}124 .
Coste, B., Le Corre, P., Minas, H.J., 1988. Re-evalution of the nutrient exchange in the Strait of Gibraltar. Deep-Sea Research 35 (5), 767}775.
Dafner, E.V., SempeHreH, R., Goutx, M., 1999. Seasonal and interannual variations of organic carbon exchange through the Strait of Gibraltar. In: Parrilla, G. (Ed.), Final Scienti"c Report CANIGO-MAST 3}CT 96}0060, November, Instituto Espan" ol de OceanografmHa, 334 pp.
Dafner, E.V., GonzaHlez-DaHvila, M., Santana-Casiano, J.M., 2000a. Importance of the Mediterranean eddies (Meddies) on the carbon cycling in the eastern North Atlantic Ocean. Global Biogeochemical Cycles, submitted for publication. Dafner, E.V., SempeHreH, R., Bryden, H.L., 2000b. Total organic carbon distribution and budget through the Strait of
Gibraltar in April 1998. Marine Chemistry, in press.
Dickson, A.G., 1981. An exact de"nition of total alkalinity and a procedure for the estimation of alkalinity and total inorganic carbon from titration data. Deep-Sea Research 28, 609}623.
Dickson, A.G., Millero, F., 1987. A comparison of the equilibrium constants for the dissociation of carbonic acid in seawater media. Deep-Sea Research 34 , 1733}174 3.
Dickson, A.G., 1990. Thermodynamics of the dissociation of boric acid in synthetic sea water from to 273.15 to 318 K. Deep-Sea Research 37, 755}766.
DOE, 1994 . In: Dickson, A.G., Goyet, C. (Eds.), Handbook of Methods for the Analysis of the various Parameters of the Carbon-dioxide System in Sea water; Version 2. ORNL/CDIAC-74 .
Doval, M.D., ADlvarez-Salgado, X.A., PeHrez, F.F., 1997. Dissolved organic matter in a temperate embayment a!ected by coastal local upwelling. Marine Ecology Progress Series 157, 21}37.
Doval, M.D., PeHrez, F.F., Berdalet, E., 1999. Dissolved and particulate organic carbon in the northwestern Mediterra-nean Sea. Deep-Sea Research I 4 6 (3), 511}527.
Frankingnoulle, M., De Caluwe, M., Bouquegneau, J.-M., 1990. Utilisation de l'alcaliniteH totale comme traccur de masses d'eau. Bulletin de la Societe Royale des Sciences de Liege 2, 105}111.
Gammon, R.H., Sundquist, E.T., Frazer, P.J., 1985. History of carbon dioxide in the atmosphere. In: Trabalka, J., Rheichle, D. (Eds.), Atmospheric Carbon dioxide and the Global Carbon Cycle: A Global Analysis. Springer, New York, USA.
Gasol, J.M., Doval, M.D., Pinhassi, J., CalderoHn-Paz, J.I., Guixa-Boixareu, N., Varque, D., PedroHs-AlioH, C., 1998. Diel variations in bacterial heterotrophic activity and growth in the north-western Mediterranean Sea. Marine Ecology Progress Series 164 , 107}124 .
GruKndlich, M.L., 1981. On the observation of a solitary event in the Mediterranean out#ow west of Gibraltar.`Meteora Forschungsergebnisse, Reihe A/B 23, 15}4 6.
Guimerans, V., Can" avate, R., Palma, R., 1988. Contribution to the knowledge of the Gibraltar Sill. In: Almazan, J.L., Bryden, H.L., Kinder, T.N., Parilla, G. (Eds.), Seminario Sobre la Oceanogra"a Fisica del Estrechode Gibraltar. SECEG, Madrid, pp. 83.
Johnson, K.M., Wills, K.D., Butler, D.B., Johnson, W.K., Wong, C.S., 1993. Coulometric total carbon dioxide analysis for marine studies: maximazing the performance of an automated gas extraction system and coullometric detector. Marine Chemistry 4 4 , 167}187.
Keeling, R.F., Peng, T.}H., 1995. Transport of heat, CO&, and O& by the Atlantic's thermohaline circulation. Philosophi-cal Transactions of the Royal Society of London, Series B 34 8, 133}14 2.
Kinder, T.H., Bryden, H.L., 1990. Aspiration of deep waters through straits. In: Pratt, L.J. (Ed.), The Physical Oceanography of Sea Straits. Kluwer Academic Publishers, Netherlands, pp. 295}319.
Kinder, T.H., Bryden, H.L., 1992. Hydraulic control in the Strait of Gibraltar. Bulletin de l'Institut oceHanographique, Monaco 11, 113}126.
Lacombe, H., Richez, C., 1982. The regime of the Strait of Gibraltar. In: Nihoul, C.J. (Ed.), Hydrodynamics of Semienclosed Seas. Elsevier, New York, pp. 13}73.
La Violette, P. E., Lacombe, H., 1988. Tidal-induced pulses in the #ow through the Strait of Gibraltar. Oceanologica Acta SP, 13}27.
Lee, K., Millero, F.J., Wanninkhof, R., 1997. The carbon dioxide system in the Atlantic Ocean. Journal of Geophysical Research 102, 15693}15707.
Martel, F., Wunsch, C., 1993. The North Atlantic circulation in the early 1980s * an estimate from inversion of a "ne di!erence model. Journal of Physical Oceanography 23, 898}924 .
McElligott, S., Byrne, R.H., Lee, K., Wanninkhof, R., Millero, F.J., Felly, R.A., 1998. Discrete water column measure-ments of CO
& fugacity and pH" in seawater: a comparison of direct measurements and thermodynamic calculations. Marine Chemistry 60, 63}73.
Measures, C.I., Edmond, J.M., 1988. Aluminium as a tracer of the deep out#ow from the Mediterranean Sea. Journal of Geophysical Research 93 (C1), 591}595.
Medoc Group, 1970. Observation of formation of Deep Water in the Mediterranean Sea.Nature 227, 1037}104 0.
Millero, F.J., Zhang, J.-Z., Lee, K., Campbell, D.M., 1993. Titration alkalinity of seawater. Marine Chemistry 4 4 , 14 3}152.
Minas, H.J., Coste, B., Le Corre, P., Minas, M., Raimbault, P., 1991. Biological and geochemical signatures associated with the water circulation through the Strait of Gibraltar and in the Western Alboran Sea. Journal of Geophysical Research 96 (C5), 8755}8771.
Mintrop, L.M., PeHrez, F.F., GonzaHlez-DaHvila, M., Santana-Casiano, J.M., KoKrtzinger, A., 1999. Alkalinity determination by potentiometry}intercalibration using three di!erent methods. Ciencias Marinas, in press.
Packard, T.T., Minas, H.J., Coste, B., Martinez, R., Bowin, M.C., Gostan, J., Gar"eld, P., Christensen, J., Dortch, D., Minas, M., Copin-MonteHgut, G., Copin-MonteHgut, C., 1988. Formation of the Alboran oxygen minimum zone. Deep-Sea Research 35 (7), 1111}1118.
PeHrez, F.F., Estrada, M., Salad, J., 1986. Sistema del carboHnico, oxmHgeno y nutrientes en el MediterraHneo occidental. Investigacion Pesquera 50 (3), 333}351.
Polat, C7 ., Tugrul, S., 1996. Chemical exchange between the Mediterranean and the Black Sea via the Turkish straits. Bulletin de l'Institut oceHanographique, Monaco, CIESM Science Series 2 SP 17, 167}186.
Rios, A.F., Anderson, T.R., PeHrez, F.F., 1995. The carbonic system distribution and #uxes in the NE Atlantic during Spring 1991. Progress in Oceanography 35, 295}314 .
Roether, W., Weiss, W., 1975. On the formation of the out#ow through the Strait of Gibraltar. Geophysical Research Letter 2, 301}304 .
Roy, R.N., Roy, L.N., Lawson, M., Vogel, K.M., Porter-Moore, C., Davis, W., Millero, F.J., Campbell, D.M., 1993. Determination of the ionization constants of carbonic acid in seawater. Marine Chemistry 4 4 , 24 9}259.
Siegenthaler, U., Sarmiento, J.L., 1993. Atmospheric carbon dioxide and the ocean. Nature 365, 119}125.
Stommel, N., 1972. Deep winter-time convection in the western Mediterranean Sea. In: Gordon, A.L. (Ed.), Studies in Physical Oceanography., Vol. 2. Gordon and Breach, New York, pp. 232.
Stanton, B.R., 1983. Low frequency variability in the Mediterranean Out#ow west of Gibraltar. Deep-Sea Research 30 (7A), 74 3}761.
Stoll, M.H.C., Van Aken, H.M., De Baar, H.J.W., De Boer, C.J., 1996a. Meridional carbon dioxide transport in the northern North Atlantic. Marine Chemistry 55, 205}216.
Stoll, M.H.C., Van Aken, H.M., De Baar, H.J.W., Kraak, M., 1996b. Carbon dioxide characteristics of water masses in the northern North Atlantic. Marine Chemistry 55, 217}232.
Tans, P.P., Fung, I., Takahashi, T., 1990. Observational constrains on the global atmospheric CO
& budget. Science 24 7, 14 31}14 38.
Thomas, C., Cauwet, G., Minster, J.-F., 1995. Dissolved organic carbon in the equatorial Atlantic Ocean. Marine Chemistry 4 9, 155}169.
Tsimplis, M., Bryden, H.L., 1999. Estimation of transport through the Strait of Gibraltar. Geophysical Research Abstracts, Vol. 1(2). 24 th General Assembly, European Geophysical Society, The Hague, p. 392.
Van Geen, A., Rosener, P., Boyle, E., 1988. Entrainment of trace-metal-enriched Atlantic-shelf water in the in#ow to the Mediterranean Sea. Nature 331, 4 23}4 26.
Van Geen, A., Boyle, E., Moore, W.S., 1991. Trace metals enrichments in waters of Gulf of Cadiz, Spain. Geochimica et Cosmochimica Acta 55, 2173}2191.
Walsh, J.J., Carder, .K.L., MuKller-Karger, F.E., 1992. Meridional #uxes of dissolved organic matter in the North Atlantic Ocean. Journal of Geophysical Research 97 (C10), 15625}15637.
Watson, A.J., Nightingale, P.D., Cooper, D.J., 1995. Modelling atmosphere}ocean CO
& transfer. Philosphical Transac-tions of the Royal Society of London B 34 8, 125}132.
Wesson, J.C., Gregg, M.C., 1994 . Mixing at Camarinal Sill in the Strait of Gibraltar. Journal of Geophysical Research 99 (C5), 984 7}9878.
Yoro, S.C., SempeHreH, R., Turley, C., Unanue, M.A., Durrieu De Madron, X., Bianchi, M., 1997. Cross-slope variations of organic carbon and bacteria in the Gulf of Lions in relation to water dynamics (northwestern Mediterranean). Marine Ecology Progress Series 161, 255}264 .