http://journals.tubitak.gov.tr/zoology/ © TÜBİTAK
doi:10.3906/zoo-1407-11
Distribution of two pine processionary moth species in
Turkey evidences a contact zone
Kahraman İPEKDAL1,4, Christian BURBAN2, Carole KERDELHUÉ3, Selim Süalp ÇAĞLAR4 1Department of Biology, Faculty of Science and Literature, Ahi Evran University, Kırşehir, Turkey
2INRA, UMR 1202 BIOGECO (INRA/Université de Bordeaux), Cestas Cedex, France 3INRA, UMR CBGP (INRA-IRD-CIRAD–Montpellier SupAgro), Montferrier sur Lez Cedex, France
4Department of Biology, Faculty of Science, Hacettepe University, Ankara, Turkey
1. Introduction
The pine processionary moth (Lepidoptera, Notodontidae), hereafter PPM, is an economically important pine pest in the Mediterranean forests (Masutti and Battisti, 1990), as its larvae feed on needles of pines, and its urticating larval setae cause severe allergy, especially in mammals (Vega et al., 1997; Rodríguez-Mahillo et al., 2012). PPM larval development generally occurs through the winter. The gregarious larvae, if not feeding, rest in silken nests that they build on the tips of pine branches in winter and pupate underground in summer. Adults emerge at the end of summer, live a few days, and die after mating and laying eggs on pine needles (Démolin, 1969).
PPM has been known in Turkey for a long time. The oldest record belongs to Albert Kindermann, a German lepidopterist, who made an expedition in northern Turkey between 1848 and 1850 (Lederer, 1885). We also found records of control efforts in İstanbul in 1904 in the Ottoman archives. Numerous records are available from the Republic period, especially after the 1940s (Acatay, 1953; Sekendiz and Varlı, 2002). Thus, we are confident that PPM has been present for at least 165 years in northern Anatolia.
The PPM species found in Turkey was thought to be Thaumetopoea pityocampa (Denis and Schiffermüller, 1775), as in Europe and western North Africa, until Salvato et al. (2002) and Simonato et al. (2007) showed that the species occurring in southern and northern Turkey was actually its sister species, T. wilkinsoni Tams, 1924, which is distributed in Anatolia, Cyprus, Crete, and the Middle East (Kerdelhué et al., 2009). Yet, no sample from northwestern Turkey was included in this work.
Kerdelhué et al. (2009) were the first to mention that the ranges of the two species could intersect in Turkey. Due to insufficient sampling in northwestern Turkey, and the use of a single mitochondrial marker, the possibility of a contact zone between T. pityocampa and T. wilkinsoni was still questionable. Therefore, the objective of the present work is to determine whether a contact zone exists in northwestern Turkey, which is Anatolia’s only continental connection to Europe. Furthermore, due to their similar morphologies, habitat requirements, reproductive behaviors, and pheromone chemical structures, Frérot and Démolin (1993) suggested that the two sister species could be crossed to produce hybrids under laboratory conditions. Therefore, we also aimed to search for signs
Abstract: The pine processionary moths Thaumetopoea pityocampa and T. wilkinsoni are among the most important Mediterranean pine
defoliators. Although recent studies suggest that the two species may coexist in Turkey, the relevant literature lacks precise information on the occurrence and exact distribution of the two species in this country. In particular, whether the two sister taxa form a contact zone is still unknown. In this study, we aimed to reveal the limits of the ranges of the two species in Turkey by using nuclear (ITS-1, photolyase) and mitochondrial markers (COI). Multilocus molecular characterization of the two species showed for the first time that the two species co-occur in some of the sampling sites. In addition, we determined clear signatures of mitochondrial introgression between the two species, and therefore the existence of a possible hybrid zone within Turkey. These results bring up interesting questions relating to the evolution of the identified hybrid zone.
Key words: Pine processionary moth, Thaumetopoea pityocampa, T. wilkinsoni, mitochondrial introgression, asymmetric hybridization,
contact zone, Turkey
Received: 04.07.2014 Accepted/Published Online: 11.12.2014 Printed: 30.09.2015 Research Article
of a possible past or recent hybridization between the two species in Turkey. To achieve this goal, we sampled PPM all over Turkey and characterized one mitochondrial and two nuclear markers to: (1) precisely describe the distribution range of both species in Turkey for the first time; and (2) possibly identify signs of introgression between them, which would translate into incongruent molecular identification depending on the marker used for the introgressed individuals.
2. Materials and methods 2.1. Sampling and DNA protocols
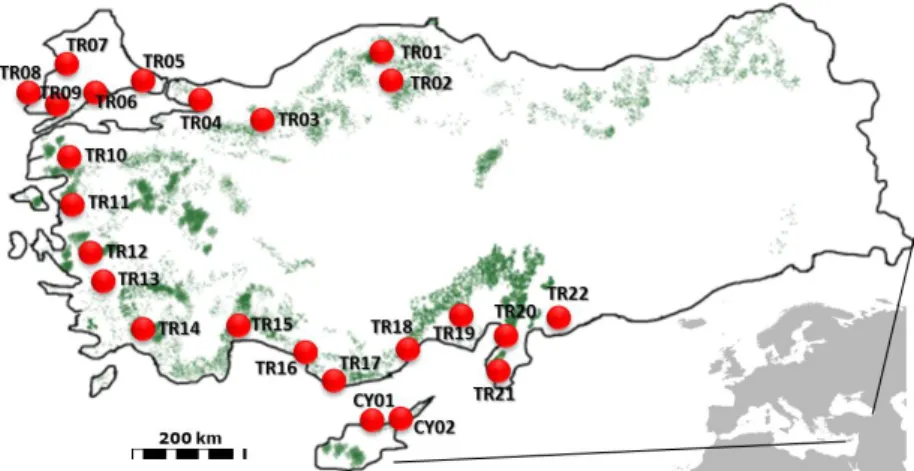
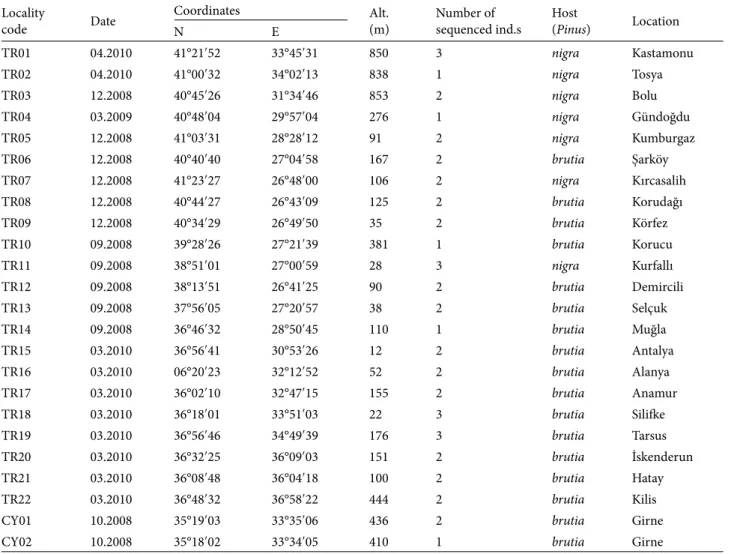
Eggs and larvae of PPM were collected from 22 locations in Turkey and from 2 locations in Cyprus (Figure 1; Table 1) between 2008 and 2010. Collected egg batches were kept at room temperature until hatching, and then first instar larvae were transferred to 70% ethanol. When larvae were already present in the field, they were directly sampled in the nests and transferred to 70% ethanol. All samples in ethanol were stored at –20 °C. DNA was extracted from the whole larval body for the first instars and from the head for later instars by using a standard chloroform-isoamyl alcohol procedure, as described in Gemmell and Akiyama (1996).
From the 24 locations visited, 47 separate nests and egg batches were collected, and one single individual was studied per colony to avoid sampling siblings. Each individual was amplified and sequenced for a 810-bp region of the mitochondrial COI gene using the primers Jerry and Pat (Simon et al., 1994), a 510-bp region of the ITS-1 gene using the primers ITS-1-F and -R (Vogler and DeSalle, 1994), and a 660-bp region of the photolyase gene using the primers described in Simonato et al. (2013). All PCR amplifications were performed in 25 µL reactions. Annealing temperatures for COI, ITS-1, and photolyase were 48, 50, and 50 °C, respectively. The concentration and
purity of amplified DNA were estimated using NanoDrop 8000 v. 2.0. Sequencing was performed on an ABI PRISM 3130 genetic analyzer using BigDye Terminator chemistry (Applied Biosystems). In order to compare sequences obtained in this study with reference sequences, and thus identify specimens using molecular taxonomy, we downloaded previously published sequences from GenBank. Concerning the COI gene, we added sequences corresponding to T. pinivora (Sweden, GenBank accession number: EF185144.1), T. wilkinsoni (Israel, EF210075.1), and T. pityocampa (France, EF185138.1). For the ITS-1 marker, we downloaded haplotypes corresponding to T. wilkinsoni (Cyprus, EF189687.1) and T. pityocampa (France, EF189685.1). Finally, photolyase sequences corresponding to T. pinivora (Sweden, JX182492), T. wilkinsoni (Turkey, JX182496.1), and T. pityocampa (Italy, JX182493) were also added to the data.
2.2. Data analyses
For each gene, consensus sequences were reconstructed from both strands using CodonCode Aligner 1.63 (Ewing et al., 1998) and aligned using the Clustal W 2.0.11 algorithm (Thompson et al., 1994) in BioEdit 7.1.3 (Hall, 1999).
Nucleotides, amino acid composition, and genetic distances were assessed assuming the Jukes-Cantor model sequence evolution (Jukes and Cantor, 1969) with 10,000 bootstraps in MEGA 5 (Tamura et al., 2011). The best-fit model was determined by using the model check option in MEGA 5. A 95% confidence statistical parsimony network was constructed using TCS 1.21 (Clement et al., 2000).
Evolutionary distances were calculated as the number of base substitutions per site by averaging over all sequence pairs within and between each species. Divergence within species was estimated by using COI, ITS-1, and photolyase haplotypes of T. pityocampa and T. wilkinsoni; divergence between species was estimated by using COI, ITS-1, and
Figure 1. Map of sampling locations and coniferous forests in Turkey and Cyprus
photolyase haplotypes of T. pityocampa and T. wilkinsoni and COI and photolyase sequences of T. pinivora downloaded from GenBank (accession numbers are given above). Analyses were conducted using the Jukes–Cantor model (Jukes and Cantor, 1969) with 10,000 bootstraps. The rate variation among sites was modeled with a gamma distribution (shape parameter = 1). All positions containing gaps and missing data were eliminated. Evolutionary analyses were conducted in MEGA 5 (Tamura et al., 2011).
Reference sequences downloaded from GenBank were aligned together with sequences obtained from the present study by using the Clustal W 2.0.11 algorithm (Thompson et al., 1994) in BioEdit 7.1.3 (Hall, 1999). Species identification was conducted by checking the sequences manually and grouping them according to their similarity.
Chromatograms were investigated for traces of hybridization by using BioEdit 7.1.3 (Hall, 1999). In the case of recent or ongoing hybridization, two divergent sequences can be found in a single nucleus for a single marker. This means that a gene sequence belonging to
a hybrid nucleus has two of the parental nucleotides together, and relevant chromatograms have double peaks at polymorphic nucleotide positions (Lefebvre et al., 2008). Finally, mtDNA and nuclear DNA sequences were compared for each individual to discriminate pure individuals that have congruent mitochondrial and nuclear sequences from introgressed individuals, i.e. those exhibiting incongruent species assignation between markers, as suggested by Hansen et al. (2000). Thus, we defined an individual as introgressed if the three markers concerning their specific assignation for that individual are not congruent.
Maximum-likelihood, neighbor-joining, and maximum-parsimony methods were performed separately to reconstruct phylogenetic trees of haplotypes and alleles for each of the three markers (COI, ITS-1, and photolyase) by using MEGA 5 (Tamura et al., 2011). Bootstrap probabilities were obtained with 10,000 replicates. The obtained trees were visualized using TreeGraph 2 (Stöver and Müller, 2010).
Table 1. Sampling details.
Locality
code Date
Coordinates Alt.
(m) Number ofsequenced ind.s Host(Pinus) Location
N E TR01 04.2010 41°21ʹ52 33°45ʹ31 850 3 nigra Kastamonu TR02 04.2010 41°00ʹ32 34°02ʹ13 838 1 nigra Tosya TR03 12.2008 40°45ʹ26 31°34ʹ46 853 2 nigra Bolu TR04 03.2009 40°48ʹ04 29°57ʹ04 276 1 nigra Gündoğdu TR05 12.2008 41°03ʹ31 28°28ʹ12 91 2 nigra Kumburgaz TR06 12.2008 40°40ʹ40 27°04ʹ58 167 2 brutia Şarköy TR07 12.2008 41°23ʹ27 26°48ʹ00 106 2 nigra Kırcasalih TR08 12.2008 40°44ʹ27 26°43ʹ09 125 2 brutia Korudağı TR09 12.2008 40°34ʹ29 26°49ʹ50 35 2 brutia Körfez TR10 09.2008 39°28ʹ26 27°21ʹ39 381 1 brutia Korucu TR11 09.2008 38°51ʹ01 27°00ʹ59 28 3 nigra Kurfallı TR12 09.2008 38°13ʹ51 26°41ʹ25 90 2 brutia Demircili TR13 09.2008 37°56ʹ05 27°20ʹ57 38 2 brutia Selçuk TR14 09.2008 36°46ʹ32 28°50ʹ45 110 1 brutia Muğla TR15 03.2010 36°56ʹ41 30°53ʹ26 12 2 brutia Antalya TR16 03.2010 06°20ʹ23 32°12ʹ52 52 2 brutia Alanya TR17 03.2010 36°02ʹ10 32°47ʹ15 155 2 brutia Anamur TR18 03.2010 36°18ʹ01 33°51ʹ03 22 3 brutia Silifke TR19 03.2010 36°56ʹ46 34°49ʹ39 176 3 brutia Tarsus TR20 03.2010 36°32ʹ25 36°09ʹ03 151 2 brutia İskenderun TR21 03.2010 36°08ʹ48 36°04ʹ18 100 2 brutia Hatay TR22 03.2010 36°48ʹ32 36°58ʹ22 444 2 brutia Kilis
CY01 10.2008 35°19ʹ03 33°35ʹ06 436 2 brutia Girne
3. Results
From the 47 specimens sequenced, 42 COI, 31 ITS-1, and 41 photolyase sequences were clear enough to be reliably used in subsequent analyses.
3.1. Genetic diversity, distance, and taxonomic identification
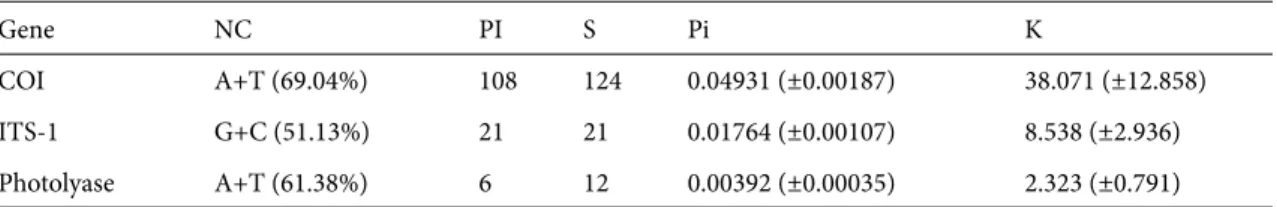
Summary statistics regarding nucleotide composition and diversity of obtained sequences are given in Table 2. The total number of COI haplotypes was 21 in T. wilkinsoni (w), while only a single haplotype was found in T. pityocampa (p). Within T. wilkinsoni’s range, haplotype diversity seems
to be higher in the southern regions (18/22) and decreases towards western and northern Turkey (4/22) (Figure 2a). Low diversity was observed for nuclear markers ITS-1 and photolyase, with only 3 (2 w, 1 p) and 2 (1 w, 1 p) alleles, respectively (Figures 2b and 2c).
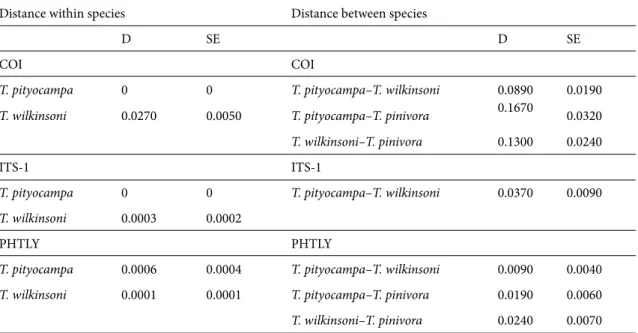
According to the observed genetic distances, which are shown in Table 3, mitochondrial divergence within and between species was larger than divergence observed within and between species for the two studied nuclear sequences. Divergence between T. pityocampa and T. wilkinsoni (COI 0.0890; photolyase 0.0090) was smaller
Table 2. Nucleotide composition and diversity parameters.
Gene NC PI S Pi K
COI A+T (69.04%) 108 124 0.04931 (±0.00187) 38.071 (±12.858)
ITS-1 G+C (51.13%) 21 21 0.01764 (±0.00107) 8.538 (±2.936)
Photolyase A+T (61.38%) 6 12 0.00392 (±0.00035) 2.323 (±0.791)
NC: nucleotide composition Pi: nucleotide diversity
PI: number of parsimony informative sites k: average paired differences among sequences
S: number of polymorphic sites
Figure 2. Distribution maps of a) COI, b) ITS-1, and c) photolyase haplotypes. Haplotypes are colored and numbered in
accordance with the network. Color and sign codes are given in the legends on the maps. d) Haplotype networks for COI, ITS-1, and photolyase. Numbers on the dashed lines indicate how many mutations separate two relevant haplotypes.
than that between T. pityocampa and T. pinivora (COI 0.1670; photolyase 0.0190) and T. wilkinsoni and T. pinivora (COI 0.1300; photolyase 0.0240).
By comparing the sequences obtained from this study with the reference sequences downloaded from GenBank, 13 COI, 8 ITS-1, and 9 photolyase alleles were grouped together with reference sequences from T. pityocampa, whereas 29 COI, 23 ITS-1, and 32 photolyase alleles were grouped together with reference sequences from T. wilkinsoni. By further comparing individuals according to the three markers studied, 8 individuals were identified as T. pityocampa, 27 as T. wilkinsoni, and 3 as introgressed (Table 4). The taxonomy of nine individuals remained unknown owing to inferior sequence quality.
Different phylogeny reconstruction methods yielded similar topologies, summarized in the phylogenetic trees in Figure 3.
3.2. Distribution of PPM species and haplotypes in Turkey
Sequences obtained from the three gene regions were compared to the reference sequences of T. pityocampa and T. wilkinsoni for taxonomic identification. Our results showed that both T. pityocampa and T. wilkinsoni were present in Turkey. While most of the pine forests in southern, western, and northern Turkey are dominated by T. wilkinsoni, T. pityocampa is more prevalent in the Thrace region (European Turkey) (Figures 2a–2c and 4). However, they slightly enter each other’s range. In
Table 3. Estimates of average molecular distance within and between species regarding the three markers studied.
Distance within species Distance between species
D SE D SE
COI COI
T. pityocampa 0 0 T. pityocampa–T. wilkinsoni 0.0890 0.0190
T. wilkinsoni 0.0270 0.0050 T. pityocampa–T. pinivora 0.1670 0.0320 T. wilkinsoni–T. pinivora 0.1300 0.0240
ITS-1 ITS-1
T. pityocampa 0 0 T. pityocampa–T. wilkinsoni 0.0370 0.0090
T. wilkinsoni 0.0003 0.0002
PHTLY PHTLY
T. pityocampa 0.0006 0.0004 T. pityocampa–T. wilkinsoni 0.0090 0.0040
T. wilkinsoni 0.0001 0.0001 T. pityocampa–T. pinivora 0.0190 0.0060
T. wilkinsoni–T. pinivora 0.0240 0.0070
D: evolutionary divergence, SE: standard error.
Table 4. Genetic assignation of the individuals studied and designation of introgressed individuals (Ia, Ib). Haplotype
numbers correspond to the numbers on the haplotype distribution maps and haplotype network in Figure 2. Locality N COI haplotype ITS1 haplotype Photolyase haplotype Genetic assignation
Northwestern Turkey 8 1 1 1 P
Gelibolu 1 1 2 1 Ia
İzmir 2 1 2 - Ib
Southeastern Turkey and Cyprus 27 2–22 2, 3 2 W
p: pure T. pityocampa; w: pure T. wilkinsoni; Ia, Ib: introgressed individual, N: number of individuals.
particular, T. pityocampa is also seen in the northern Aegean region (western Turkey), and T. wilkinsoni is also seen in the Thrace region (European Turkey) around the Marmara Sea. T. wilkinsoni mitochondrial haplotypes were structured geographically into three clades (southern, western, and northern Turkey: yellow; southeastern Turkey: blue [closely related to the Israeli haplotype: black]; Cyprus: red, in Figures 2a and 2d) (Figure 3).
3.3. The contact zone, hybridization, and introgression
Although T. pityocampa and T. wilkinsoni are mostly distributed in separate areas in Turkey, both species were found on adjacent trees at the same locality in the European part of İstanbul, northern Gelibolu, and İzmir. These localities were taken as the limits of the contact zone, which is depicted by an elliptical circle in Figures 2a–2c and Figure 4.
Evaluation of the chromatograms did not show any hybrid sequences. However, we found taxonomic incongruences between nuclear and mitochondrial markers for three individuals, one of which was found in Gelibolu and the other two in İzmir (Ia and Ib, respectively, Table 4 and Figure 4; I: introgression, a/b: different patterns found) (arrows in Figures 2a–2c). An individual from the Gelibolu sample was classified as T. pityocampa according to mitochondrial and photolyase sequences, while this individual was classified as T. wilkinsoni according to ITS-1 sequences (Ia). On the other hand, two individuals from the İzmir sample were classified as T. pityocampa, according to their mitochondrial haplotypes, and were classified as T. wilkinsoni based on nuclear genes (ITS-1 and photolyase) (Ib).
Figure 3. Consensus haplotype trees for COI, ITS-1, and
photolyase. Three clades of wilkinsoni haplotypes are shown in shaded rectangles. All branches have bootstrap support values > 60%.
Figure 4. Distribution of pure T. wilkinsoni (black) and T. pityocampa (white),
introgressed individuals (gray with Ia and Ib), dispersal routes and barriers, and the contact zone. Color and sign codes are given in the map legend.
4. Discussion
4.1. Distribution, diversity, and geographic structure of PPM haplotypes in Turkey
One of our aims in this study was to determine the distribution and geographic limits of the two PPM species by using molecular methods. The haplotype distributions given in Figure 2 show that the ranges of T. pityocampa and T. wilkinsoni coincide in Turkey, a result that ends former discussions concerning the taxonomy of the PPM species within Turkey.
T. wilkinsoni populations showed significant structuring (similar to what was found in Simonato et al. (2007)) according to mitochondrial haplotypes. High structuring among mitochondrial haplotypes is expected in organisms such as PPM whose females are less mobile than males (Moritz et al., 1987; Salvato et al., 2002). This low mobility along with geographical barriers such as the Mediterranean Sea and the Anatolian Diagonal (the massive mountain range extending from south to northeast in Turkey) explains most of the observed structure among mitochondrial haplotypes.
The dominant pine species in Turkey are Pinus brutia, distributed mainly in southern and western Turkey, and P. nigra, found mainly in northern Turkey with partial scattered populations in the south. However, no correlation has been found between the distributions of PPM and the host plant species.
Our results suggest a decreasing trend in genetic diversity towards northern latitudes. Although more extensive samplings are necessary to confirm this, such a trend would not be surprising because an increasing number of studies are showing a reduction in genetic diversity from south to north due to postglacial recolonization events (Hewitt, 1996, 2003; Thompson, 2005; Pinho et al., 2007), a phenomenon known as “pioneer and phalanx” (Nichols and Hewitt, 1996).
4.2. The contact zone and possible hybridization between
T. pityocampa and T. wilkinsoni
We found that the ranges of the two species intertwine in northwestern Anatolia. This overlap seems to have resulted in mitochondrial introgression between the two species that reveals itself as discordance between the nuclear and mitochondrial DNA data, a pattern which is not expected in pure individuals. This pattern can also appear as a result of incomplete lineage sorting (Knowles, 2007); however, it is not a convincing explanation in our case, because discordance between mitochondrial and nuclear topologies was found only in the contact zone, not in the entire range as would be expected under an incomplete lineage-sorting scenario (Buckley et al., 2006). Thus, the most plausible hypothesis for the observed pattern is the existence of a hybrid zone.
In this study, a few individuals identified as T. wilkinsoni according to nuclear genes were found to carry mitochondrial
genes from the T. pityocampa clade. However, the opposite situation was never observed (i.e. T. pityocampa individuals carrying mitochondrial haplotypes from T. wilkinsoni). Therefore, we conclude the presence of an asymmetric pattern of mitochondrial introgression from the northwestern pityocampa clade to the southeastern wilkinsoni clade. However this conclusion needs to be clarified by using a larger sample of individuals in order to see if the asymmetric introgression observed in this study is the common pattern or was a chance encounter. We also found an individual (in Gelibolu) which has a discordance between photolyase and ITS-1 haplotypes (i.e. an individual classified as T. pityocampa according to mtDNA and photolyase sequences and carrying ITS-1 sequences from T. wilkinsoni). This presents further evidence of hybridization between species and hints at the possibility of finding more individuals with mosaic genomes. Further studies using a large panel of markers (i.e. genes) are needed to confirm these findings.
Contact zones often vary in width from a few hundred meters to hundreds of kilometers depending on how they are maintained and the selective forces prevailing in and out of the zone (Barton, 1982; Barton and Hewitt, 1985; Howard, 1986; Moore and Price, 1993). The contact zone that we found in this study is relatively narrow. If our results are not a reflection of sampling bias, the low dispersal capacity of PPM could explain the relatively narrow width of this contact zone and why it has not spread out. However, questions on the selective forces maintaining this hybrid zone and their possible effect on speciation and diversification remain unknown. Extensive sampling from the contact zone and characterization of a wide range of molecular markers, in addition to morphological, demographic, and ecological properties of the two species, are needed in order to better understand and quantify the evolutionary forces acting in this contact zone.
Acknowledgements
We warmly acknowledge the help of Caner Sarıgöl, A Cem Kuyucu, İsmail K Sağlam, M Mustafa Akıner, Mehmet Çivici, N Turgut Saner, Selis Yılmaz, and Şeref Yalım for joining field works or providing insect materials; Sibel Küçükyıldırım and Duygu P Öksüz in extracting DNA; Isabelle Pivotto in using software; and Sarah Monllor in sequencing. We also thank the two anonymous reviewers for their contributions to an earlier version of the manuscript. This study is a part of the PhD project of Kİ. Fieldwork was supported by TÜBİTAK-TOVAG (109O411), and a 6-months scientific visit of Kİ to INRA Bordeaux (France) was supported by the Turkish Higher Education Council (YÖK) PhD Research Scholarship. Sequencing was performed at the Genomic and Sequencing Facility of Bordeaux (grants from the Conseil Regional d’Aquitaine, 20030304002FA and 20040305003FA; the European Union, FEDER 2003227; and Investissements d’avenir, Convention attributive d’aide ANR-10-EQPX-16-01).
References
Acatay A (1953). Çam kese böceği (Thaumetopoea pityocampa Schiff. = Thaumetopoea wilkinsoni Tams) hakkında araştırmalar ve adalardaki mücadelesi. İ.Ü. Ormn Fak Dergisi 3: 29–47 (in Turkish).
Barton NH (1982). The structure of the hybrid zone in Uroderma bilobatum (Chiroptera: Phyllostomatidae). Evol 36: 863–866. Barton NH, Hewitt GM (1985). Analysis of hybrid zones. Ann Rev
Ecol Syst 16: 113–148.
Buckley TR, Cordeiro M, Marshall DC, Simon C (2006). Differentiating between hypotheses of lineage sorting and introgression in New Zealand Alpine Cicadas (Maoricicada Dugdale). Syst Biol 55: 411–425.
Clement M, Posada D, Crandall KA (2000). TCS: a computer program to estimate gene genealogies. Mol Ecol 9: 1657–1659.
Démolin G (1969). Bioecology of the pine processionary, Thaumetopoea pityocampa Schiff. Incidence of climatic factors. Boletín del Servicio de Plagas Forestales 23: 1–13.
Ewing B, Hillier L, Wendl MC, Green P (1998). Base-calling of automated sequencer traces using phred. I. Accuracy assessment. Genome Res 8: 175–185.
Frérot B, Demolin G (1993). Sex pheromone of the processionary moths and biosystematic considerations within the genus Thaumetopoea (Thaumetopoeidae, Thaumetopoeinae). Boll Zoll Agr Bachic II 25: 33–40.
Gemmell NJ, Akiyama S (1996). A simple and efficient method for the extraction of DNA. T Genetics 12: 338–339.
Hall TA (1999). BioEdit: a user-friendly biological sequence alignment editor and analysis program for Windows 95/98/ NT. Nucl Acids Symp Ser 41: 95–98.
Hansen MM, Ruzzante DE, Nielsen EE, Mensberg KL (2000). Microsatellite and mitochondrial DNA polymorphism reveals life-history dependent interbreeding between hatchery and wild brown trout (Salmo trutta L.). Mol Ecol 9: 583–594. Hewitt GM (1996). Some genetic consequences of ice ages, and their
role in divergence and speciation. Biol J Linn Soc Lond 58: 247–276.
Hewitt GM (2003). Ice ages, species distributions, and evolution. In: Rothschild LJ, Lister A, editors. Evolution on Planet Earth: The Impact of the Physical Environment. London, UK: Academic Press.
Howard DJ (1986). A zone of overlap and hybridization between two ground cricket species. Evol 40: 34–43.
Jukes TH, Cantor CR (1969). Evolution of protein molecules. In: Munro HN, editor. Mammalian Protein Metabolism. New York, NY, USA: Academic Press, pp. 21–132.
Kerdelhué C, Zane L, Simonato M, Salvato P, Rousselet J, Roques A, Battisti A (2009). Quaternary history and contemporary patterns in a currently expanding species. BMC Evol Biol 9: 220.
Knowles LL (2007). Delimiting species without monophyletic gene trees. Syst Biol 56: 887–895.
Lederer J (1885). Beitrag zur Schmetterlings-Fauna von Cypern, Beirut und einem Theile Klein-Asiens. Verhandl Zool Bot Verein Wien 5: 177–254.
Lefebvre T, Chaline N, Limousin D, Dupont S, Bagneres AG (2008). From speciation to introgressive hybridization: the phylogeographic structure of an island subspecies of termite, Reticulitermes lucifugus corsicus. BMC Evol Biol 8.
Masutti L, Battisti A (1990). Thaumetopoea pityocampa (Den. & Schiff.) in Italy. Bionomics and perspectives of integrated control. J App Entomol 110: 229–234.
Moore WS, Price JT (1993). Nature of selection in the northern flicker hybrid zone and its implications for speciation theory. In: Harrison RG, editor. Hybrid zones and the evolutionary process. New York, NY, USA: Oxford University Press, pp. 196–225.
Moritz C, Dowling TE, Brown WM (1987). Evolution of animal mitochondrial DNA: relevance for population biology and systematics. Ann Rev Ecol Syst 18: 269–292.
Nichols RA, Hewitt GM (1994). The genetic consequences of long distance dispersal during colonization. Heredity 72: 312–317. Pinho C, Harris DJ, Ferrand N (2007). Contrasting patterns of
population structure and historical demography in three western Mediterranean lizard species inferred from mtDNA variation. Mol Ecol 16: 1191–1205.
Rodríguez-Mahillo AI, González-Muñoz M, Vega JM, López JA, Yart A, Kerdelhué C, Camafeita E, García Ortiz JC, Vogel H, Tof-folo EP et al. (2012). Setae from the pine processionary moth (Thaumetopoea pityocampa) contain several relevant allergens. Cont Dermat 67: 367–374.
Salvato P, Battisti A, Concato S, Masutti L, Patarnello T, Zane L (2002). Genetic differentiation in the winter pine processionary moth (Thaumetopoea pityocampa – wilkinsoni complex), inferred by AFLP and mitochondrial DNA markers. Mol Ecol 11: 2435– 2444.
Sekendiz OA, Varlı SV (2002). Türkiye’de çam keseböceği mücadelesi üzerine deneyim ve düşünceler. In: Ülkemiz Ormanlarında Çam Keseböceği Sorunu ve Çözüm Önerileri Sempozyumu Bildiri Kitabı, s. 19–27 (in Turkish).
Simon C, Frati F, Beckenbach A, Crespi B, Liu H, Flook P (1994). Evolution, weighting, and phylogenetic utility of mitochondrial gene sequences and a compilation of conserved polymerase chain reaction primers. Ann Entomol Soc Am 87: 651–701.
Simonato M, Battisti A, Kerdelhué C, Burban C, Lopez-Vaamonde C, Pivotto I, Salvato P, Negrisolo E (2013). Host and phenology shifts in the evolution of the social genus Thaumetopoea. Plos One 8, e57192.
Simonato M, Mendel Z, Kerdelhué C, Rousselet J, Magnoux E, Salvato P, Roques A, Battisti A, Zane L (2007). Phylogeography of the pine processionary moth Thaumetopoea wilkinsoni in the Near East. Mol Ecol 16: 2273–2283.
Stöver BC, Müller KF (2010). TreeGraph 2: combining and visualizing evidence from different phylogenetic analyses. BMC Bioinfo, 11: 7.
Tamura K, Peterson D, Peterson N, Stecher G, Nei M, Kumar S (2011). MEGA5: molecular evolutionary genetics analysis using maximum likelihood, evolutionary distance, and maximum parsimony methods. Mol Biol Evol 28: 2731–2739. Thompson JD (2005). Plant Evolution in the Mediterranean. New
York, USA: Oxford University Press.
Thompson JD, Higgins DG, Gibson TJ (1994). CLUSTAL W: improving the sensitivity of progressive multiple sequence alignment through sequence weighting, position specific gap penalties and weight matrix choice. Nuc Acids Res 22: 4673– 4680.
Vega JM, Moneo I, Armentia A, López-Rico R, Curiel G, Bartolome B, Fernández A (1997). Anaphlaxis to a pine caterpillar. Allergy 52: 1244–1245.
Vogler AP, DeSalle R (1994). Evolution and phylogenetic information content of the ITS-1 region in the tiger beetle Cicindela dorsalis. Mol Biol Evol 11: 393–405.