HAL Id: hal-01439090
https://hal.archives-ouvertes.fr/hal-01439090
Submitted on 26 Sep 2017
HAL is a multi-disciplinary open access
archive for the deposit and dissemination of
sci-entific research documents, whether they are
pub-lished or not. The documents may come from
teaching and research institutions in France or
abroad, or from public or private research centers.
L’archive ouverte pluridisciplinaire HAL, est
destinée au dépôt et à la diffusion de documents
scientifiques de niveau recherche, publiés ou non,
émanant des établissements d’enseignement et de
recherche français ou étrangers, des laboratoires
publics ou privés.
of parasitism and virulence
Sebastian Akker, Dominik R. Laetsch, Peter Thorpe, Catherine J. Lilley,
Etienne G. J. Danchin, Martine da Rocha, Corinne Rancurel, Nancy E.
Holroyd, James A. Cotton, Amir Szitenberg, et al.
To cite this version:
Sebastian Akker, Dominik R. Laetsch, Peter Thorpe, Catherine J. Lilley, Etienne G. J. Danchin,
et al.. The genome of the yellow potato cyst nematode, Globodera rostochiensis, reveals insights
into the basis of parasitism and virulence. Genome Biology, BioMed Central, 2016, 17 (1), pp.1-23.
�10.1186/s13059-016-0985-1�. �hal-01439090�
R E S E A R C H
Open Access
The genome of the yellow potato cyst
nematode, Globodera rostochiensis, reveals
insights into the basis of parasitism and
virulence
Sebastian Eves-van den Akker
1*†, Dominik R. Laetsch
2†, Peter Thorpe
3†, Catherine J. Lilley
4†, Etienne G. J. Danchin
5,
Martine Da Rocha
5, Corinne Rancurel
5, Nancy E. Holroyd
6, James A. Cotton
6, Amir Szitenberg
7, Eric Grenier
8,
Josselin Montarry
8, Benjamin Mimee
9, Marc-Olivier Duceppe
9, Ian Boyes
10, Jessica M. C. Marvin
4, Laura M. Jones
4,
Hazijah B. Yusup
4, Joël Lafond-Lapalme
9, Magali Esquibet
8, Michael Sabeh
9, Michael Rott
10, Hein Overmars
11,
Anna Finkers-Tomczak
11, Geert Smant
11, Georgios Koutsovoulos
2, Vivian Blok
3, Sophie Mantelin
3, Peter J. A. Cock
12,
Wendy Phillips
13, Bernard Henrissat
14,15, Peter E. Urwin
4, Mark Blaxter
2and John T. Jones
3,16Abstract
Background: The yellow potato cyst nematode, Globodera rostochiensis, is a devastating plant pathogen of global economic importance. This biotrophic parasite secretes effectors from pharyngeal glands, some of which were acquired by horizontal gene transfer, to manipulate host processes and promote parasitism. G. rostochiensis is classified into pathotypes with different plant resistance-breaking phenotypes.
Results: We generate a high quality genome assembly for G. rostochiensis pathotype Ro1, identify putative effectors and horizontal gene transfer events, map gene expression through the life cycle focusing on key parasitic transitions and sequence the genomes of eight populations including four additional pathotypes to identify variation. Horizontal gene transfer contributes 3.5 % of the predicted genes, of which approximately 8.5 % are deployed as effectors. Over one-third of all effector genes are clustered in 21 putative‘effector islands’ in the genome. We identify a dorsal gland promoter element motif (termed DOG Box) present upstream in representatives from 26 out of 28 dorsal gland effector families, and predict a putative effector superset associated with this motif. We validate gland cell expression in two novel genes by in situ hybridisation and catalogue dorsal gland promoter element-containing effectors from available cyst nematode genomes. Comparison of effector diversity between pathotypes highlights correlation with plant resistance-breaking.
Conclusions: These G. rostochiensis genome resources will facilitate major advances in understanding nematode plant-parasitism. Dorsal gland promoter element-containing effectors are at the front line of the evolutionary arms race between plant and parasite and the ability to predict gland cell expression a priori promises rapid advances in understanding their roles and mechanisms of action.
Keywords: Plant-parasitic nematode, Genome sequence, Virulence, Effectors, Horizontal gene transfer
* Correspondence:s.evesvandenakker@dundee.ac.uk †Equal contributors
SEVDA and DRL contributed equally PT and CJL contributed equally
1Division of Plant Sciences, College of Life Sciences, University of Dundee,
Dundee DD1 5EH, UK
Full list of author information is available at the end of the article
© 2016 The Author(s). Open Access This article is distributed under the terms of the Creative Commons Attribution 4.0 International License (http://creativecommons.org/licenses/by/4.0/), which permits unrestricted use, distribution, and reproduction in any medium, provided you give appropriate credit to the original author(s) and the source, provide a link to the Creative Commons license, and indicate if changes were made. The Creative Commons Public Domain Dedication waiver (http://creativecommons.org/publicdomain/zero/1.0/) applies to the data made available in this article, unless otherwise stated.
Background
All major crops are thought to be infected by at least one species of plant-parasitic nematode, which causes damage valued at over $80 billion each year [1]. The majority of these economic losses are attributable to the sedentary endoparasitic nematodes of the genus
Meloidogyne (root-knot nematodes) and the genera
Heteroderaand Globodera (cyst nematodes). These
sed-entary endoparasites have complex biotrophic interac-tions with their hosts that include induction of specific feeding sites and long residence times within or on their host(s).
Potato cyst nematodes (PCN) are economically im-portant pathogens of potato, with two major species: the white PCN Globodera pallida and the yellow PCN G. rostochiensis. These nematodes originate in South America [2, 3] and have subsequently been introduced into all major potato-growing regions of the world. Europe has acted as a secondary distribution hub for PCN; worldwide populations outside South America re-flect subsequent introductions from Europe [4, 5]. Once established in a field, PCN are effectively impos-sible to eradicate in the short term and because they persist as long-lived cysts in soils, growing potatoes may not be economically viable for up to two decades. As a result, the US Department of Agriculture (USDA) has classified the yellow PCN as potentially more dan-gerous than any insect or disease affecting the potato industry (Aphis USDA 12/09/2015). Substantial effort is thus invested into keeping land free of PCN; both spe-cies are present on USDA and European Plant Protec-tion OrganisaProtec-tion quarantine organism lists.
PCN have been classified to pathotype based on their relative virulence on host plants harbouring different resistance loci. Most of the G. rostochiensis in UK potato-growing regions is of pathotype Ro1 and can be controlled by a single major resistance locus (H1). UK
G. rostochiensis populations have therefore been
sug-gested to originate from a genetically restricted intro-duction into Europe [6, 7]. Other pre-existing G.
rostochiensis pathotypes (Ro 2, 3 and 5, but not 4) are
able to overcome H1 resistance [8] and these patho-types may be selected in response to widespread deployment of H1 plants. The corresponding nematode avirulence gene(s) has not been identified. Understand-ing the bases of virulence and resistance is of critical importance for agriculture.
G. rostochiensishas a complex life cycle that includes
a highly resistant survival stage. Cysts, formed from the body wall of the adult female, encase hundreds of eggs that can lie dormant in the soil for over 20 years. Second stage juveniles (J2) within the eggs hatch in response to root diffusates from suitable host plants growing nearby. The J2 nematodes locate the root and
migrate destructively through root tissues until they reach the inner cortex layers. Here the nematodes probe the cells, until a cell that does not respond adversely is detected [9]. This initial syncytial cell is transformed into a large, multinucleate syncytium in re-sponse to proteins, peptides and hormones secreted by the nematode. Cell wall openings are formed between the initial syncytial cell and its neighbours, followed by fusion of the protoplasts. Syncytial cells become highly metabolically active and have enriched cytoplasm, en-larged nuclei and a greatly reduced central vacuole. Additional layers of cells are subsequently incorporated into the syncytium, which may eventually be composed of up to 300 cells [9]. A prolonged biotrophic inter-action is then maintained for a period of several weeks, while the nematode intermittently withdraws host cyto-plasm to derive all food required for development to the adult stage. Each nematode can only induce a single feeding site that must therefore be maintained and pro-tected from host defences.
The complex interactions of PCN with their hosts, like those of other plant parasites and pathogens, are mediated by effectors: secreted proteins that manipu-late the host to the benefit of the pathogen. Most PCN effectors are produced in two sets of gland cells, dorsal and subventral [10], although some apoplastic effectors can be produced in the gland cells surrounding the main anterior sensory organs, the amphids [11]. Effectors play important roles in all aspects of the parasite-host interaction: invasion and migration [12], suppression of host defences [13] and induction of the feeding site [14, 15]. The effector repertoire of plant-parasitic nematodes, including PCN, has been augmented by multiple Hori-zontal Gene Transfer (HGT) events, primarily of bac-terial origin [16]. HGT events are suspected to have played an important role in the emergence of plant parasitism in nematodes, enabling degradation of the plant cell wall, nutrient processing and manipulation of plant defences [17]. Due to their importance in the life cycle of plant-parasitic nematodes, a great deal of effort has been put into various approaches for effector identification, including genomic and transcriptomic analyses [10], transcriptomic analyses of purified gland cells [18] and proteomic analyses [19]. For some effec-tors, the likely biological functions, including host proteins targeted, have been identified [14, 20, 21].
Here, we report a high quality draft genome of a Ro1 isolate of G. rostochiensis, in combination with repli-cated transcriptome data from four key life stages, and genome sequence from eight populations across four pathotypes. We conducted whole genome comparisons
between G. rostochiensis and related species [22–25] to
explore the genomic and transcriptomic bases of patho-genicity. We discovered an unusually high frequency of
well-supported non-canonical splice sites in G. rosto-chiensis, and found that this phenomenon was also present in related parasitic nematode species. Using an HGT analysis pipeline, we identified hundreds of genes in the G. rostochiensis genome that may have been ac-quired by gene transfers from non-metazoan origin, some of which likely play important roles in plant para-sitism. We identified effectors in G. rostochiensis and
found that they frequently grouped together into‘effector
islands’. To explore the genetic bases of virulence, we compared genetic variation in effectors and other genes between pathotypes and found that effectors, in general, contained more non-synonymous mutations. Using the identified G. rostochiensis effectors as a training set, we
identified a putative ‘DOrsal Gland promoter element’,
or DOG box, which was also associated with effectors in related species. We were able to use the DOG box to predict novel effectors, confirmed by in situ hybridisa-tion, in G. rostochiensis, and to identify all putative DOG effectors from available cyst nematode genomes. Results and discussion
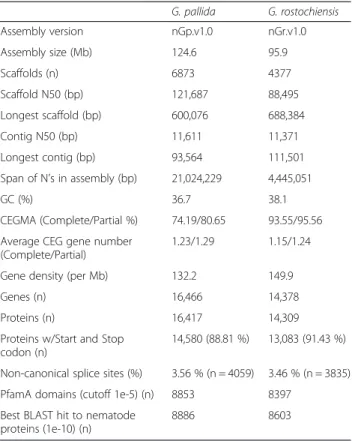
The genome sequence of Globodera rostochiensis Ro1 The genome of the potato cyst nematode, G. rosto-chiensis, pathotype Ro1 from the James Hutton Insti-tute collection, was sequenced to 435.6-fold coverage and assembled into a high quality draft assembly (nGr.v1.0) of 95.9 Mb (Table 1), consistent with experi-mental estimates of Globodera genome size [26]. The assembly shows a smaller size and total gene number, yet higher completeness than the G. pallida genome [22] (Table 1). Further, the low level of duplication of core, conserved genes (Table 1), and indeed of all genes (Additional file 1: Figure S1), suggest that the G.
rosto-chiensisgenome assembly is a more accurate
represen-tation of a Globodera genome, probably reflective of the low genetic variation present in the UK G.
rosto-chiensisused for sequencing [11].
Collaborative manual gene refinement reveals a uniquely high frequency of non-canonical splice sites in Globodera To produce a high quality set of gene predictions, an initial phase of automated annotation was followed by manual refinement of approximately one-eighth of all gene models in the collaborative genome annotation editor WebApollo (Additional file 2: Supplementary in-formation file 1). During the manual annotation phase, we noted that correction of many exon-intron boundar-ies to be consistent with mapped RNA-sequencing (RNA-seq) data (Fig. 1a) was only possible using non-canonical 5′ donor splice sites (GC rather than GT). The frequency of GC-bearing introns in the manual annotation set was two orders of magnitude higher
than in the initial automated predictions. However, genome-wide re-prediction, using manually curated genes as a training set and allowing for the prediction of non-canonical GC/AG introns, increased the fre-quency of GC/AG introns to that of the manually annotated set (Additional file 3: Table S1) and markedly improved upon automated predictions (see Additional file 2: Supplementary information file 1).
The frequency of GC/AG introns in G. rostochiensis was 3.46 %, the highest reported for any nematode. In addition to the GT or GC dinucleotide, 5′ donor sites are characterised by a nine-base consensus sequence, CAGG[T|C]AAGT (where the initial CAG is in the preceding exon [27]). Although variations in the 5′ donor site sequence were found, G. rostochiensis GC/ AG introns conformed equally well, if not better, to this consensus as did GT/AG introns (Fig. 1a and b). We derived a revised 5′ donor consensus for the predicted introns for both GC and GT 5′ sites and found both in-tron classes to use AAGG[T|C]AAGT (where the first AAG is in the preceding exon). We identified a similarly high frequency of GC/AG introns in G. pallida (3.53 %), and Rotylenchulus reniformis (2.36 %) (PRJNA214681, Showmaker et al., unpublished), a sedentary endoparasite of multiple crop plants that is in a sister group to
Globodera in the Tylenchoidea (Additional file 4:
Figure S2). While GC/AG introns were apparently Table 1 Genome statistics
G. pallida G. rostochiensis Assembly version nGp.v1.0 nGr.v1.0 Assembly size (Mb) 124.6 95.9 Scaffolds (n) 6873 4377 Scaffold N50 (bp) 121,687 88,495 Longest scaffold (bp) 600,076 688,384 Contig N50 (bp) 11,611 11,371 Longest contig (bp) 93,564 111,501 Span of N’s in assembly (bp) 21,024,229 4,445,051 GC (%) 36.7 38.1 CEGMA (Complete/Partial %) 74.19/80.65 93.55/95.56 Average CEG gene number
(Complete/Partial)
1.23/1.29 1.15/1.24
Gene density (per Mb) 132.2 149.9
Genes (n) 16,466 14,378
Proteins (n) 16,417 14,309
Proteins w/Start and Stop codon (n)
14,580 (88.81 %) 13,083 (91.43 %) Non-canonical splice sites (%) 3.56 % (n = 4059) 3.46 % (n = 3835) PfamA domains (cutoff 1e-5) (n) 8853 8397
Best BLAST hit to nematode proteins (1e-10) (n)
absent from the Meloidogyne species gene predictions, we suspect this may be due to restrictive settings during their annotation, as they are present in most species (Additional file 4: Figure S2). The elevated proportion of non-canonical GC/AG introns appear to be restricted to the Heteroderidae.
In species pairs with a low GC/AG intron frequency, such as Caenorhabditis elegans and the closely related C. briggsae, there is no obvious conservation of non-canonical splice site usage in their orthologous genes [28]. However, for genes in G. rostochiensis with at least one GC/AG intron, ~72 % of the corresponding one-to-one orthologues in G. pallida also contained at least one-to-one GC/AG intron (n = 2148), compared to an average of 10.8 % for identically sized subsets of non-GC/AG in-tron containing G. rostochiensis genes (1000 iterations, stdev = 0.8 %). Within those genes, orthologous introns also tended to have conserved non-canonical splice sites. For 30 % of the G. rostochiensis GC/AG introns in one-to-one orthologues, the corresponding G. pallida intron also used GC/AG. GC/AG introns had a biased distribu-tion within genes in both species, tending to be less common in introns in the 5′ portion of genes compared to introns in the 3′ portion (Fig. 1c).
Life stage specific transcriptome
From the G. pallida genome project [22], it was clear that the key parasitic transitions to be captured in terms of all cyst nematode gene expression, and in particular
for effectors, is from outside the plant (J2) compared to inside the plant (sedentary females). We used nematodes at 14 days post infection (dpi) as this provides an ideal intermediate for the sedentary stages: variation in gene expression at 14 dpi accounts for most of the variation in gene expression at 7 dpi (84 %), and at 21 dpi (60 %, Additional file 5: Figure S3). G. rostochiensis pathotype Ro1 gene expression was therefore analysed at four key stages across the life cycle: dormant cysts; hydrated eggs; hatched infective J2; and feeding parasitic females. Using a false discovery rate (FDR) of <0.001 and a minimum fold-change of 4, 6720 genes (47 %) were found to be differentially expressed. Differentially expressed genes were grouped into expression clusters; those that uniquely describe each life stage, two life stages or three life stages were identified (Fig. 2; expanded in Additional file 6: Figure S4; Additional file 7: File S1 contains the data matrix of normalised expression values). Some ex-pression clusters showed a stepwise increase or decrease in expression corresponding to transitions through the life cycle. As much as 94 % of all differentially expressed genes, and thus ~44 % of all genes, are manually grouped into 25 biologically relevant expression super-clusters (Additional file 6: Figure S4).
G. rostochiensispredicted proteins were clustered with
those from the cyst nematode G. pallida [20], the root-knot nematodes M. hapla [24] and M. incognita [23], the pine wilt nematode Bursaphelenchus xylophilus [29] and C. elegans (Fig. 3a; for relationships between these Fig. 1 Non-canonical splicing in Globodera. a Correction of many exon-intron boundaries to be consistent with RNA-seq mapping required
the use of a non-canonical 5′ donor site. Comparison of the consensus sequence for both canonical (GT/AG) and non-canonical (GC/AG) splice
sites reveals similar local base composition, with the exception of the GT or GC itself. b The 5′ donor sites of both GC/AG and GT/AG introns
conform to the consensus CAGG[T|C]AAGT. c GC/AG introns are less common at the beginning of gene models in both G. rostochiensis (black) and G. pallida (grey)
species see Additional file 4: Figure S2). Among the 16,821 OrthoMCL clusters, 2821 contained representa-tives from all nematodes tested, 220 clusters contained only proteins from plant parasites, 372 clusters con-tained only proteins of Globodera spp. and Meloidogyne spp. and 1986 clusters were composed solely of proteins from the cyst nematodes G. rostochiensis and G. pallida.
Focusing on these four categories of orthologous clus-ters (all nematodes, all plant parasites, Meloidogyne plus
Globodera and Globodera) we correlated the orthologue
definition and transcriptional clustering data to explore possible functional roles of genes unique to subsets of the taxa analysed. Only 34 % of genes in clusters with members from all five nematodes, or clusters lacking only C. elegans, were differentially expressed, compared to 47 % differentially expressed overall (Fig. 3b), congru-ent with the assumption that these families are likely to include loci with roles in core physiology. Interestingly however, genes specifically upregulated in eggs contain a higher relative abundance of genes in orthologous clusters common to all plant parasites yet absent in C. elegans, compared to other orthologous gene categories (Fig. 3c).
Only 43 % of genes in orthologous clusters private to
Meloidogyne and Globodera were differentially expressed.
In contrast, of the genes in orthologous clusters only
present in the two Globodera species, 60 % were differen-tially regulated, suggesting that these genes play a dynamic role in parasite development. Furthermore, over two-fifths of genes (42 %) that are differentially regulated in the in-fective juvenile stage of G. rostochiensis are those that are unique to the Globodera. Expression super-clusters 13 and 24, which describe those genes specifically upregu-lated or downreguupregu-lated in the infective juvenile stage, re-spectively, contain a higher relative abundance of genes in orthologous clusters unique to Globodera species com-pared to other orthologous gene categories (Fig. 3c).
G. rostochiensis proteins in clusters private to
Meloi-dogyne and Globodera were enriched for GO terms
associated with gene silencing by miRNA (p <0.001, FDR 0.05), including nine proteins with highest similar-ity to worm-specific argonautes (WAGOs) in C. ele-gans. WAGOs are central to the RNAi pathway, being responsible for binding of small RNAs and mediation interactions with other proteins, and show an excep-tional diversity within the phylum Nematoda. It has been suggested that the expansion of WAGOs within Nematoda is associated with extreme functional plasti-city [30]. Enrichment of WAGOs in the Meloidogyne and Globodera lineage, in combination with phylogen-etically distinct clades of WAGOs in the Heteroderidae (Additional file 8: Figure S5), may indicate functional Fig. 2 Example of differential gene expression clusters in the context of nematode biology. The transcriptome of G. rostochiensis was sequenced in duplicate for four key stages across the life cycle: dormant cysts; hydrated eggs; hatched infective juveniles (J2); and feeding 14 days post infection (dpi) females. A subset of the 6720 genes differentially expressed (FDR <0.001, min fold 4) are grouped into expression clusters which describe the genes specifically upregulated at various life stages. Clusters which uniquely describe each life stage (1st order), describe two life stages (2nd order) or describe three of the four life stages (3rd order) are identified. Further, some expression clusters show a stepwise increase (or decrease) in expression as the nematode transitions through its life cycle (trans). For all expression clusters, mean centred log fold-change of expression is plotted for each of two biological replicates for each life stage in the following order: Cyst, egg, J2, 14 dpi female. All genes in each cluster are drawn with grey bars, the average of which is shown in blue
diversification following expansion. With the exception of GROS_g08854, all G. rostochiensis WAGOs that are
differentially regulated are present in differential
expression super-clusters 19, 20 and 21. All but one of these differentially expressed WAGOs are in Clades 1/ 2/4/5 and 10/11. Expression super-clusters 19, 20 and 21 are characterised by significant upregulation at 14 dpi, suggesting a dynamic role for WAGO clade 1/2/4/ 5 and 10/11 as G. rostochiensis transitions through parasitism.
Genes acquired by horizontal transfer have substantially contributed to the genome of G. rostochiensis
Horizontal gene transfer (HGT) events have played an important role in the emergence of plant-parasitism in nematodes [17]. Numerous plant cell wall degrading enzymes, originally acquired from bacteria, are present in a wide range of tylenchomorph plant-parasitic nema-tode species, while diplogasterid nemanema-todes have ac-quired functionally analogous genes from fungi [17]. Using a systematic genome-wide approach, putative HGT events were identified based on the ratio of their sequence similarity to metazoan and non-metazoan
sequences (Alien Index (AI), (Alienness [31–33])). Proteins with an AI >0 and more than 70 % identity to a non-metazoan sequence were considered putative con-taminants (n = 18) and not included in these analyses.
We identified 519 G. rostochiensis proteins that may have originated through HGT events (AI >0), including all previously published cases of HGT into cyst nema-todes present in the predicted proteins (Table 2). Of the 519 genes putatively acquired by HGT, 87 % have some evidence of transcription at the four life stages sampled (cumulative FPKM > 1, c.f. 95 % of all proteins), 91 % have at least one intron (c.f. 95 % of all proteins) and 92 % are on scaffolds containing other genes not pre-dicted to be acquired by HGT (c.f. 95 % of random set (n = 519), 1000 iterations). We found strong support (AI >30) for 91 proteins (Additional file 9: Table S2). In 77 % of these cases (70/91), the most similar sequences identified were of bacterial origin, while in ~11 % (10/ 91), the most similar sequences were of fungal origin, consistent with previous reports of HGT in plant-parasitic nematodes. The remaining proteins with an AI >30 had closest similarity to proteins from protists (n = 7), plant (n = 3) and a virus (n = 1). No phylogenetically
2821 220 372 762 1524 1986 219 433 317 919 719 2176
Number of protein clusters shared
3000
2000
1000
0
All nematodes tested All plant parasites tested Single origin of parasitism Single origin of biotrophy
70 50 30 10 % of genes in expression super clusters 0 0.6 1.2 0 0.8 1.6 0 3 6
Cyst_1 Cyst_2 Egg_1 Egg_2 Juveniles_1 Juveniles_2 14dpi_1 14dpi_2 G. ros G. pal M. hap M. inc B. xyl C. ele Transcriptome differential expression super cluster
Orthologous gene category
Centred log fold change
6 4 2 0 -2 -4 4 2 0 -2 -4 -6 4 2 0 -2 -4 super cluster 13 super cluster 24
super cluster 12 relative abundance
G. ros G. pal M. hap M. inc B. xyl C. ele
A
B
C
G. ros G. pal M. hap M. inc B. xyl C. ele frequency of genome (47%)Fig. 3 Putative orthologous gene clusters in related nematode species and transcriptomic analysis. a The predicted protein sets of five plant parasites, from two independent origins of parasitism, were compared to that of the free living nematode C. elegans. The analysis includes two cyst nematodes, G. rostochiensis and G. pallida, two root knot nematodes, M. hapla and M. incognita, the pine wilt nematode B. xylophilus and the free living nematode C. elegans. The histogram shows the number of clusters shared uniquely between the species highlighted below. A total of 1986 clusters of genes are present in both cyst nematode species and absent from all other nematodes tested (orange). b Focusing on four orthologous gene cluster categories (all nematodes, all plant parasites, a single origin of plant parasitism and a single origin of sedentary biotrophy), the percentage of genes present in differential super-clusters suggest that those genes unique to the Globodera are preferentially dif-ferentially regulated throughout the adapted life cycle. c Analysing the relative abundance of genes from each orthologous gene cluster category in each of the differential expression super-clusters suggests that those genes specifically differentially regulated during the infective juvenile stage are those unique to the Globodera
Table 2 Genes acquired via HGT in other cyst and root-knot nematodes also found in the genome of G. rostochiensis
Process Gene family Function Pfam domains Highest
AI Reference G. rostochiensis genes Cell wall degradation
GH5_2 Cellulases Cellulose degradation PF00150 Cellulase
(glycosyl hydrolase family 5)
198.94 [12] GROS_g01454 GROS_g04677 GROS_g05961 GROS_g05962 GROS_g07338 GROS_g07446 GROS_g07949 GROS_g10505 GROS_g11008 GROS_g11200 GROS_g11949 Expansin-like proteins Softening of non-covalent
bonds
PF03330
Rare lipoprotein A (RlpA)-like double-psi beta-barrel 29.93 [90] GROS_g03476 GROS_g09961 GROS_g10585 GROS_g11726 GROS_g11727 GROS_g12817 GROS_g12966 GH53 candidate Arabinogalactan endo-1,4-beta-galactosidase Pectinose/arabinogalactan degradation PF07745
Glycosyl hydrolase family 53
349.30 [91] GROS_g08150 PL3 Pecate lyase Pectin degradation PF03211
Pectate lyase 137.06 [92,93] GROS_g04366 GROS_g05398 GROS_g07968 Plant defense manipulation
GH18 chitinase Chitin degradation PF00704
Glycosyl hydrolase family 18
2.30 [94] GROS_g11136 Chorismate mutase Conversion of Chorismate
into SA
PF01817
Chorismate mutase type II
42.36 [95] GROS_g02441 GROS_g08190 Candidate Isochorismatase Conversion of Chorismate
into SA
PF00857
Isochorismatase family
66.08 [96] GROS_g01640
Detoxification Candidate Cyanate lyase PF02560
Cyanate lyase C-terminal domain
11.51 [17,24] GROS_g09531
Nutrient processing
GH32 invertase Degradation of sucrose in glucose and fructose
PF00251
Glycosyl hydrolases family 32 N-terminal domain 241.26 [22,23] GROS_g05724 GROS_g06434 GROS_g08674 GROS_g09735 GROS_g09969 GROS_g10583 GROS_g11374 GROS_g11397 GROS_g11793 GROS_g13274 GROS_g14232
confirmed HGT of protist, plant or virus origin has been identified to date in plant-parasitic nematodes. Given that some of these candidates are among genes with evidence of expression, they deserve further investigation.
Protein domains were identified in 65 % of the pu-tative HGT proteins with an AI >0 and 88 % of those with an AI >30 (Additional file 10: Table S3). The HGT candidates included a set, with AI >29, with predicted functions in plant cell wall modification and degradation, including GH5 cellulases, expansin-like proteins, GH53 candidate arabinogalactan endo-1,4-beta-galactosidase and PL3 pectate lyases. Other cases of HGT may be involved in nutrient processing. A GH32 protein from G. pallida has been shown to be a functional invertase expressed in the digestive sys-tem [34]. This enzyme may convert sucrose, the main circulating form of sugar in plants, into glucose and
fructose which are readily usable by nematodes. We identified 11 GH32-bearing proteins in G. rostochien-sis, suggesting that this function may be especially important. The phylogenetically dynamic pattern of HGT into tylenchomorph genomes is illustrated by the absence of GH30_8 xylanases, GH28 polygalactur-onase as well as GH43 candidate arabinanase in G.
rostochiensis and G. pallida, despite their presence in
root-knot nematodes [16]. Furthermore, of the 91 genes with AI >30, six are present in orthologous pro-tein clusters unique to the Globodera and Meloidogyne, yet many classes are functionally represented in both genera, consistent with multiple acquisitions. The distribu-tion of putative HGT cases across orthologous gene categor-ies is broadly consistent between AI >0 and AI >30. Both suggest a substantial proportion of genes putatively acquired by HGT (36–45 %) are unique to the Globodera and may
Table 2 Genes acquired via HGT in other cyst and root-knot nematodes also found in the genome of G. rostochiensis (Continued)
VB1 thiD Vitamin B1 biosynthesis PF08543
Phosphomethylpyrimidine kinase
154.50 [97] GROS_g07352
VB1 thiE Vitamin B1 biosynthesis PF02581
Thiamine monophosphate synthase/TENI
163.99 [97] GROS_g07353
VB1 thi4 Vitamin B1 biosynthesis PF01946
Thi4 family
108.07 [97] GROS_g10855
VB1 thiM Vitamin B1 salvage PF02110 46.05 [97] GROS_g07354
Hydroxyethylthiazole kinase family
VB1 tenA Vitamin B1 salvage PF03070 108.33 [97] GROS_g05327
TENA/THI-4/PQQC family GROS_g07355
VB5 panC Vitamin B5 biosynthesis PF02569 183.11 [97] GROS_g05752
Pantoate-beta-alanine ligase
VB6 aSNO Vitamin B6 biosynthesis PF01680 12.72 [98] GROS_g08956
SOR/SNZ family Candidate PolS Polyglutamate
synthase
Not known PF09587 102.00 [99] GROS_g07961
Bacterial capsule synthesis protein PGA_cap
Candidate GSI Glutamine synthase Nitrogen assimilation PF00120 29.24 [100,101] GROS_g02362 Glutamine synthetase,
catalytic domain Feeding site
induction
NodL - like Candidate
acetyltransferase PF12464 Maltose acetyltransferase 13.12 [100,102] GROS_g11033 PF00132 Bacterial transferase hexapeptide (six repeats) Not known Candidate L-threonine aldolase ?? PF01212
Beta-eliminating lyase 164.69 [100] GROS_g10421 GROS_g10422 GROS_g10423 Candidate Phosphorybosyl transferase ?? PF00156 Phosphoribosyl transferase domain 198.13 [100,101] GROS_g04632 GROS_g06735
give an insight into the relatively recent HGT history since the Globodera–Meloidogyne divergence (Fig. 4a). Three-quarters of genes with AI >30 and unique to Globodera are present in differential expression super-clusters, the most common of which are super-clusters 13 and 20 which, re-spectively, describe genes specifically upregulated during in-fective J2 and parasitic females. This may indicate that these genes (several candidate invertases, candidate L-threonine aldolase and VB1 tenA (Additional file 10: Table S3)) are functionally deployed during parasitism following horizontal transfer. Although transposable elements (TEs) are closely associated with putative HGT events (p <0.001, Mann– Whitney U test, Fig. 4b), the divergent transposable elem-ent assemblage in Globodera species compared to other tylenchomorphs (LINE/Jockey and SINE/Alu, Additional file 11: Figure S6) is not preferentially associated with pu-tative HGT cases also specific to the Globodera (Fig. 4c). Effectors in G. rostochiensis are sequence diverse between pathotypes
Effectors play central roles in both pathogenicity and virulence. The evolution of virulence on a particular host or variety can involve both gain and loss of effector function. Effectors may become specialised to function in a new host [35], while effector gene loss (or loss of ex-pression) may allow a pathogen to evade recognition [36]. We identified G. rostochiensis effectors by sequence
similarity to effectors with experimentally verified gland cell expression in related taxa (Heterodera, Globodera). Many effectors in plant-parasitic nematodes are mem-bers of large multi-gene families, only a subset of which are effectors [10, 13, 37]. For example, in G. pallida there are ~300 SPRY (PF00622) domain containing pro-teins, fewer than 10 % of which are deployed as effectors [13]. We therefore further filtered the potential effector set for the presence of a signal peptide for secretion and absence of a transmembrane domain to retain a high confidence list of 138 loci (Additional file 12: Table S4), including 101 genes similar to sequences expressed in the dorsal gland cell, 35 genes similar to those expressed in subventral gland cells and two genes similar to those expressed in the amphid sheath cells. The set included representatives of 37 different effector gene families (Additional file 12: Table S4). The vast majority of these effectors (116/138) exhibited expression profiles con-sistent with a role in parasitism (Additional file 12: Table S4), as would be expected for effectors. The tem-poral expression profiles of dorsal and subventral effec-tors were also consistent with the observed changes in activity of these glands throughout nematode develop-ment [38–41]. Most subventral gland effectors were primarily expressed at J2, while dorsal gland effectors were expressed at J2 and/or 14 dpi. Approximately 8.5 % of genes putatively acquired via HGT (8.47 % of
2 65 28 4 20 38 274 41 192 0 10 20 30 40 50 60 70 80 90 100 AI > 30 AI > 0
All plant parasitic nematodes Meloidogyne + Globodera All nematodes Other/none Globodera Putative cases of HGT in orthologous
gene cluster categories (%)
HGT Non-HGT
10
Distance to adjacent transposon (log
nucleotide)
A
B
C
0 10 20
Non-HGT HGT unique to Globodera HGT
Adjacent transposable element type (% of total)
DNA/hA T -Ac DNA/T cMar-T c1 L TR/Gypsy DNA/EnSpm DNA/Ginger L TR/Copia SINE? DNA/T ransib DNA/Unclassified DNA/hA T L TR/Unclassified DNA/T cMar-Pogo
DNA/MuLE-MuDR LINE/Unclassified DNA/hA
T -Charlie LINE/L1 DNA/T cMar-T c4 DNA/T cMar-T c2 DNA/Helitron DNA/T cMar-Mariner DNA/Maverick L TR/Pao DNA/hA T -hA Tx DNA/Merlin DNA/hA T -T ag1 DNA/Chapaev DNA/T cMar-T igger DNA/hA T -Blackjack SINE/Alu LINE/Jockey LINE/L2 SINE/5S LINE/CR1 LINE/R TE-R TE LINE/R1 DNA/ISC1316 DNA/Sola LINE/R2-NeSL 5 4 3 2 1 0 b a
Fig. 4 Analysis of genes putatively acquired by HGT. a Using an AI >30 or >0, between 45 % and 36 % of putative HGT genes are present in orthologous gene cluster categories unique to the Globodera and may give an insight into the relatively recent HGT history since the
Globodera–Meloidogyne divergence. b Genes putatively acquired by HGT (AI >0) are significantly closer to transposable elements when
compared to all other genes not predicted to be acquired by HGT (p <0.000, Mann–Whitney U test). c There was no significant association
of any independent class of transposable element with genes putatively acquired by HGT. Despite the divergent transposable element composition of Globodera (Additional file 11: Figure S6), these were not associated with putative HGT events specific to Globodera
those with AI >0 and 8.79 % of those with >30) are present on the stringent effector list; examples of which include putative pectate lyase, beta - 1,4 - endogluca-nase and expansins.
Intra-species variation within the G. rostochiensis effectorome was examined by mapping whole genome resequencing data from nine populations across five pathotypes (Ro1, Ro2, Ro3, Ro4 and Ro5) to the refer-ence assembly (pathotype Ro1). A total of 1,081,802 variants were detected, of which 794,505 were single nucleotide polymorphisms (SNPs) and 283,434 were in-sertions/deletions (indels) (Additional file 13: Table S5). Homozygous molecular markers descriptive of patho-types 4 and 5 were identified (Additional file 14: Table S6). Interestingly, no variants were descriptive of all Ro1, Ro2 or Ro3 populations. Consistent with this, a maximum likelihood phylogeny constructed from 730,705 genome wide SNPs identifies two distinct groups of Ro1, together separate from Ro2, Ro3, Ro4 and Ro5 (Additional file 15: Figure S7A). The variation within pathotype Ro1 is as great as, if not greater than, the variation between Ro1 and the other pathotypes (Additional file 15: Figure S7B).
A total of 108 G. rostochiensis effectors (78 %) con-tained predicted modification of function (non-syn-onymous mutation) and/or predicted loss of function (frame shift indel or premature stop codon) in at least one pathotype. When accounting for gene length, G.
rostochiensiseffectors did not show significantly
differ-ent numbers of predicted loss of function variants, but did contain significantly more total variants and more predicted modification of function variants per gene (n = 131, Mann–Whitney U test, p <0.028 and p = 0.003, respectively), compared to randomly selected non-effector genes. No individual variant was homozy-gous for the reference allele in all populations avirulent on H1 (Ro1 and Ro4) and homozygous for the variant allele in all populations virulent on H1 (Ro2, Ro3 and Ro5). This observation is consistent with the suggestion that distinct populations of Ro1 (Additional file 15: Figure S7 and [42]), in addition to Ro4, have evolved the same phenotype on H1 independently [8]. Convergent evolution of the same phenotype by independent mutations may be explained by identifying genes which are always homozy-gous present for at least one predicted loss or change of function variant in populations virulent on H1 and always homozygous absent for any predicted loss or change of function variants in populations avirulent on H1. No such cases were identified from these population sequencing data. However, 190 genes were identified with at least one predicted modification or loss of function variant homozy-gous absent in all avirulent populations and homozyhomozy-gous or heterozygous present in virulent populations. When cross-referenced with the high-confidence effector list, this was reduced to two genes. Gene g13394 is similar to
GLAND10 [43], which encodes a putative cellulose bind-ing protein and originates from the subventral gland cell. Gene g12477 is similar to the 3H07_Ubiquitin_extension effectors that are expressed in the dorsal gland cell [44, 45], and are involved in host immune suppression [46]. Forty-eight SNPs were identified in 19 non-effector genes with a difference in average allele frequencies of 70 % or higher between virulent and avirulent populations and a minimal difference in allele frequencies of 25 % between individual virulent and avirulent populations (Additional file 16: Table S7), of which four SNPs were located in g03129, a Ryanodine receptor-like containing three SPRY domains, and seven in g09064, a molecular chaperone from the Hsp90 family.
Effectors in the G. rostochiensis genome are compartmentalised into islands
In several unrelated eukaryotic plant pathogens, effec-tors are not randomly distributed in the genome, but are rather located in specialised regions. For example, in Phytophthora infestans most effectors are located in gene-sparse regions of the genome and it is proposed that this facilitates rapid evolution and adaptation [47]. Comparatively, G. rostochiensis effectors were located in gene-dense regions of the genome (Fig. 5a), albeit with a skewed distribution of gene density compared to an identically sized subset of non-effectors (Student’s t-test, n = 138, p <0.001, Additional file 17: Figure S8). Compared to an expectation of 2 % for a random set of 138 genes, the 138 high-confidence effectors had another high-confidence effector as an immediate chromosome
neighbour in 22 % of cases (χ2
, p <0.0005). This excess was due to local tandem duplication, as effectors that were directly adjacent to one another in the genome were often from the same effector family, and were frequently more similar to the adjacent gene than to other members of the same gene family located elsewhere in the genome. Such local tandem duplication is a common feature of gene families in G. rostochiensis (Fig. 5), however, groups of functionally related gene families (i.e. effectors) tend to be in clustered in genomic islands. For a random subset of 37 non-effector containing gene families, increasing distance from each gene reduces the likelihood of identifying an-other member in any of the same 37 families. However, the clustering of effector loci extends beyond immediate neighbours, with an excess of effector loci as
next-but-two neighbours (n ± 3) and also at n ± 6 (χ2
, p <0.01 and 0.001, respectively, Fig. 5b). Over one-third of all effectors were described by 21 effector islands of 2–4 effector loci (Additional file 18: Table S8) with an aver-age length of ~20 kb. Over half of the islands included effectors from more than one effector gene family, yet 80 % comprised genes expressed in only one cell type (dorsal gland cell, subventral gland cell). Several islands
AT % 100 0 Effectors Island 7 25kb 50kb 75kb 100kb 125kb Scaffold 00141 9 12 6 3 3 6 9 12
log(nucleotide distance to next 3' gene)
log(nucleotide distance to next 5' gene)
A
Dorsal effectors Subventral effectorsB
20 40 60 Gene density
C
Genes µSats TEs Variants n±1 n±2 n±3 n±4 n±5 n±6 n±7 n±8 n±9 “Effector island” Effectors Non-effectors ** Gene distance * p<0.01 ** p<0.001 Occurrence (%) 0 10 20 30 * NsD
from island boarder facing “in” from island boarder facing “out”
control
5.00 4.00
3.00 2.00
Distance to nearest transposable element (Log base 10 nucleotide)
p = 0.028 p = 0.1 16 a b ab
inside islands outside 5' outside 3' outside 5' + 3' whole scaf
fold adjacent scaf fold 2 0 4 ns T ransposon/10kb
included loci similar to other effectors not included in the high-confidence list.
G. rostochiensis effector islands were also identified in
G. pallida. Effector islands containing more than one one-to-one orthologue were similarly arranged in close proximity in G. rostochiensis and G. pallida, with just three exceptions. One island in G. rostochiensis was split across the ends of two scaffolds in G. pallida, suggesting the split in G. pallida may be an artefact of gapped assembly. Two other G. rostochiensis islands were dis-persed in G. pallida, across different large scaffolds. Synteny between the genome assemblies of G.
rosto-chiensisand G. pallida extends beyond effector islands,
despite the fragmented nature of both assemblies. Based on OrthoMCL protein cluster-membership, 109 distinct syntenic clusters of scaffolds which contained runs of at least five syntenic proteins each were identi-fied, involving 249 G. pallida and 202 G. rostochiensis scaffolds (Additional file 19: Figure S9). In total, 38.2 Mb of G. pallida (36.9 % of the genome) scaffolds are partially syntenic to 31.1 Mb (34.0 % of the gen-ome) of G. rostochiensis scaffolds (ignoring N’s). Break-age of synteny between two scaffolds was observed in 20 pairs, seven of which involved inversions. The low proportion of syntenic regions most likely reflects the draft nature of both assemblies (G. pallida scaffolds in clusters: 12 % N’s; G. rostochiensis scaffolds in clusters:
4.9 % N’s). A subset of the largest syntenic cluster is
shown in Fig. 6. Synteny breakpoints which primarily co-occur with large insertions in the G. pallida assem-bly may suggest that large-scale rearrangements have taken place during their divergence and yet effector islands remain predominantly intact. Long-range DNA-sequencing data will prove crucial for assessing the true proportion of syntenic scaffolds and estimating the amount of synteny breakage.
Identifying features enriched within effector islands in G. rostochiensis remains challenging; there is no evi-dence for more AT-rich sequences, contig break points, polymorphisms or microsatellite repeats within islands, flanking islands or scaffolds containing islands (Fig. 5c). However, despite no difference in transposon density within islands (2.7/10 kb ±2.4), in the remainder of scaffolds containing islands (2.4/10 kb ±1.7), in entire scaffolds containing islands (2.8/10 kb ±0.9) or in scaf-folds numerically adjacent to those containing islands (See figure on previous page.)
Fig. 5 Effectors in G. rostochiensis are grouped into‘islands’. a Dorsal (black) or subventral (grey) effectors are skewed towards a higher
neighbouring gene distance compared to random (Student’s t-test, p <0.01), yet are contained within gene dense regions of the genome.
b The presence of effectors in adjacent (n ± 1), or neighbouring positions (up to ±9), was determined. As a negative control, a subset of 612 G. rostochiensis gene families not predicted to contain effectors was identified from the OrthoMCL. Starting from this initial negative set of 612 gene families, 37 of these gene families were selected at random and the presence of genes from these 37 families in adjacent (n ± 1), or neighbouring positions (up to ±9), was determined. This process was repeated for 1000 iterations to generate a robust negative for the average frequency in each neighbouring position. The observed frequency of effector occurrence at each position (black bars) was compared to the average of 1000 iterations for the negative (white bars). For non-effector containing gene families, increasing distance from each gene reduces the likelihood of identifying another member in any of the same families (error bars indicate standard deviation of 1000 iterations). The clustering of
effector loci extends beyond immediate neighbours, with an excess of effector loci as next-but-two neighbours (n ± 3) and also at n ± 6 (χ2, p 0.01 and
0.001, respectively). c Example of one island (7) at the edge of scaffold 00141. With the exception of high effector density (red), no obvious genetic features are associated (gaps (Ns, purple), AT content (black line), gene density (blue) microsatellites (orange), variants (black bars) and transposable elements (TEs, green)). d No difference in transposon density was found between islands, in the remainder of scaffolds containing islands,
in entire scaffolds containing islands or in scaffolds numerically adjacent to those containing islands (Kruskal–Wallis, p = 0.515, error bards indicate
standard deviation). When each island is treated as a single locus, the nearest external transposable element 5′ of the first gene, and 3′ of the
last, is significantly closer than expected (ANOVA, n = 39, p = 0.028 accounting for multiple testing, Fig. 5d). Interestingly, the inverse measurement (the closest internal transposon to each island border), is not significantly closer than expected (n = 45, p = 0.116, Fig. 5d), suggesting that this may be a feature of islands as an integral whole, rather than the separate genes comprising the islands
S0 O 00 R 0 G 7 G p a ls c a ff o ld 7 2 Gp als caff old 13 9 2 5 2 d l o f f a c s l a p G 3 5 dl o ff a c s l a p G Key G. pallida genes G. rostochiensis genes GC% Syntenic N
Fig. 6 Synteny between G. rostochiensis and G. pallida. G. rostochiensis genes (blue) in scaffold7 (500 kb) are syntenic (green arcs) with G. pallida genes (red) on four scaffolds. Synteny breakpoints primarily co-occur with large insertions in the G. pallida assembly. GC content and regions of undetermined sequence are represented by orange and black bars, respectively
(2.4/10 kb ±1.5, Kruskal–Wallis, p = 0.515, Fig. 5d), transposable elements are closely associated to island borders. When each island is treated as a single locus, the nearest external transposable element 5′ of the first gene, and 3′ of the last, is significantly closer than ex-pected (ANOVA, n = 39, p = 0.028 accounting for multiple testing, Fig. 5d). Interestingly, the inverse measurement (the closest internal transposon to each island border), is not significantly closer than expected (n = 45, p = 0.116, Fig. 5d), suggesting that this may be a feature of islands as an integral whole, rather than the separate genes compris-ing the islands.
Identification of a putative enhancer motif associated with dorsal gland effectors
The existing roster of effector proteins in plant-parasitic nematodes has been defined through painstaking and exacting experimental studies employing gland cell-specific complementary DNA (cDNA) sequencing and in situ hybridisation [43]. We therefore sought possible regulatory motifs associated with the highly tissue spe-cific expression pattern of effector genes that might act as an alternative criterion for their identification in silico [10, 48]. By employing a differential motif discovery al-gorithm which normalises for GC content (HOMER)
[49], we identified a short DNA motif (the DOrsal Gland motif or DOG box, ATGCCA), specifically enriched in the promoter region (500 bp upstream of the start codon) of genes sequence-similar to experimentally validated dor-sal gland cell effectors, compared to either sub-ventral
gland effectors or all other non-effectors (p = 1e–10). Of
the 101 G. rostochiensis dorsal gland effectors, 77 % had at least one DOG box in their promoter region. This encompasses 26 of the 28 dorsal gland effector families (92 %) including genes that are unrelated in sequence and ontogeny, yet only 5/10 non-dorsal gland effectors (subventral and amphid). Dorsal gland effectors con-tained an average of 2.54 DOG boxes in their promoter regions, compared to 0.22 for an identically sized subset of non-effectors, 0.32 for all non-effectors or 0.48 for effectors secreted from subventral glands (Fig. 7a). Motif occurrence peaked 150 bp upstream of the start codon and was not strand-specific. Despite the pres-ence of an ATG within the DOG box, the motif does not arise from specifically mis-predicting the start codon of effectors. A strand-specific, Kozak-like motif peak which includes the start codon (AAAATG) was observed in dorsal, subventral and non-effectors at the predicted start of the coding sequence (Fig. 7b). We were unable to identify a motif that correlated with
A
B
Fig. 7 DOG box: a six-nucleotide motif enriched in the promoter region of dorsal gland effectors. a The ATGCCA motif is specifically enriched in the promoter region of dorsal gland effectors compared to non-effectors and subventral gland effectors. On average, DOG box-containing dorsal gland effectors contain ~2.54 copies of the motif in their promoter region, compared to ~0.22 for an identical sized random subset of non-effectors or ~0.48 for subventral gland non-effectors. The frequency of this motif peaks 150 bp upstream of the start codon and is not strand-specific. b A strand-specific, Kozak-like motif, which includes the start codon (AAAATG), can be seen for dorsal, subventral and non-effectors at the predicted start of the coding sequence, indicating that predictions of translation start sites are accurate. No substantial cross-identification between each motif is seen
time of expression (e.g. when comparing dorsal gland effectors expressed at 14 dpi versus dorsal gland effec-tors expressed at J2) or with expression in the subven-tral gland. We found no enrichment of DOG boxes upstream of the first gene in tandem series of adjacent dorsal gland cell-expressed effectors arranged in an island.
The DOG box as a predictor of effectors
We screened the regions 500 bp upstream of all loci in the G. rostochiensis genome for DOG boxes on either strand. The number of genes associated with multiple DOG boxes was significantly higher than expected by chance (Fig. 8a). For some genes, nearly one-fifth of the entire 500 bp promoter region comprised ATGCCA mo-tifs. Sequences with more DOG boxes in their promoter regions were more likely to have predicted a signal pep-tide for secretion (Fig. 8b). These findings suggest that the DOG box may be a strong predictor of secretion, and thus likely effector function, of G. rostochiensis genes. The same DOG box motif was also present at a significantly higher frequency than would be expected by chance and was preferentially associated with se-creted proteins in G. pallida (Fig. 8a, b). In the more distantly related M. hapla, the number of genes with multiple occurrences of the motif in their promoter re-gion is higher than expected by chance, but the presence of motifs was not associated with the downstream gene encoding a predicted signal peptide. No enrichment of the DOG box or association with secreted proteins was
observed for the much more distantly related B. xylophi-lus. This suggests that in addition to minimal overlap between effector repertoires [22, 50], the control of effector expression in the dorsal gland cell may also re-quire a different motif/s in these nematodes.
Although not all secreted proteins are effectors, all effector proteins are secreted. Within the 150 G.
rosto-chiensisgenes with three or more DOG boxes and a
sig-nal peptide, there were 31 known effectors from 14 families, an approximately 100-fold enrichment. The ex-pression patterns of these 150 genes (including newly discovered candidate effector sequences) were consistent with a role in parasitism. For G. pallida, where more comprehensive life stage expression data are available, the same association was observed (Additional file 20: Figure S10) [22]. Despite the fact that most genes with >3 ATGCCA motifs in G. pallida and a signal peptide are expressed at J2, the number of motifs in the pro-moter region was not a quantitative predictor of gene
expression at J2 (R2= 0.0002, Additional file 20: Figure
S10) or at any other life stage, indicating that the ATGCCA motif is not a J2 enhancer. These data most likely reflect the biology of the nematode which dictates that a substantial proportion of effectors are required in the dorsal gland during the infective juvenile stages.
We used an extended set of criteria to predict poten-tial DOG effectors from G. rostochiensis and G. pallida. Genes with two or more DOG box motifs within 500 bp upstream of the start codon, a signal peptide and no transmembrane domain on the corresponding protein,
A
B
Fig. 8 Scope for utility of the DOG box to predict secretory proteins. a The number of promoter regions with multiple copies of DOG motifs is higher than random for G. rostochiensis, G. pallida and M. hapla, but not for B. xylophilus. Normal promoter regions are shown in red, 250 iterations of randomising the sequence of each promoter region are shown in grey, the average of which is shown in black. b For G. rostochiensis and G. pallida, the more motifs present in the promoter region, the more likely it is that the corresponding gene will contain a signal peptide for secretion (red line). Randomising each promoter region abolishes this effect (black line). For M. hapla and B. xylophilus, an increased number of motifs in the promoter regions does not correlate with a greater chance of the corresponding gene containing a predicted signal peptide
and temporal expression profiles consistent with a role in parasitism (Fig. 9a, b, Additional file 21: Table S9 and Additional file 22: Table S10) were classified as likely ef-fectors. To validate these criteria, we examined the spatial expression pattern using in situ hybridisation of two new predictions that had no similarity to any pub-lished effector. Both exhibited expression in the dorsal gland cell (Fig. 9c), confirming that the DOG box, in combination with other criteria, can act as a predictor of novel effector candidates. Novel gland cell protein g14226 was clustered in a genomic island with several other similar genes with multiple DOG boxes in their promoter region, another signature of canonical
Globo-dera effectors. As biological understanding of dorsal
(and other) gland expression in tylenchid plant parasites grows, it may be possible to refine the interpretation of DOG box presence and clustering and also develop un-derstanding of the control of gland cell expression of ef-fectors in other taxa.
Conclusions
The interactions between plant-parasitic nematodes and their hosts are both complex and specific. In a successful interaction, the nematodes can avoid induc-tion of an effective host immune response, resist any immune response that is expressed and manipulate the host’s developmental and cell biology to induce and maintain a functional feeding site. These interac-tions are mediated by an armoury of effectors that plant-parasitic nematodes appear to have assembled from adaptation of endogenous genes and also loci acquired by horizontal gene transfer from a diverse range of other taxa. To probe and understand these interactions, genomic analyses complement more di-rected studies, to drive and focus future programmes. Genomics can deliver whole-system analyses that per-mit global recovery of likely actors in parasite-host interactions. In turn, these insights can suggest new approaches to the understanding of pathogenesis and ultimately control of parasite-induced crop losses. The expanded effector set, including new effector types, the association of presence of particular ef-fector loci with breaking of plant resistance and the definition of shared transcriptional control systems we have reported here from genomic and transcriptomic ana-lyses of G. rostochiensis are demonstrations of this utility. Methods
Nematode culture and DNA isolation
G. rostochiensis populations Ro1, Ro2, Ro3, Ro4 and
Ro5 from the JHI PCN collection were maintained on a mixture of susceptible varieties in glasshouse conditions. For the reference assembly (Ro1), DNA was extracted according to described methods [22]. For population
re-sequencing, DNA extraction was carried out as previ-ously described [42].
Genome sequencing and assembly
Three sequencing libraries were prepared from total genomic DNA (Additional file 23: Table S11). A PCR-free 400–550 bp paired-end Illumina library was pre-pared using a previously described protocol [51], with the addition of sample clean up and size selection with Agencourt AMPure XP. DNA was precipitated onto beads after each enzymatic stage with an equal volume of 20 % Polyethylene Glycol 6000 and 2.5 M sodium chloride solution. Beads were not separated from the sample throughout the process until after the adapter ligation stage: fresh beads were then used for size selection. Two mate pair libraries with ~2 kb virtual insert size were constructed [52]. The libraries were denatured using 0.1 M sodium hydroxide and diluted to 8 pM in hybridisation buffer for cluster amplification on the Illumina cBOT using the V3 cluster generation kit following the manufacturer’s protocol, followed by a SYBRGreen cluster density QC prior to paired-end 100 base sequencing on an Illumina HiSeq2000. Raw data were analysed using the Illumina RTA1.8 analysis pipelines.
An initial assembly was produced from a combin-ation of short-fragment paired-end and mate-pair Illu-mina libraries (Additional file 23: Table S11). Short paired-end sequence reads were first corrected and initially assembled using SGA v0.9.7 30 [53]. This draft assembly was then used to calculate the distri-bution of k-mers for all odd values of k between 41 and 81, using GenomeTools v.1.3.7 [54]. The k-mer length for which the maximum number of unique k-mers were present in the SGA assembly (k = 63) was then used as the k-mer setting for de Bruijn graph construction in a second assembly with Velvet v1.2.03 32 [55]. The mate-pair library was then used to fur-ther scaffold this Velvet assembly using SSPACE [56] with an iterative approach, in which the number of read-pair links required to scaffold two contigs was initially set to 50, then reduced to 30, 20 and finally set to 10 for two final iterations of SSPACE to pro-duce assembly nGr.v0.9. The three whole genome se-quencing libraries were subsequently used to gap fill the assembly (GapFiller v1.10 [57], 10 iterations and default values for extension parameters), producing the final assembly nGr.v1.0.
A BlobDB (Blobtools v0.9.9 (https://drl.github.io/blob-tools/) [58, 59] was constructed using: (1) the assembly; (2) similarity search results against the NCBI Nucleotide database (BLASTn 2.3.0+ [60] megablast, E-value cutoff
1e–65), Uniref90 (Diamond v0.7.12 [61], blastx, using the
Cyst_1 Cyst_2 Egg_1 Egg_2 J2_1 J2_2 14dpi_1 14dpi_2
Pre infection hard
Pre infection soft
Pre+early hard
Pre+early soft
Early infection hard
Early infection soft
Egg_1 Egg_2 J2_1 J2_2 7dpi_1 7dpi_2 14dpi_114dpi_221dpi_121dpi_228dpi_128dpi_2 35dpi_135dpi_2male_1 male_2
Egg_1 Egg_2 J2_1 J2_27dpi_1 7dpi_2 14dpi_114dpi_221dpi_121dpi_228dpi_128dpi_2 35dpi_1 35dpi_2 male_1male_2
Pre infection hard
Pre infection soft
Pre+early hard
Early infection hard
Early infection soft
Late infection hard
All infection hard
Pre Early
Dormant Dormant Pre Early Late
G. rostochiensis G. pallida
A
B
10 0 -4 8 0 -4 3 0 -3 6 0 -6 8 0 -4 10 0 -6 0 -8 6 79 26 1 8 10 24 41Centered log2(normalised expression+1) Centered log2(normalised expression+1)
6 0 -4 6 0 -6 2 0 -1.5 4 0 -3 6 0 -2 3 0 -2
C
DOG_102 DOG_0094 DOG_0094 negativeDOG_0102 negative
reference genome nGp.v1.0 (BLASTn megablast, E-value
cutoff 1e–65); (3) the three DNA-seq read libraries
mapped back to the assembly (CLC mapper
v4.21.104315 CLCBio, Copenhagen, Denmark). A
Taxon-Annotated-Gc-Coverage plot (TAGC) was drawn
at the rank of phylum and under taxrule ‘bestsum’.
Using Blobtools view, taxonomically annotated
non-nematode scaffolds with a bit-score≥200 were inspected
manually and compared against NCBI Nucleotide data-base (BLASTn). Twenty-three scaffolds could be ex-cluded as contaminants based on strong similarity to Bacteria or Fungi (span = 98.2 kb). TAGC plots pre- and post-filtering are shown in Additional file 24: Figure S11. SSU/LSU rDNA screening was carried out through se-quence similarity searches (BLASTn megablast) of the assembly against SILVA SSUParc and LSUParc data-bases. Hits were only observed against G. rostochiensis SSU (scaffolds GROS_00919, GROS_01231) and LSU (scaffold GROS_00803, GROS_00919, GROS_01231). Genome annotation
Genome annotation was carried out in a two-step process detailed in the Additional file 2: Supplementary information. An initial round of automated gene predic-tions (nGr.v0.9.auto, 13,650 models) were refined in the collaborative genome annotation editor WebApollo (v1.0.4-RC3 [62]). Approximately one-eighth of the gene models were manually inspected based on homology to known Globodera genes, RNA-seq evidence and WGS read coverage yielding 1566 manually curated gene models (nGr.v0.9.manual). A second round of de novo gene prediction was carried out on assembly nGr.v1.0 with the addition of manual annotations as protein hom-ology evidence and mapped RNA-seq reads as intron-hints to train and run Augustus (v3.1 [63]) resulting in the final gene set nGr.v1.0 containing 14,309 protein-coding genes. Functional annotation was performed using InterProScan5 (v5.7-48.0 [64]) to identify motifs and domains in the proteins by comparing them against databases Gene3D, PRINTS, Pfam, Phobius, ProSitePat-terns, ProSiteProfiles, SMART, SUPERFAMILY, Signal-P_EUK, TIGRFAM, TMHMM, Annot8r with KEGG, GO, EC, tRNAscan and rfam. GO-Term annotation and GO-enrichment analysis was carried out using Blast2GO 3.1.3 [65].
Splicing
Splice sites were extracted from the genomes and GFF3 files present on WormBase for the species in Additional file 4: Figure S2, using custom script extractRegionFromCoordinates.py (https://github.com/ DRL/GenomeBiology2016_globodera_rostochiensis/GNU GENERAL PUBLIC LICENSE). Four base pairs up and downstream of the 5′ donor site, and 6 bp up-stream of the 3′ acceptor site were used to construct a consensus sequence for all GC/AG introns, and an identical sized sample of randomly selected GT/AG introns, using MEME SUITE v4.9.1 [66].
Transcriptome sequencing and differential expression RNA from two life stages (hatched second-stage juvenile and 14 dpi female) was sequenced, each in biological du-plicate, with Illumina Hiseq 100 bp paired-end reads (SRA accessions ERR202479, ERR202487 and PRJEB 12075). These were compared with two additional life stages (dormant cysts and hydrated eggs), similarly se-quenced in biological duplicate (Genbank accessions SAMN03393004 and SAMN03393005). All RNA-seq was carried out on pathotype Ro1. Normalized gene ex-pression values and differentially expressed genes were identified as previously described [50]. In brief, raw reads were trimmed of adapter sequences and low qual-ity bases (Phred <22, Trimmomatic [67]), mapped to the genome (Tophat2, [68]), counted on a per gene basis (bedtools v2.16.2 [69]), TMM normalised and differential expression analysis and clustering were performed using a Trinity wrapper pipeline and associated scripts for RSEM [70] and EdgeR [71] (FDR <0.001, minimum fold-change 4, [72]). Expression clusters were grouped based on the tree height parameter (12 %) and manually assigned to expression super-clusters.
Phylogenetic analysis of WAGO proteins
Putative G. rostochiensis (n = 23), G. pallida (n = 18) and
M. hapla (n = 18) WAGOs present in OrthoMCL
clus-ters, which contained at least one G. rostochiensis pro-tein with highest similarity to C. elegans WAGO1, were aligned to 545 WAGO sequences from Buck and Blaxter, 2013 [30]. This comprised WAGOs from Clade I, Clade III, Clade IV and Clade V nematodes, as well as non-Nematode argonaute sequences (http://datadryad.org/ (See figure on previous page.)
Fig. 9 All DOG effectors from G. rostochiensis and G. pallida. Using a minimum of two DOG boxes, presence of a signal peptide, absence of transmembrane domains and temporal expression profiles consistent with a role in parasitism as selection criteria, we identify and separate all DOG effectors from G. rostochiensis (a) and G. pallida (b) into putative functional groups. For both (a) and (b), clusters were manually assigned to ‘strict’ or ‘inclusive’ subsets of the same overall expression pattern, based on how they conform to the observed pattern. c Experimental validation of two novel G. rostochiensis DOG effectors confirms the dorsal gland cell expression prediction. DOG_0102 (g04707) contains five DOG boxes in its promoter while DOG_0094 (g14226) contains six boxes


![Table S4), as would be expected for effectors. The tem- tem-poral expression profiles of dorsal and subventral effec-tors were also consistent with the observed changes in activity of these glands throughout nematode develop-ment [38–41]](https://thumb-eu.123doks.com/thumbv2/123doknet/13572210.421253/10.892.88.804.637.990/expected-effectors-expression-profiles-subventral-consistent-observed-activity.webp)


![Figure S10) [22]. Despite the fact that most genes with](https://thumb-eu.123doks.com/thumbv2/123doknet/13572210.421253/15.892.87.809.690.989/figure-s-despite-fact-genes.webp)
