HAL Id: hal-00301040
https://hal.archives-ouvertes.fr/hal-00301040
Submitted on 7 Mar 2005HAL is a multi-disciplinary open access
archive for the deposit and dissemination of sci-entific research documents, whether they are pub-lished or not. The documents may come from teaching and research institutions in France or abroad, or from public or private research centers.
L’archive ouverte pluridisciplinaire HAL, est destinée au dépôt et à la diffusion de documents scientifiques de niveau recherche, publiés ou non, émanant des établissements d’enseignement et de recherche français ou étrangers, des laboratoires publics ou privés.
The direct radiative effect of biomass burning aerosols
over southern Africa
S. J. Abel, E. J. Highwood, J. M. Haywood, M. A. Stringer
To cite this version:
S. J. Abel, E. J. Highwood, J. M. Haywood, M. A. Stringer. The direct radiative effect of biomass burning aerosols over southern Africa. Atmospheric Chemistry and Physics Discussions, European Geosciences Union, 2005, 5 (2), pp.1165-1211. �hal-00301040�
ACPD
5, 1165–1211, 2005
Direct radiative effect of biomass burning aerosols S. J. Abel et al. Title Page Abstract Introduction Conclusions References Tables Figures J I J I Back Close
Full Screen / Esc
Print Version Interactive Discussion
EGU
Atmos. Chem. Phys. Discuss., 5, 1165–1211, 2005 www.atmos-chem-phys.org/acpd/5/1165/
SRef-ID: 1680-7375/acpd/2005-5-1165 European Geosciences Union
Atmospheric Chemistry and Physics Discussions
The direct radiative e
ffect of biomass
burning aerosols over southern Africa
S. J. Abel1, 2, E. J. Highwood1, J. M. Haywood2, and M. A. Stringer1 1Department of Meteorology, University of Reading, UK 2Met Office, Exeter, UK
Received: 8 November 2004 – Accepted: 20 November 2004 – Published: 7 March 2005 Correspondence to: S. J. Abel (steven.abel@metoffice.gov.uk)
© 2005 Author(s). This work is licensed under a Creative Commons License.
ACPD
5, 1165–1211, 2005
Direct radiative effect of biomass burning aerosols S. J. Abel et al. Title Page Abstract Introduction Conclusions References Tables Figures J I J I Back Close
Full Screen / Esc
Print Version Interactive Discussion
EGU
Abstract
A multi-column radiative transfer code is used to assess the direct radiative effect of biomass burning aerosols over the southern African region during September. The horizontal distribution of biomass smoke is estimated from two sources; i) General Circulation Model (GCM) simulations combined with measurements from the Aerosol
5
Robotic Network (AERONET) of Sun photometers; ii) data from the Moderate reso-lution Imaging Spectrometer (MODIS) satellite. Aircraft and satellite measurements are used to constrain the cloud fields, aerosol optical properties, vertical structure, and land surface albedo included in the model. The net regional direct effect of the biomass smoke is −3.1 to −3.6 Wm−2 at the top of atmosphere, and −14.4 to −17.0 Wm−2 at
10
the surface for the MODIS and GCM distributions of aerosol. The direct radiative effect is shown to be highly sensitive to the prescribed vertical profiles and aerosol optical properties. The diurnal cycle of clouds and the spectral dependency of surface albedo are also shown to play an important role.
1. Introduction
15
Atmospheric aerosols provide one of the largest uncertainties in our understanding of how human beings are continually altering the Earth’s climate. Aerosols act to modify the radiative balance of the climate system by scattering and absorbing radiation (the direct effect), and by altering the lifetime and radiative properties of clouds (the indirect effect). Both effects are believed to lead to a reduction in the global annual mean
sur-20
face temperature, thereby suppressing the warming that is attributed to anthropogenic greenhouse gases (e.g.Boucher and Haywood,2001;IPCC,2001).
Biomass burning has been recognized as a significant contributor to the burden of aerosols in continental tropical regions (Crutzen and Andreae,1990), and the corre-sponding radiative impacts are often much more dramatic than that from greenhouse
25
ACPD
5, 1165–1211, 2005
Direct radiative effect of biomass burning aerosols S. J. Abel et al. Title Page Abstract Introduction Conclusions References Tables Figures J I J I Back Close
Full Screen / Esc
Print Version Interactive Discussion
EGU
and Haywood,2003). However, quantifying the impact of biomass burning aerosols on both regional and global climate is problematic, due to the complexity in the aerosols chemical, physical, and optical properties, their spatial and temporal variability in the atmosphere, and the difficulty in characterizing their interaction with clouds. This is highlighted by the factor of three uncertainty and the very low level of scientific
under-5
standing assigned byIPCC (2001) for the global annual mean direct radiative forcing from biomass burning aerosols.
Detailed in situ measurements and satellite based retrievals have the potential to ad-dress some of these uncertainties, enabling the representation of the radiative effects of aerosols in climate models to be improved. This study incorporates satellite and in
10
situ based measurements of biomass burning aerosols into a multi-column radiative transfer code, to assess their direct radiative effect over the southern African region during September when anthropogenic burning activities are widespread. Sensitivity studies are then performed with the aim of highlighting the important parameters that need to be targeted by future observations and well represented in climate models in
15
order to reduce the current uncertainties in the direct radiative effect of biomass burning aerosols.
2. Experimental setup
2.1. Radiative transfer model
A multi-column version of the Edwards-Slingo radiative transfer code (Edwards and 20
Slingo, 1996) is used to examine the short-wave direct radiative effect of southern African biomass burning aerosols. Calculations are performed using the two-stream delta-Eddington approximation at a spectral resolution of 220 bands, encompassing the wavelength range 0.2 to 10 µm, with the majority of bands situated in the visible and near infra-red part of the spectrum. The horizontal resolution of the model was set
25
at 4×5◦, and the vertical resolution at 33 levels. The long-wave effect of the biomass 1167
ACPD
5, 1165–1211, 2005
Direct radiative effect of biomass burning aerosols S. J. Abel et al. Title Page Abstract Introduction Conclusions References Tables Figures J I J I Back Close
Full Screen / Esc
Print Version Interactive Discussion
EGU
burning aerosol is neglected and is likely to be small due to the strong wavelength dependence of the aerosol extinction coefficient (Haywood et al.,2003a).
3-D fields of any radiatively active gaseous absorbers, aerosols, and clouds, and a 2-D surface pressure and Lambertian surface albedo field can be prescribed in the model. In this study, the vertical profiles of temperature, pressure, and gaseous
ab-5
sorbers were held constant at every grid box. The tropical climatology ofMcClatchey
et al. (1972) was used for temperature, O3, and H2O(g). Other greenhouse gases in-cluded in the model were N2O, CH4, CO2, and O2. The mixing ratio data for these gases were taken fromCofer et al.(1996) andIPCC(2001) and were assumed to be well mixed throughout the atmosphere. Although elevated levels of gaseous absorbers
10
such as CH4will exist in the biomass plume, the impact on the short-wave is negligible. The distribution of biomass burning aerosol, cloud, and surface albedo included in the model is discussed in subsequent sections.
2.2. Horizontal distribution of aerosol
Two independent sources are used to simulate the horizontal distribution of biomass
15
burning aerosols over southern Africa; i) General circulation model (GCM) calculations that utilize transport models of various aerosol species (Tegen et al., 1997); ii) the Moderate resolution Imaging Spectrometer (MODIS) satellite retrieval of aerosol optical depth (Kaufman et al.,1997;Tanr ´e et al.,1997;Ichoku et al.,2003).
2.2.1. Model estimate of aerosol optical depth
20
The GCM model data of Tegen et al. (1997) consists of a global distribution of the monthly mean aerosol optical depth at a wavelength of 0.55 µm (τλ=0.55 µm), for sev-eral aerosol species based on transport models of soil dust (Tegen and Fung,1995), sea salt (Tegen et al.,1997), sulfate (Chin et al.,1996), and organic carbon (OC) and black carbon (BC) (Liousse et al.,1996) aerosols. The data is output at a horizontal
25
ACPD
5, 1165–1211, 2005
Direct radiative effect of biomass burning aerosols S. J. Abel et al. Title Page Abstract Introduction Conclusions References Tables Figures J I J I Back Close
Full Screen / Esc
Print Version Interactive Discussion
EGU
emitted from natural sources (e.g. direct emission of OC from plants), fossil fuel burn-ing, domestic fires (e.g. wood/charcoal/dung), agricultural fires (e.g. wheat/corn/rice), and savanna and forest burning. For this study, the contribution by biomass burning aerosols to the carbonaceous component over southern Africa during the dry season are assumed to dominate over emissions from natural and fossil fuel sources, allowing
5
the spatial distribution of the biomass smoke to be determined.
A climatology of ground based observations from the Aerosol Robotic Network (AERONET) of Sun and sky scanning spectral radiometers (Holben et al.,1998) over southern Africa is compiled to assess the accuracy of the the GCM calculations. The cloud screened, calibrated, and manually inspected Level 2.0 AERONET data
10
(Smirnov et al.,2000) covering the time period of June 1995–September 2003 is used.
A daily averaged τλ is initially compiled at each AERONET site, and then the monthly mean computed. Only days where at least three individual measurements are avail-able are included in the climatology. This process resulted in a total of 4857 daily and 268 monthly averaged values covering the 22 AERONET stations that had data
avail-15
able in the observation period considered, the location of which are indicated in Fig.1. Table1summarizes the observational statistics for each month. It is clear that August and September contain the greatest number of observations. This is a result of some temporary stations only taking measurements during the intensive Southern African Regional Science Initiative (SAFARI 2000) field campaign. The spatial distribution of
20
observations is poorest for April, with only 6 stations included in the climatology. To allow for a direct comparison with the GCM results, a third order polynomial fit is used to interpolate the AERONET data to a wavelength of 0.55 µm from the reported wavelengths of 0.34, 0.38, 0.44, 0.50, 0.67, 0.87, and 1.02 µm. For all months and stations, the coefficient of determination (R2) for the fit was >0.95. Figure 2 shows a
25
comparison of the total column integrated optical depth from the six AERONET stations that have data for at least 11 months of the year, with the GCM data in the grid box co-incident with each station. The AERONET data at Ascension Island, some 2500 km off the coast of southern Africa, has a peak in August, indicating that significant amounts
ACPD
5, 1165–1211, 2005
Direct radiative effect of biomass burning aerosols S. J. Abel et al. Title Page Abstract Introduction Conclusions References Tables Figures J I J I Back Close
Full Screen / Esc
Print Version Interactive Discussion
EGU
of biomass burning aerosol are transported large distances over the southern Atlantic Ocean during the dry season, as was measured onboard the Met Office C-130 aircraft during SAFARI 2000 (Haywood et al., 2003a). The other stations on the southern African continent show large increases in τλ=0.55 µmfrom the background values for the period of August to October when biomass burning is prevalent. It is clear that the
5
GCM results severely under predict the τλ=0.55 µm at all stations, especially in the dry season. It also appears that the model initiates the biomass burning season too early (May–June), whereas the observations suggest it occurs closer to July.
In order to quantify the underestimation in the model optical depth, a correction factor specific to each month is derived from a linear fit of the GCM τλ=0.55 µmto that measured
10
at the AERONET stations using all of the data in the climatology. Table 1 lists the correction factors for each month. The model appears to predict the column integrated optical depth to within ±10% in the months of June and July, although this may be due to the early initiation of the biomass burning cycle. During the burning season the model under predicts the τλ=0.55 µmby a factor of 1.8 to 3.4, with the largest error in
15
September and October. Figure2also includes the GCM data multiplied by the derived correction factors and the MODIS satellite data for September. The improvement in the model data with respect to the AERONET and satellite observations in both the magnitude and the seasonal cycle of τλ=0.55 µmis evident, suggesting that the correction factors are realistic.
20
However, to model the radiative impact of the biomass smoke alone, the fraction of aerosol in the column that is attributed to the background aerosol needs to be re-moved. Following the methodology ofRemer et al.(2002a), it is assumed that the GCM
ofTegen et al.(1997) models the background aerosol components (sea salt+ soil dust
+ sulfate) well in the dry season, and that the underestimation in the column integrated
25
optical depth is entirely due to the model producing low amounts of biomass burn-ing aerosol. To compensate for the underestimation of the biomass burnburn-ing aerosol τλ=0.55 µm in September (peak of burning season) the smoke component in the GCM data is boosted by a factor of 4.4 to reach agreement with the AERONET climatology.
ACPD
5, 1165–1211, 2005
Direct radiative effect of biomass burning aerosols S. J. Abel et al. Title Page Abstract Introduction Conclusions References Tables Figures J I J I Back Close
Full Screen / Esc
Print Version Interactive Discussion
EGU
This translates to a mean and standard deviation column fraction of biomass smoke of 84±12%. The derived column fraction is in agreement with the C-130 aircraft mea-surements over the south Atlantic (Osborne et al., 2004). However, the assumption that the background aerosol is modeled well in the GCM is highly uncertain, especially when the GCM also underestimates the τλ=0.55 µmin months where biomass burning is
5
uncommon (e.g. by a factor of 3.1 in February). Until global aerosol models can ade-quately reproduce observed distributions of aerosol, estimating the column contribution of aerosol by type is problematic.
2.2.2. MODIS satellite estimate of aerosol optical depth
The monthly mean column integrated aerosol optical depth for September (2000–2003
10
average) retrieved with the MODIS instrument onboard the Terra satellite and reported in the MOD08 Level-3 global atmospheric product at a wavelength of 0.55 µm, is also used to estimate the spatial distribution of the biomass burning aerosol. The monthly aerosol product results from an average of the daily Level-2 MOD04 10×10 km reso-lution aerosol product aggregated to a spatial resoreso-lution of 1×1◦(King et al.,2003). A
15
brief overview of the retrieval algorithm is now given.
The underlying assumption in the MODIS aerosol retrieval is that the up-welling re-flectance measured at the top of the atmosphere (TOA) is given by the sum of the surface and atmospheric components in the solar wavelength range. The atmospheric component of reflectance contains information about molecular scattering, clouds, and
20
aerosols. For the aerosol retrieval, cloud pixels are screened out using the MODIS cloud mask (Platnick et al.,2003) and aerosol properties are determined only in clear skies. To remove the surface contribution, different procedures are then applied when retrieving aerosol properties over land and ocean as a result of the more complex char-acteristics of the land surface reflectance. Over ocean the surface contribution to the
25
TOA reflectance is relatively small and is parameterized in the operational retrieval al-gorithm (Ichoku et al.,2003). Over land the surface reflectance is estimated using the 2.13 µm channel which is largely transparent to anthropogenic aerosol (large coarse
ACPD
5, 1165–1211, 2005
Direct radiative effect of biomass burning aerosols S. J. Abel et al. Title Page Abstract Introduction Conclusions References Tables Figures J I J I Back Close
Full Screen / Esc
Print Version Interactive Discussion
EGU
mode particles are likely to degrade the accuracy). This is then used to estimate the surface reflectance in other channels. However, the empirical relation used to estimate the surface reflectance at other wavelengths is only applicable to dark dense vege-tation or dark soils (Kaufman et al., 1997) and aerosol retrievals over bright surfaces such as deserts are not made.
5
Once the surface characteristics are determined the retrieval then uses look-up ta-bles based on detailed radiative transfer calculations that include variable τλ, solar zenith angle (SZA), satellite viewing angles, and various aerosol models to obtain agreement between the measured and modeled reflectances. Nine aerosol models are used in the ocean algorithm (4 fine modes, 5 coarse modes) and are not restricted
10
to geographical location (Tanr ´e et al.,1997), whereas the operational land algorithm contains only 3 aerosol models (2 fine modes, 1 coarse mode), of which an a-priori as-sumption of any fine mode contribution is determined solely on geographical location and season (Kaufman et al.,1997). During the biomass burning season over southern Africa, the aerosol model used assumes a fine fraction ω0 of 0.90. This is in
agree-15
ment with the C-130 aircraft measurements taken in the aged regional haze during SAFARI 2000 (Haywood et al.,2003a), but significantly higher than the measurements taken near source regions (Abel et al., 2003). The lower ω0 near source regions is likely to lead to an underestimation in the MODIS retrieved optical depth in southern Africa (Ichoku et al.,2003). However, the prelaunch estimates for the retrieval accuracy
20
of∆τ=±0.05±0.05τ at a wavelength of 0.55 µm over ocean (Tanr ´e et al.,1997) and ∆τλ=±0.05±0.20τλ over land (Kaufman et al.,1997) have been shown to be
reason-able (Chu et al.,2002;Remer et al.,2002b).
In constructing the 4 year average MODIS τλ=0.55 µm distribution for this study, the data was linearly interpolated to ‘data-missing’ regions over land where the surface
25
reflectance is too high for the retrieval algorithm. The data was then aggregated to the same resolution as the GCM and multiplied by the biomass smoke column fraction of 84% derived in Sect.2.2.1. As discussed previously, estimating the contribution of biomass smoke is highly problematic and the errors associated with the value of 84%
ACPD
5, 1165–1211, 2005
Direct radiative effect of biomass burning aerosols S. J. Abel et al. Title Page Abstract Introduction Conclusions References Tables Figures J I J I Back Close
Full Screen / Esc
Print Version Interactive Discussion
EGU
need to be treated as an additional uncertainty in the presented model calculations. 2.2.3. Comparison of the model and MODIS aerosol optical depth
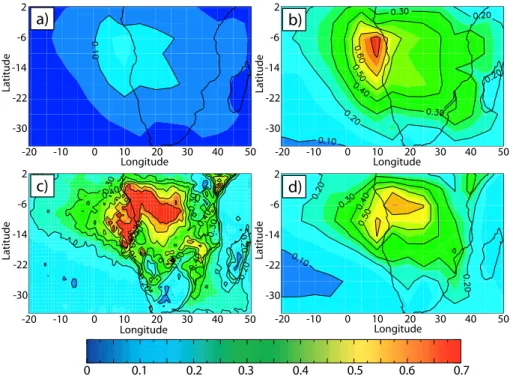
Figure 3 shows the spatial distribution of the monthly mean τλ=0.55 µm for September from the a) uncorrected OC+BC component in the GCM results ofTegen et al.(1997); b) the OC+BC component boosted by the correction factor of 4.4 derived from the
5
comparison with the AERONET climatology; c) the MODIS total column integrated value; d) the MODIS data multiplied by 84% to estimate the biomass burning aerosol component and aggregated to the GCM resolution. The transition between the ocean and land retrievals of aerosol in the monthly mean MODIS data is reasonably consistent even though significant differences exist between the retrieval algorithms over land and
10
ocean.
The under estimation of the aerosol optical depth in the uncorrected GCM data is evident, with values over southern Africa being significantly lower than in the MODIS satellite retrieval. Correcting the GCM data with the factor derived from the AERONET climatology brings the spatial pattern into much better agreement with the MODIS
dis-15
tribution. However, whereas there is a single peak off the western coast of southern Africa in the model data, the MODIS data has a secondary peak inland. Over oceanic regions the corrected GCM distribution tends to produce higher values of aerosol opti-cal depth than the remotely sensed data, especially off the eastern coast of Africa. The higher values may be the result of the compiled AERONET climatology being biased
20
to locations over land (only a single site out of the 22 was over oceanic regions), and so the derived correction factor of 4.4 is perhaps more representative of sites closer to the source regions. The sensitivity of the direct radiative effect of the biomass burning aerosol over southern Africa to the two spatial distributions of smoke (Figs.3b and d) is examined in Sect.3.1.
25
ACPD
5, 1165–1211, 2005
Direct radiative effect of biomass burning aerosols S. J. Abel et al. Title Page Abstract Introduction Conclusions References Tables Figures J I J I Back Close
Full Screen / Esc
Print Version Interactive Discussion
EGU
2.3. Aerosol optical properties
Mie theory is used to model the wavelength dependent optical properties of the biomass burning aerosol in both source regions that are heavily influenced by fresh smoke, and in the aged regional haze. This is achieved by fitting a series of three log-normals to the aerosol size distribution measured onboard the Met Office C-130
air-5
craft during the SAFARI 2000 field campaign in a fresh smoke plume (flight a790) and in aged smoke off the coast of Namibia (flight a791) (Haywood et al.,2003a). Suitable refractive indices were chosen to simulate the single scattering albedo (ω0λ=0.55 µm) calculated from direct measurements of the aerosol scattering and absorption (Abel
et al., 2003; Haywood et al.,2003a). A complex refractive index of 1.54–0.024i and
10
1.54–0.018i at a wavelength of 0.55 µm is used for the fresh and aged smoke respec-tively. Table2summarizes the modeled ω0, asymmetry parameter (g), and the specific extinction coefficient (ke) at selected wavelengths. The effect of hygroscopic growth is neglected as the effect on the optical properties is minimal (Magi and Hobbs,2003) at the low relative humidities measured in the biomass burning aerosol plume, and so the
15
measured quasi-dry aerosol optical properties are used.
To identify the most active regions of burning over southern Africa, the multi-year active fire data set derived from the Visible and Infrared Scanner (VIRS) instrument on the Tropical Rainfall Measuring Mission (TRMM) satellite is used. The strong emission of mid infra-red radiation from fires is exploited to detect a fire from the VIRS instrument,
20
and a detailed description of the retrieval algorithm and performance is given inGiglio
et al. (2003). Figure4 shows the mean fire counts for southern Africa in September (1998–2002 average). It is clear that the majority of fire activity in September occurs in a band between latitudes of −2 and −18◦N, although the East coast of southern Africa undergoes significant burning at more southerly latitudes. Abel et al. (2003)
25
show that a rapid evolution in the optical properties of biomass burning aerosols occur as fresh smoke plumes travel away from the fire source. Figure 4 also shows the grid boxes where the total fire count exceeds 500, indicating the areas where biomass
ACPD
5, 1165–1211, 2005
Direct radiative effect of biomass burning aerosols S. J. Abel et al. Title Page Abstract Introduction Conclusions References Tables Figures J I J I Back Close
Full Screen / Esc
Print Version Interactive Discussion
EGU
burning is most prevalent and the optical properties of fresh biomass burning aerosol are likely to dominate over the aged regional haze and should be included in the multi-column radiative transfer model. By the time the aerosol is advected away from the burning region, the optical properties measured in the aged regional haze will be more suitable. This is supported by AERONET measurements of ω0from SAFARI 2000 that
5
show values of 0.84 to 0.85 in the areas where local biomass burning is common, with higher values in areas away from the source regions (Eck et al., 2003). It should be noted that the threshold of 500 fires in a grid box to define the areas with greatest fire activity and thus where fresh aerosol properties are used is somewhat arbitrary, especially since the fire count data is likely to underestimate the total number of fires
10
(Giglio et al.,2003). However, the sensitivity of the direct radiative effect over southern
Africa to variations in the threshold value is investigated in Sect.3.2. 2.4. Horizontal distribution of cloud
Monthly mean data from the MODIS Terra satellite is employed to include cloud into the multi-column radiative transfer model using the 1×1◦MOD08 Level-3 global
atmo-15
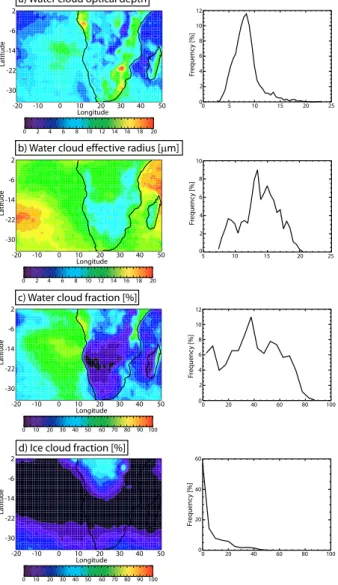
spheric product (King et al.,2003;Platnick et al.,2003). Figure5shows the horizontal distribution and histograms of the water cloud optical depth (τcl oud) and droplet e ffec-tive radius (ref f) for September (2000–2003 mean). Also shown are the water and ice cloud fractions over the southern African region.
The spatial distribution of the water cloud τcl oud (Fig.5a) shows values ranging from
20
approximately 6–13 off the coast of Namibia and Angola in September, where values of
τcl oud ranging from 1–12 were inferred from the C-130 aircraft measurements of cloud
liquid water path and ref f (Haywood et al., 2004). Higher τcl oud occurs when cloud forms over land, although the histogram reveals a peak value of 8 (mean=9, σ=3) over the whole of the southern African region. The histogram of water cloud ref f (Fig. 5 25
b) peaks at 13 µm (mean=14 µm, σ=3 µm). This value is somewhat higher than that measured on the C-130 aircraft during SAFARI 2000, withKeil and Haywood (2003) reporting a cloud top ref f of 7.4±3.6 µm, 7.4±3.1 µm, and 7.8±1.1 µm for three flights
ACPD
5, 1165–1211, 2005
Direct radiative effect of biomass burning aerosols S. J. Abel et al. Title Page Abstract Introduction Conclusions References Tables Figures J I J I Back Close
Full Screen / Esc
Print Version Interactive Discussion
EGU
off the coast Namibia and Angola. The water cloud fraction (Fig.5c) histogram peaks at 38% (mean=41%, σ=21%), although much larger values in excess of 60–70% can be seen off the coast of Namibia and Angola where a semi-permanent startocumulus cloud sheet is present. Furthermore, it is clear from the spatial distribution plot that the majority of the land mass in southern Africa is persistently cloud free during September,
5
with the exception being near some coastal areas. The ice cloud fraction (Fig. 5d) shows a very different distribution to the water cloud. The histogram peaks at 0% (mean=8%, σ=10%). It is clear from the spatial distribution that ice cloud is uncommon over the majority of the southern African region in September. For the purpose of this study ice clouds are not included in the multi-column radiative transfer model. The
10
presence of high ice clouds would act to reduce the magnitude of the direct radiative effect of any underlying biomass burning aerosol.
The effect of the diurnal variation of cloud amount and optical properties in the south-ern African region in September is also investigated. The majority of this work uses a four year mean cloud field derived from the Terra satellite, the orbit of which passes
15
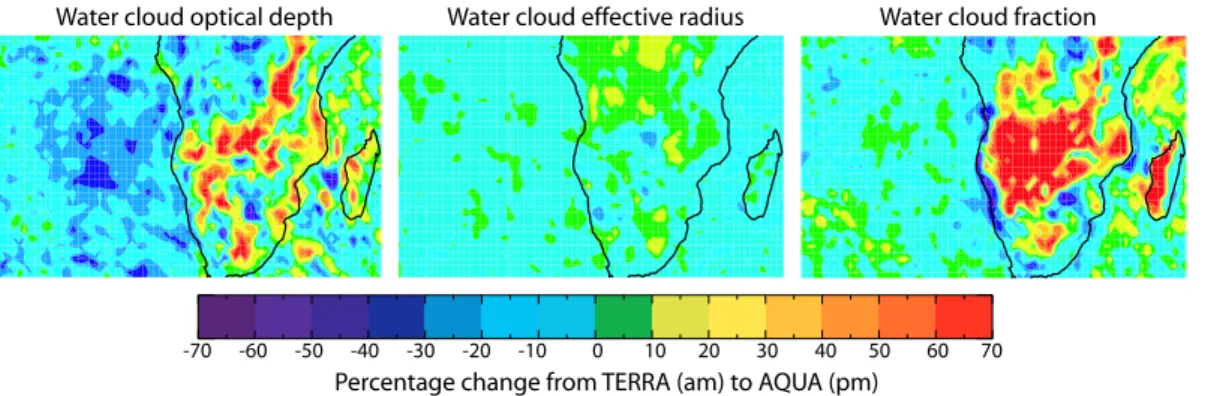
from North to South across the equator in the morning. The cloud field included in the model is therefore biased towards clouds present during the morning. The recent addition of the MODIS Aqua satellite with an orbit that overpasses the equator from South to North in the afternoon will dramatically increase the ability to monitor the daily variability of the atmosphere. Figure 6 shows the percentage change from the Terra
20
(morning overpass) to Aqua (afternoon overpass) data of τcl oud, ref f, and water cloud fraction for September (2002–2003 average). A positive value represents an increase during the day whilst a negative value represents a decrease. It is clear that the τcl oud and cloud fraction tends to decrease over oceanic regions during the day. This de-crease is consistent with visual observations of the stratocumulus cloud sheet off the
25
coast of Namibia and Angola from the C-130 aircraft during SAFARI 2000. It is also in agreement with ship based observations of marine stratiform clouds (Rozendaal et al.,
1995) and is likely a result of the increase in solar heating during the day tending to ‘burn-off’ the low-level cloud (e.g.Johnson et al.,2004). Over land regions increases
ACPD
5, 1165–1211, 2005
Direct radiative effect of biomass burning aerosols S. J. Abel et al. Title Page Abstract Introduction Conclusions References Tables Figures J I J I Back Close
Full Screen / Esc
Print Version Interactive Discussion
EGU
in the τcl oud and cloud fraction during the day are evident. This is possibly the result of an increase in convective activity. Differences between the Terra and Aqua measure-ments of ref f are fairly small over both land and oceanic regions. To test the impact of the cloud diurnal cycle on the direct radiative effect of the biomass smoke, model runs are also performed using the two year mean cloud field derived from the Aqua satellite
5
in Sect.3.3.
2.5. Vertical distribution of aerosol and cloud
The typical vertical profiles of biomass burning aerosol and cloud measured on the C-130 aircraft during SAFARI 2000 were included in the radiative transfer model. The measurements show that the aerosol tended to be well mixed in the continental
bound-10
ary layer over land (altitudes <4.5 km) due to strong dry convection (Haywood et al.,
2003a,b), whereas over oceanic regions the aerosol existed in an elevated polluted
layer (approximately 1.5–5.5 km above sea level) above a shallow marine boundary layer (MBL) (Keil and Haywood,2003;Haywood et al., 2004). Similar vertical struc-tures of biomass burning aerosol over land and oceanic regions have been measured
15
with other instrument platforms in the southern African region (Anderson et al.,1996;
Kaufman et al., 2003;Magi et al.,2003;Schmid et al.,2003). The aircraft
measure-ments show that over oceanic regions the low-level cloud tends to form at the top of the MBL below the elevated biomass plume (Haywood et al.,2004). Over land the cloud was observed to form at the top of the continental boundary layer. Aerosol particles
20
and cloud droplets are assumed to be externally mixed when they exist in the same model layer and changes in the aerosol optical properties with adsorption of water or any aerosol indirect effect on the cloud properties is neglected. In Sect.3.4the impact of changing the vertical profile on the direct radiative effect of the biomass smoke is investigated.
25
ACPD
5, 1165–1211, 2005
Direct radiative effect of biomass burning aerosols S. J. Abel et al. Title Page Abstract Introduction Conclusions References Tables Figures J I J I Back Close
Full Screen / Esc
Print Version Interactive Discussion
EGU
2.6. Surface albedo
Determination of the magnitude and sign of the direct radiative effect of aerosols on climate is highly sensitive to the prescribed surface albedo (e.g.Haywood and Shine,
1995;Ross et al.,1998;Myhre et al.,2003). A large number of GCMs currently adopt a
land cover classification scheme for the parameterization of the surface albedo, which
5
in turn requires an accurate representation of the soil and vegetation system (e.g.
Sellers et al., 1996). However, recent advances in satellite based retrievals allow a
long term consistent global and high spatial resolution data set of surface albedo to be derived. In this study, the sensitivity of the direct radiative effect of southern African biomass burning aerosol to the surface albedo derived from the Advanced Very High
10
Resolution Radiometer (AVHRR) and MODIS satellites is investigated.
Both the AVHRR and MODIS satellites follow a similar methodology to convert the measured clear-sky up-welling reflectances at the TOA to a land surface albedo. The method involves converting the measured directional reflectances to a hemispheric albedo by utilizing models of the land bidirectional reflectance functions, an
atmo-15
spheric correction to account for aerosol and water vapour effects, and a narrow to broadband spectral conversion.
The current operational MODIS surface albedo algorithm is discussed in detail in
Jin et al.(2003a,b). The retrieval outputs seven spectral narrowband albedos (λ=470,
555, 648, 858, 1240, and 2130 nm) and three broadband albedos, one in the visible
20
(0.3–0.7 µm), one in the near infra-red (0.7–5.0 µm), and one covering both the visible and near infra-red range (0.3–5.0 µm). Furthermore, both black-sky and white-sky albedos are reported at each spectral resolution. The black-sky albedo refers to the case where the surface is only illuminated by the direct component of the radiation whereas the illuminating radiation field in the white-sky albedo represents the diffuse
25
component. These are both intrinsic albedos that depend on the reflectance properties of the surface. The actual albedo that occurs in nature is a combination of the two and is dependent on the atmospheric illumination conditions. At the time of this study a
ACPD
5, 1165–1211, 2005
Direct radiative effect of biomass burning aerosols S. J. Abel et al. Title Page Abstract Introduction Conclusions References Tables Figures J I J I Back Close
Full Screen / Esc
Print Version Interactive Discussion
EGU
long term data set of the MODIS surface albedo product was not available and so the 0.25◦ resolution MOD43 16 day average product covering the period from 14–29 September 2001 is used. However, inclusion of the MODIS data into the radiative transfer model allows the effect that the increase in spectral complexity of the surface has on the radiative impact of the biomass burning aerosols to be investigated.
5
A detailed description of the AVHRR retrieval is given byGutman et al.(1995) and
Csiszar and Gutman(1999). The data set used in this study reports five year averaged
values (September 1985–1987, 1989–1990), and contains the direct component of the albedo (similar to the MODIS black-sky albedo) in a broadband covering the spectral range 0.35–3.0 µm at a resolution of 0.25◦. A comparison with the MODIS broadband
10
albedo will give insight into the effect that differences in the two retrievals, and perhaps changes in the surface albedo with time have on the radiative transfer calculations.
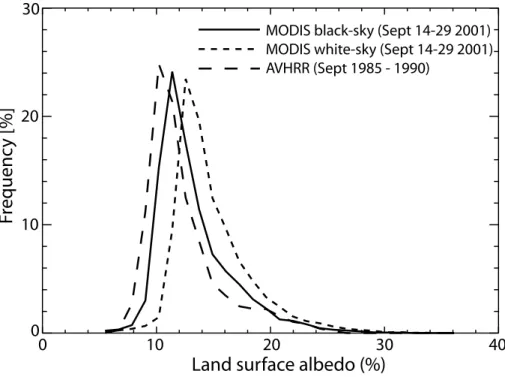
Figure 7 compares the broadband MODIS black-sky albedo over the southern African region to the broadband AVHRR albedo. Similar spatial patterns in the different retrievals of the direct component of the land surface albedo are evident. However,
sig-15
nificant differences in the two retrievals can be seen by examination of the histograms in Fig. 8, with the albedo from the MODIS retrieval being larger in general. This is consistent with the results ofJin et al.(2003b), who compare the two albedos over the whole globe and attribute the difference to i) the direct component of the albedo gener-ally being higher as the solar altitude increases due to the reflectance properties of the
20
surface (the MODIS black-sky albedo is normalized to local-solar noon whereas the AVHRR albedo is normalized to an overhead Sun); ii) a possible residual aerosol effect in the AVHRR data due to an underestimation of the aerosol amount in the retrievals atmospheric correction procedure; iii) a change in the land cover from the historical AVHRR data-set to the more recent MODIS observations. Differences may also arise
25
from the broadband retrievals of the two satellites covering different spectral ranges. The possible explanations are not investigated here, rather it is the resulting uncertainty in the modeled direct radiative effect to the different satellite retrievals of surface albedo that is of interest. It is also clear in Fig. 8that the MODIS white-sky albedo (isotropic
ACPD
5, 1165–1211, 2005
Direct radiative effect of biomass burning aerosols S. J. Abel et al. Title Page Abstract Introduction Conclusions References Tables Figures J I J I Back Close
Full Screen / Esc
Print Version Interactive Discussion
EGU
illumination) > MODIS black-sky albedo (direct illumination). The higher albedo results from an increase in the path length of a photon through the atmosphere and therefore a greater probability of multiple surface-atmosphere scattering with isotropic illumination compared to direct illumination at local solar noon.
Figure 9 shows the different spectral complexities available in the MODIS retrieval
5
for the model grid box centred at −22◦N and 20◦E. The seven spectral narrowband retrievals show that there is an increase in the land surface albedo with wavelength to v2 µm, highlighting the strong spectral dependence of the land surface reflectance. A 220 band spectral albedo is constructed at each model grid box by performing a quadratic fit to the seven spectral measurements in the wavelength range 0.47–
10
2.13 µm. Outside of the wavelength range covered by the retrieval the albedo is ex-trapolated at a fixed value. Also indicated are the three different broadband retrievals. In Sect.3.5the effect of including either the broadband (0.3–5.0 µm), the visible (VIS) and near infra-red (NIR) broadbands, or a 220 band spectral albedo to the radiative effect of the biomass smoke is explored.
15
In the radiative transfer model used in this study, both diffuse and direct components of surface albedo can be included. The ratio of the downwelling direct/diffuse radiation to the total downwelling radiation at the surface in the model is used to weight the indi-vidual direct/diffuse albedo components respectively. The inclusion of cloud or aerosol in the atmospheric column will therefore increase the relative weighting of the diffuse
20
albedo. It should be noted that for the AVHRR albedo only a single direct broadband retrieval is available and so the diffuse component is set equal to the direct compo-nent. Interpolation to data missing regions in the MODIS data-set over land due to non clear sky conditions is performed before inclusion into the model. Over oceanic regions the surface albedo is set equal to 4% at all wavelengths in both data sets and
25
is in agreement with the C-130 aircraft broadband measurements ofGlew et al.(2004) for the relevant monthly mean solar altitude over southern Africa. The strong SZA dependence of the sea surface reflectance is not accounted for in this study.
ACPD
5, 1165–1211, 2005
Direct radiative effect of biomass burning aerosols S. J. Abel et al. Title Page Abstract Introduction Conclusions References Tables Figures J I J I Back Close
Full Screen / Esc
Print Version Interactive Discussion
EGU
3. Results
Base case calculations were performed with both the MODIS and GCM derived dis-tributions of aerosol optical depth. Each model run included the fresh aerosol optical properties at the grid boxes where the total number of fire counts ≥500, and aged re-gional haze optical properties elsewhere, MODIS broadband (0.3–5.0 µm) direct and
5
diffuse land surface albedo, MODIS water cloud properties and spatial distribution from the Terra satellite, and the vertical profile measured onboard the C-130 aircraft over land and oceanic regions. The horizontal resolution of the model was set at the reso-lution of the GCM aerosol data (4x5◦). The finer resolution of the other data sets were aggregated to the coarser resolution of the GCM. This allowed a direct comparison of
10
the results from both of the aerosol distributions. At each grid point, the model time-step was set at 1 h and run over a 24 h period for the middle day of September. The incoming insolation at the TOA and SZA used to calculate the fluxes at each time-step are determined using the scheme employed in the Met Office Unified model (Ingram
et al., 1997). The output model fluxes are then averaged over the total number of
15
time-steps. Sensitivity tests were performed by running the model for the whole of September (computational time increased ×30), resulting in minor differences (≤1%) in the results presented. In the following analysis, the radiative forcing is defined as the instantaneous change in the net downwelling irradiance caused by the direct aerosol effect.
20
3.1. Base case: sensitivity to aerosol spatial distribution
Figure10shows the radiative forcing at the top of atmosphere (∆FT OA) for model runs with clouds not included (clear-sky) and with the inclusion of clouds (whole-sky) over the southern African region using the base case with the MODIS and GCM derived horizontal distributions of biomass burning aerosol. The clear-sky ∆FT OA is negative
25
everywhere and the spatial pattern is similar to the aerosol optical depth distribution included in the model, with the exception over the semi-arid regions to the South where
ACPD
5, 1165–1211, 2005
Direct radiative effect of biomass burning aerosols S. J. Abel et al. Title Page Abstract Introduction Conclusions References Tables Figures J I J I Back Close
Full Screen / Esc
Print Version Interactive Discussion
EGU
the higher surface reflectance reduces the net outgoing flux at the TOA compared to areas with a lower surface albedo. The whole-sky model runs show a positive∆FT OA off the coast of Namibia and Angola where the partially absorbing aerosol overlies low-level cloud and is negative elsewhere. The region of positive forcing is in agreement with that predicted from the calculations ofKeil and Haywood(2003). Also shown in
5
Fig.10is the whole-sky radiative forcing at the surface (∆Fsurf ace), with large negative values evident over the whole of the southern African region.
Table3 shows the average ∆FT OA and ∆Fsurf ace across the whole region, and the associated range in the forcing, diagnosed from the different spatial distributions of biomass smoke. The average clear-sky∆FT OA ranged from −7.6 to −9.1 Wm−2, and
10
the∆Fsurf ace from −18.1 to −21.4 Wm−2 for the different aerosol distributions. In the
absence of clouds the radiative impact at the surface isv2.4 times greater compared to at the TOA. This ratio compares favourably with the results ofIchoku et al.(2003) (∆FT OA=−10 Wm−2,∆Fsurf ace=−26 Wm−2), who use the MODIS aerosol optical depth data for September 2000 to determine the clear-sky forcing due to southern African
15
biomass smoke over the Atlantic Ocean, and is also typical of studies over the Indian Ocean region (Satheesh and Ramanathan,2000).
The average ∆FT OA for whole-sky conditions ranges from −3.1 to −3.6 Wm−2, and
the∆Fsurf ace from −14.4 to −17.0 Wm−2 depending on the aerosol distribution used,
with the strongest radiative impact from the GCM derived optical depth. By comparing
20
the clear-sky to the whole-sky runs it is clear that clouds reduce the direct radiative impact of biomass burning aerosol in the southern African region during September by a factor ofv2.5 at the TOA and v1.3 at the surface. The magnitude of the forcing is v4.6 times greater at the surface compared to the TOA in the whole-sky runs. This is a direct consequence of the large amount of solar radiation absorbed by the aerosol in
25
the atmosphere which is given by∆FT OA–∆Fsurf ace, resulting in average values of 11.3 and 13.4 Wm−2for the two cases. This is similar to the value of 14±3 Wm−2 reported for the Indian Ocean region during the dry season where large amounts of partially absorbing aerosol are persistent in a heavily polluted haze layer (Ramanathan et al.,
ACPD
5, 1165–1211, 2005
Direct radiative effect of biomass burning aerosols S. J. Abel et al. Title Page Abstract Introduction Conclusions References Tables Figures J I J I Back Close
Full Screen / Esc
Print Version Interactive Discussion
EGU 2001). The strong reduction in the surface solar radiation (range in the monthly mean
∆Fsurf ace=−5.9 to −43.5 Wm
−2
) must be compensated by a decrease in either the sur-face to atmosphere latent heat flux due to evaporation or to the sensible heat flux (
Ra-manathan et al.,2001). Reduction in the evaporation is likely to be significant over the oceanic regions and may result in a decrease in precipitation and a general weakening
5
of the hydrological cycle over the southern African region. Due to the dry conditions over land in September the reduction in solar radiation is more likely to be compen-sated by changes in the sensible heat flux. The inclusion of realistic aerosol and cloud fields as used in this study into more detailed climate models would be needed to as-certain if these processes are likely to occur, and if so, assess the subsequent effect
10
on regional climate.
Model runs were also performed using the uncorrected GCM aerosol distribution. This resulted in a large weakening of the modeled radiative forcing as a result of the large under estimation in the amount of aerosol. The impact was to reduce the average whole-sky ∆FT OA to −1.0 Wm−2 and the ∆Fsurf ace to −4.1 Wm−2, corresponding to
15
changes from the base case of −73% and −76% for the TOA and surface forcings respectively. This highlights the large uncertainties in modeling the impact of aerosols on the climate system when utilizing models that do not simulate the emissions and transport of aerosols correctly.
The input parameters were then varied from the base case, and the sensitivity of
20
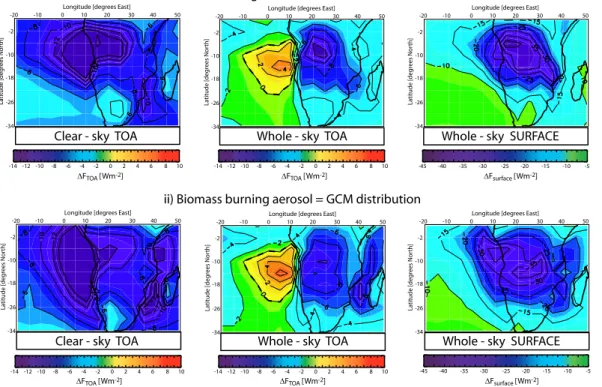
the radiative forcing to each parameter determined. Table4 summarizes the average radiative impact of the aerosol at the TOA and surface, the associated range, and the percentage change from the base case for various model runs using the MODIS aerosol distribution, whilst Fig. 11 shows the spatial distribution of the ∆FT OA for a selection of the model runs. Identical features in the sensitivity of the radiative forcing
25
were evident in model runs performed using the GCM aerosol distribution.
ACPD
5, 1165–1211, 2005
Direct radiative effect of biomass burning aerosols S. J. Abel et al. Title Page Abstract Introduction Conclusions References Tables Figures J I J I Back Close
Full Screen / Esc
Print Version Interactive Discussion
EGU
3.2. Sensitivity to aerosol optical properties
To assess the sensitivity in the radiative impact of the smoke from including one aerosol type in the model (fresh or aged) instead of identifying regions of persistent burning and including two types as in the base case, model runs were performed with the aerosol optical properties measured at the source and in the aged regional haze prescribed
5
to the whole region. The net regional ∆FT OA and ∆Fsurf ace were found to be highly sensitive to the aerosol properties, with differences of 53% at the TOA and 26% at the surface between the fresh and aged aerosol only runs.
However, the spatial pattern in the radiative forcing is very similar between the base and aged aerosol cases (compare Figs. 11 a and b), with differences of <±3% in
10
the regional forcing at both the TOA and surface. Much larger differences arise from the assumption of fresh aerosol everywhere. Figure11c shows that the inclusion of the fresh aerosol at all grid boxes results in a larger region of positive∆FT OA over the southern Atlantic Ocean due to the presence of a more absorbing aerosol overlying the highly reflective cloud layer. This results in a significant weakening in the magnitude
15
of the net regional impact of the biomass smoke at the TOA. In contrast, the excess absorption of the aerosol acts to further reduce the flux reaching the Earth’s surface and therefore strengthens∆Fsurf acewhen compared to the base case.
The sensitivity to variations in the threshold value required to assign fresh aerosol properties to a grid box based on satellite fire counts is reduced to 300 from the base
20
case of 500. This increases the surface area of the southern African region covered by fresh biomass smoke in the model from approximately 5 to 9% and results in a small weakening in the∆FT OA by 2%. This suggests that the added complexity of including both fresh aerosol where burning is prevalent, and aged aerosol properties elsewhere does not significantly improve the estimation of ∆FT OA and ∆Fsurf ace on a regional
25
scale compared to when using aged properties everywhere (3–5% depending on the threshold value).
ACPD
5, 1165–1211, 2005
Direct radiative effect of biomass burning aerosols S. J. Abel et al. Title Page Abstract Introduction Conclusions References Tables Figures J I J I Back Close
Full Screen / Esc
Print Version Interactive Discussion
EGU
3.3. Sensitivity to cloud optical depth and optical properties
The MODIS satellite measurements of τcl oud and ref f used in this study do not include aerosols in the retrieval algorithm. Haywood et al.(2004) demonstrate that a potential low bias exists in the MODIS data when biomass burning aerosols overlay low-level clouds, as is the case off the coast of Namibia and Angola. This bias may be as large
5
as −30% in τcl oud and −3 µm in ref f depending on the burden and optical properties of the cloud and aerosol, and the wavelengths used in the retrieval. Model runs were performed with the ref f increased by 1 to 3 µm, and the τcl oud corrected for a 10%
(τcl oud/0.9) and a 30% (τcl oud/0.7) underestimation in cloud optical thickness across
the whole region in order to assess the impact that any biases have on the radiative
10
forcing of the biomass smoke.
Increasing the ref f of the MODIS data decreases the cloud reflectivity. Hence, the radiative impact of the aerosol over land increases as more solar radiation passes through the cloud to the underlying aerosol, and over oceanic regions the positive forc-ing decreases due to a smaller probability of multiple scatterforc-ing between the aerosol
15
and cloud (Fig.11d). However, the impact on the radiative forcing to the changes in ref f is small in comparison to the other parameters tested, with a strengthening of the av-erage∆FT OAfrom 1 to 4%, and of <1 to 1% in the∆Fsurf ace, for an increase in ref f of 1 to 3 µm. An increase in τcl oud leads to a greater probability of a photon being scattered back out of the cloud top, and so the impact on the forcing is of the opposite sign to an
20
increase in ref f. Figure11e shows that the positive region of∆FT OA over the southern Atlantic Ocean expands significantly compared to the base case when compensating for a 30% low bias in τcl oud. The net regional effect is to decrease the average ∆FT OA by 8 to 26% when compensating for a 10 to 30% low bias in cloud optical thickness. The sensitivity at the surface is less, with changes ranging from −1 to −5%.
25
The effect of the diurnal cycle of clouds on the direct radiative effect of the biomass smoke is investigated by replacing the water cloud spatial distribution and optical prop-erties derived from the MODIS Terra satellite (morning overpass) used in the majority of
ACPD
5, 1165–1211, 2005
Direct radiative effect of biomass burning aerosols S. J. Abel et al. Title Page Abstract Introduction Conclusions References Tables Figures J I J I Back Close
Full Screen / Esc
Print Version Interactive Discussion
EGU
this study with those derived from the MODIS Aqua satellite (afternoon overpass). Fig-ure11f shows that the general reduction in both cloud cover and τcl oud over oceanic regions results in a reduction in the positive ∆FT OA of the overlying biomass smoke. Over land regions the∆FT OA becomes weaker due to an increase in cloud at the top of the biomass burning aerosol layer, although the impact of the cloud diurnal cycle is
5
weaker than over oceanic regions due to the lower cloud fraction. The net effect is to increase the∆FT OA by 14%, and by 2% in the∆Fsurf ace across the southern African region.
3.4. Sensitivity to the vertical structure of aerosol and cloud
The sensitivity to the vertical structure was examined by performing calculations with
10
both the oceanic profile (aerosol above cloud level) and the land profile (aerosol in and below cloud level) applied to the whole region.
The average ∆FT OA across the region decreased by 32% with application of the oceanic vertical structure. Figure11g shows that this is the result of the region of pos-itive forcing off the West coast of southern Africa extending into land regions around
15
the coast where cloud is prevalent. The magnitude of the forcing is also weakened further inland where the cloud amount is not large enough to result in a positive∆FT OA. Substituting the vertical profile measured over land to the whole region resulted in an increase in the∆FT OA of 53%. It can be seen in Fig. 11h that the presence of cloud at the top of the aerosol layer eliminates all of the areas of positive ∆FT OA, and so
20
the impact of the biomass burning aerosol is to increase the outgoing flux at the TOA throughout the southern African region. This unrealistic vertical profile over oceanic re-gions gives similar results regarding the sign of the radiative forcing to the GCM results
ofPenner et al.(1998),Grant et al.(1999), andIacobellis et al.(1999), highlighting the
importance of accurately representing both aerosol and cloud fields in models when
25
assessing the magnitude and sign of the direct aerosol effect at the TOA.
In contrast, the∆Fsurf aceis not sensitive to the vertical profile, with differences from the base case of ≤2% for both oceanic and land profiles. This is because the
down-ACPD
5, 1165–1211, 2005
Direct radiative effect of biomass burning aerosols S. J. Abel et al. Title Page Abstract Introduction Conclusions References Tables Figures J I J I Back Close
Full Screen / Esc
Print Version Interactive Discussion
EGU
welling flux at the surface is mainly sensitive to the transmission of the overlying at-mosphere which is largely independent on the vertical structure, whereas the fluxes at the TOA are sensitive to the radiation incident on the aerosol layer and the underlying reflectance. These in turn are highly dependent on the aerosol and cloud profile. 3.5. Sensitivity to the land surface albedo
5
The inclusion of the AVHRR broad-band land surface albedo (Fig. 11i) resulted in a strengthening of the∆FT OA by 3% when compared to the MODIS broad-band albedo used in the base case. This is the result of a lower probability of multiple surface-aerosol scattering due to the less reflective surface, leading to a smaller degree of aerosol absorption. Changes of <1% in the radiative impact were evident at the
sur-10
face.
Application of the more detailed spectrally varying albedo (220 bands) derived from the fit to the seven wavelengths in the MODIS satellite retrieval resulted in a strength-ening of the∆FT OA and the∆Fsurf ace by 10% and 1%, respectively. This increase is a direct result of the high spectral dependence of the aerosol optical properties.
Be-15
cause the land surface albedo tends to be lower in the visible wavelength range (where the aerosol extinction coefficient is the largest) than at longer wavelengths, the sur-face is effectively less reflective than in the broad-band retrieval and therefore leads to less aerosol absorption in the atmosphere and a greater outgoing flux at the TOA (see Fig.11j). This shows that the wavelength dependence of surface albedo plays an
im-20
portant role in determining the radiative impact of aerosols. The inclusion of the MODIS visible and near infra-red broadband albedo resulted in small differences of <2% in the ∆FT OA compared to using the more detailed 220 band version, suggesting that the
simple inclusion of a visible and near infra-red broadband albedo in climate models will improve the assessment of any direct aerosol radiative effect when compared to using
25
a single broadband albedo.
ACPD
5, 1165–1211, 2005
Direct radiative effect of biomass burning aerosols S. J. Abel et al. Title Page Abstract Introduction Conclusions References Tables Figures J I J I Back Close
Full Screen / Esc
Print Version Interactive Discussion
EGU
4. Conclusions
In this study a multi-column radiative transfer code is used to model the direct radiative effect of biomass burning aerosols over the southern African region during September (peak of burning season). The input parameters included in the model are constrained by a variety of measurements and the most important parameters that need to be
tar-5
geted by future observations and accurately captured in more detailed climate models are then determined.
The horizontal distribution of biomass burning aerosols were estimated from the GCM model results of Tegen et al. (1997) and from a four year data set of obser-vations from the MODIS Terra satellite. The GCM distribution was found to severely
10
under estimate the column integrated aerosol optical depth when compared to ground based and satellite observations, especially in the dry burning season. Correction fac-tors were derived to compensate for the low bias in the model data and back-out the biomass smoke component. By placing constraints on the spatial distribution of aerosol derived from observations, the aerosol distribution is likely to be less uncertain than in
15
previous GCM studies of the radiative impact of biomass burning aerosols (e.g.Penner
et al.,1998;Iacobellis et al.,1999;Myhre et al.,2003).
The modeled clear-sky ∆FT OA averaged over the southern African region ranged from −7.6 to −9.1 Wm−2, and the∆Fsurf ace from −18.1 to −21.4 Wm−2for the MODIS and GCM derived aerosol fields (base case). The inclusion of clouds in the model
20
reduced the radiative impact of the biomass smoke, resulting in an average∆FT OA of −3.1 to −3.6 Wm−2 and a∆Fsurf ace of −14.4 to −17.0 Wm−2. The corresponding ab-sorption of solar radiation by the intervening atmosphere is 11.3 to 13.4 Wm−2. This shows that the direct effect of southern African biomass burning aerosols can signifi-cantly alter the tropospheric and surface energy budgets, and may therefore influence
25
the hydrological cycle and atmospheric circulation patterns (Ramanathan et al.,2001). The sensitivity of the direct effect to the aerosol optical properties is primarily driven by differences in ω0, and hence the degree of absorption of short-wave radiation by the
ACPD
5, 1165–1211, 2005
Direct radiative effect of biomass burning aerosols S. J. Abel et al. Title Page Abstract Introduction Conclusions References Tables Figures J I J I Back Close
Full Screen / Esc
Print Version Interactive Discussion
EGU
biomass burning aerosol. As a result of the rapid evolution in the aerosol ω0downwind from emission sources (Abel et al.,2003), it was found that models can adequately sim-ulate the mean regional direct effect of biomass smoke when the properties of aged aerosols are prescribed throughout the southern African region, whereas model sim-ulations that included the optical properties of fresh smoke (lower ω0) everywhere
re-5
sulted in a large underestimation in the∆FT OA. This suggests that measurements of the optical properties of biomass burning aerosols taken near emission sources are of limited use when assessing the large scale radiative impacts of biomass smoke.
The vertical structure of biomass burning aerosols and clouds was critical in deter-mining the magnitude (regional) and sign (local) of the∆FT OA. Using realistic vertical
10
profiles based on in situ measurements, sharp contrasts between areas of strong posi-tive and negaposi-tive∆FT OAwere apparent. A large region of positive∆FT OAwas calculated in this study over the southern Atlantic Ocean where the biomass smoke is advected above low level clouds, in agreement with the results ofKeil and Haywood(2003). This is in contrast to the model studies considered byIPCC(2001), indicating that the
ver-15
tical structure and/or cloud fields were not simulated well in those models. Current measurements of the vertical structure of aerosols and clouds are limited to aircraft and ground based measurements, and are therefore both spatially and temporally data sparse. The advent of spaceborne lidars such as the Cloud-Aerosol Lidar and Infrared Pathfinder Satellite Observations (CALIPSO) instrument (Winker et al.,2003) will
en-20
able the vertical profiles of tropospheric aerosols and clouds to be characterized on a global scale, providing a means of improving model simulations.
The ∆FT OA was shown to be sensitive to the diurnal cycle of clouds and therefore needs to be well represented in climate models, particularly in regions where partially absorbing aerosols exist in elevated layers. The recent measurements from the polar
25
orbiting MODIS Aqua satellite (afternoon overpass) will compliment the data from the MODIS Terra satellite (morning overpass) in building up a global picture of the diurnal cycle of clouds, albeit limited to two measurements over an individual scene each day. The data from geostationary satellites, such as Meteosat 7, can provide high temporal
ACPD
5, 1165–1211, 2005
Direct radiative effect of biomass burning aerosols S. J. Abel et al. Title Page Abstract Introduction Conclusions References Tables Figures J I J I Back Close
Full Screen / Esc
Print Version Interactive Discussion
EGU
information of clouds that are likely to be more useful in validating the diurnal cycle in models (e.g.Slingo et al.,2004).
The role of the land surface characteristics were examined by including the AVHRR and MODIS satellite retrievals of land surface albedo into the model at various spec-tral resolutions. The wavelength dependence of the surface reflectance was shown to
5
play an important role in simulating the direct aerosol effect, and that the inclusion of a visible and near infrared broadband albedo improved the representation of the surface when compared to the inclusion of a single broadband retrieval. Future measurement campaigns should therefore examine the spectral dependency of surface albedo in or-der to both validate satellite based retrievals and to provide constraints for local column
10
radiative closure studies.
Assimilation of satellite based aerosol products into models is now coming to the fore, and has been shown to improve the representation of aerosol optical depth in current models (Collins et al.,2001). As data assimilation techniques become more advanced, and future satellites observe the atmosphere in more detail, the technique should be
15
used to improve the representations of the burden, vertical distribution, and optical properties of aerosols and clouds in both climate simulations and numerical weather prediction models, thereby reducing many of the large uncertainties in the radiative effects of aerosols and the resulting changes in the meteorology and climate. However, the potential uncertainties in spaceborne retrievals of atmospheric constituents must
20
be borne in mind. For example, the potential low bias in cloud optical depth due to the neglect of overlying absorbing aerosols in the MODIS cloud retrieval algorithm
(Haywood et al.,2004) may have led to an overestimation of the radiative forcing at
the TOA in the model calculations presented in this study. Detailed in-situ aircraft and ground based measurements are therefore required to validate the operational satellite
25
based retrievals under a wide range of atmospheric conditions.
Acknowledgements. We would like to thank the Meteorological Research Flight aircrew and
support staff for their efforts during SAFARI 2000. B. Holben and S. Piketh and their staff are thanked for establishing and maintaining the 22 AERONET sites used in this investigation.
ACPD
5, 1165–1211, 2005
Direct radiative effect of biomass burning aerosols S. J. Abel et al. Title Page Abstract Introduction Conclusions References Tables Figures J I J I Back Close
Full Screen / Esc
Print Version Interactive Discussion
EGU
S. Abel would like to thank NERC and the Met Office for providing the CASE studentship under which this research was undertaken.
References
Abel, S. J., Haywood, J. M., Highwood, E. J., Li, J., and Buseck, P. R.: Evolution of biomass burning aerosol properties from an agricultural fire in southern Africa., Geophys. Res. Lett.,
5
30, 1783, doi:10.1029/2002GL017342, 2003. 1172,1174,1189
Anderson, B. E., Grant, W. B., Gregory, G. L., Browell, E. V., Collins Jr., J. E., Sachse, G. W., Bagwell, D. R., Hudgins, C. H., Blake, D. R., and Blake, N. J.: Aerosols from biomass burning over the tropical South Atlantic region: Distributions and impacts, J. Geophys. Res., 101, 24 117–24 137, 1996. 1177
10
Boucher, O. and Haywood, J.: On summing the components of radiative forcing of climate change, Clim. Dyn., 18, 297–302, 2001. 1166
Chin, M., Jacob, D. J., Gardner, G. M., Spiro, P. A., Foreman-Fowler, M., and Savoie, D. L.: A global three-dimensional model of tropospheric sulfate, J. Geophys. Res., 101, 18 677– 18 690, 1996. 1168
15
Chu, D. A., Kaufman, Y. J., Ichoku, C., Remer, L. A., Tanr ´e, D., and Holben, B. N.: Validation of MODIS aerosol optical depth retrieval over land, Geophys. Res. Lett., 29, doi:10.1029/2001GL013205, 2002. 1172
Cofer III., W. R., Levine, J. S., Winstead, E. L., Cahoon, D. R., Sebacher, D. I., Pinto, J. P., and Stocks, B. J.: Source compositions of trace gases released during African savanna fires, J.
20
Geophys. Res., 101, 23 597–23 602, 1996. 1168
Collins, W. D., Rasch, P. J., Eaton, B. E., Khattatov, B. V., Lamarque, J.-F., and Zender, C. S.: Simulating aerosols using a chemical transport model with assimilation of satellite aerosol retrievals: Methodology for INDOEX, J. Geophys. Res., 106, 7313–7336, 2001. 1190 Crutzen, P. J. and Andreae, M. O.: Biomass burning in the tropics: impact on atmospheric
25
chemistry and biogeochemical cycles, Science, 250, 1669–1678, 1990. 1166
Csiszar, I. and Gutman, G.: Mapping global land surface albedo from NOAA AVHRR, J. Geo-phys. Res., 104, 6215–6228, 1999. 1179
Eck, T. F., Holben, B. N., Ward, D. E., Mukelabai, M. M., Dubovik, O., Smirnov, A., Schafer, J. S., Hsu, N. C., Piketh, S. J., Queface, A., Le Roux, J., Swap, R. J., and Slutsker, I.:
30


![[PDF] Démarrer et avancer avec la programmation en VBA Excel cours PDF - Cours Excel](data:image/gif;base64,R0lGODlhAQABAIAAAP///wAAACH5BAEAAAAALAAAAAABAAEAAAICRAEAOw==)