HAL Id: hal-00295641
https://hal.archives-ouvertes.fr/hal-00295641
Submitted on 16 Mar 2005
HAL is a multi-disciplinary open access
archive for the deposit and dissemination of
sci-entific research documents, whether they are
pub-lished or not. The documents may come from
teaching and research institutions in France or
abroad, or from public or private research centers.
L’archive ouverte pluridisciplinaire HAL, est
destinée au dépôt et à la diffusion de documents
scientifiques de niveau recherche, publiés ou non,
émanant des établissements d’enseignement et de
recherche français ou étrangers, des laboratoires
publics ou privés.
mode particle growth
M. Boy, M. Kulmala, T. M. Ruuskanen, M. Pihlatie, A. Reissell, P. P. Aalto,
P. Keronen, M. Dal Maso, H. Hellen, H. Hakola, et al.
To cite this version:
M. Boy, M. Kulmala, T. M. Ruuskanen, M. Pihlatie, A. Reissell, et al.. Sulphuric acid closure and
contribution to nucleation mode particle growth. Atmospheric Chemistry and Physics, European
Geosciences Union, 2005, 5 (4), pp.863-878. �hal-00295641�
Atmos. Chem. Phys., 5, 863–878, 2005 www.atmos-chem-phys.org/acp/5/863/ SRef-ID: 1680-7324/acp/2005-5-863 European Geosciences Union
Atmospheric
Chemistry
and Physics
Sulphuric acid closure and contribution to nucleation mode particle
growth
M. Boy1, M. Kulmala1, T. M. Ruuskanen1, M. Pihlatie1, A. Reissell1, P. P. Aalto1, P. Keronen1, M. Dal Maso1, H. Hellen2, H. Hakola2, R. Jansson3, M. Hanke4, and F. Arnold4
1University of Helsinki, Dept. Physical Sciences, P.O. Box 64, FIN-00014 Univ. of Helsinki, Finland 2Finnish Meteorological Institute, Air Quality Research, Sahaajankatu 20 E, FIN-00880 Helsinki, Finland
3Stockholm University (ITML), Air Pollution Laboratory, Institute for Applied Environmental Research, Stockholm
University, S-10691 Stockholm, Sweden
4Atmospheric Physics Division, Max-Planck Institute for Nuclear Physics, (MPIK), P.O. Box 103980, D-69029 Heidelberg,
Germany
Received: 23 June 2004 – Published in Atmos. Chem. Phys. Discuss.: 7 October 2004 Revised: 21 December 2004 – Accepted: 3 March 2005 – Published: 16 March 2005
Abstract. Sulphuric acid concentrations were measured and
calculated based on pseudo steady state model with corre-sponding measurements of CO, NOx, O3, SO2, methane and
non-methane hydrocarbon (NMHC) concentrations as well as solar spectral irradiance and particle number concentra-tions with size distribuconcentra-tions. The measurements were per-formed as a part of the EU project QUEST (Quantifica-tion of Aerosol Nuclea(Quantifica-tion in the European Boundary layer) during an intensive field campaign, which was conducted in Hyyti¨al¨a, Finland in March–April 2003. In this paper, the closure between measured and calculated H2SO4
con-centrations is investigated. Besides that, also the contribu-tion of sulphuric acid to nucleacontribu-tion mode particle growth rates is studied. Hydroxyl and hydroperoxy radical con-centrations were determined using a pseudo steady state box model including photo stationary states. The maxi-mum midday OH concentrations ranged between 4.1×10⁵to 1.8×10⁶molecules cm−3 and the corresponding values for HO2were 1.0×10⁷to 1.5×10⁸molecules cm−3. The
domi-nant source term for hydroxyl radicals is the reaction of NO with HO2 (56%) and the reaction of CO with OH covers
around 41% of the sinks. The sulphuric acid source term is the reaction SO2with OH and the sink term is
condensa-tion of sulphuric acid. The closure between measured and calculated sulphuric acid concentrations is achieved with a high agreement to the measured values. In sensitivity stud-ies, we used different values for the non-methane hydrocar-bons, the peroxy radicals and nitrogen dioxide. The best fits between calculated and measured values were found by de-creasing the NO2concentration when it exceeded values of
1.5 ppb and doubling the non-methane hydrocarbon concen-Correspondence to: M. Boy
(michael.boy@helsinki.fi)
trations. The ratio, standard deviation and correlation coef-ficient between measured and calculated sulphuric acid con-centrations are 0.99, 0.412 and 0.645, respectively. The max-imum midday sulphuric acid concentrations varied between 3×10⁵ to 1.9×10⁷molecules cm−3 for the measurements and 3×10⁵to 1.4×10⁷molecules cm−3for the calculations, respectively. An average participation of sulphuric acid to the nucleation mode particle growth rates is 8.8%. Classi-fying the days into two groups – “polluted” days with air masses originated over Central Europe or UK, and “cleaner” days with air masses originated over the Northern Atlantic or the Polar regions – reflects an equal sulphuric acid contribu-tion to the aerosol growth in both air mass classes.
1 Introduction
Aerosol particles are ubiquitous in the Earth’s atmosphere and influence our quality of life in many different ways. In urban environments, aerosol particles can affect human health through their inhalation (Wichmann and Peters, 2000; Stieb et al., 2002). In a global troposphere, and particu-larly downwind from major pollution sources, aerosol parti-cles are thought to contribute to climate change patterns (Ra-manathan et al., 2001; Menon et al., 2002). Understanding these effects requires detailed information on how aerosol particles enter the atmosphere and how they are transformed before being removed by dry or wet deposition. Key pro-cesses in this respect are the formation of new atmospheric particles and their subsequent growth to larger sizes.
In recent years the formation and growth of nanometer-size atmospheric aerosol particles have been observed at many different sites. These measurements have been
performed on ships, aircraft and fixed sampling sites dur-ing both intensive campaigns and continuous ground-based measurements. From measured size distributions one can in-fer the particle growth rate, whereas from measured number concentrations an apparent source rates of 3 nm (or 10 nm or 15 nm) particles is obtained. Globally, the formation of new particles and their subsequent growth seem to occur almost everywhere (Kulmala et al., 2004a).
Sulphuric acid is the best candidate as regards the ability of individual molecules to produce new particles in the at-mosphere (Kulmala, 2003; Kulmala et al., 2004a). It will participate in binary, ternary and ion induced nucleation. A technique for the measurement of gas phase sulphuric acid at concentrations as low as 104cm−3is available (Eisele and
Tanner, 1993). However, it is still very rare that sulphuric acid is measured in relation to atmospheric aerosol forma-tion (Kulmala et al., 2004a).
Within the framework of the EU project QUEST (Quan-tification of Aerosol Nucleation in the European Boundary layer), continuous measurements of aerosol size distributions and three intensive field campaigns in Finland (Hyyti¨al¨a), Italy (San Pietro Capofiume) and Ireland (Mace Head) were carried out. During the campaign in Hyyti¨al¨a (17 March to the 13 April 2003), besides many other parameters, sul-phuric acid concentrations were measured continuously on 21 days. Sulphuric acid is one participant of ternary nucle-ation by H2O, NH3and H2SO4(Korhonen et al., 1999), one
of the most common proposed mechanisms for atmospheric nucleation in the planetary boundary layer (Kulmala, 2003).
Although the precursors for sulphuric acid (at least some of them), as well as the condensation sink, have been mea-sured in several places, the closure between meamea-sured and calculated sulphuric acid concentrations has been investi-gated rarely (Weber et al., 1997 and Eisele et al., 1993). In this paper we calculated sulphuric acid concentrations using a pseudo steady state box model including photo stationary states (see Seinfeld and Pandis, 1998). Here we focus on a comparison between field measurements and model calcula-tions of sulphuric acid concentracalcula-tions using the data obtained in the field campaign in Hyyti¨al¨a. We also investigate the contribution of sulphuric acid to the growth rate of nucleation mode particles. Therefore, hydroxyl and hydroperoxy radi-cal concentrations were radi-calculated with the input values of different gases measured during the campaign. We focused hereby only on daytime chemistry, because no nighttimes measurements of NO3are available and second because the
formation of new particles and high growth rates appear only during daylight (Boy et al., 2003).
2 Experiment
2.1 SMEAR II
Data were collected at the Station for Measuring Forest Ecosystem-Atmosphere Relations (SMEAR II) in Hyyti¨al¨a, Finland. The station is located in Southern Finland (61◦510N, 24◦170E, 181 m a.s.l.), with extended areas of Scots Pine (Pinus sylvestris) dominated forests. The condi-tions at the site are typical for a background location. How-ever, the station buildings (0.5 km away) and the city of Tam-pere (60 km away – both located in a west-south-west direc-tion from the instruments, 215–265◦) occasionally polluted measurements.
In the framework of this work measurements of spec-tral solar irradiance, different gas concentrations (O3, H2O,
NO, NOx, CO and SO2), temperature, humidity,
wind-direction, particle number concentration and size distribution were taken into account. For a more detailed description of SMEAR II and instrumentation, we refer to Kulmala et al. (2001) and http://www.honeybee.helsinki.fi/smear/. 2.2 Gaseous sulphuric acid measurements
Sulphuric acid was measured by a chemical ionization mass spectrometer apparatus (CIMS) built by MPI-K Heidelberg. The instrument is essentially the same as the one used for measurements of atmospheric OH, HO2and RO2radicals
ex-cept for the chemical conversion parts (Hanke et al., 2002). In brief, the CIMS used in QUEST 2 consists of four ma-jor elements including an ion trap mass spectrometer, a flow reactor, an ion source, and an H2SO4-source used for
cal-ibration. Atmospheric air is passed through the flow reac-tor (at ambient atmospheric pressure). Reagent ions of the type NO3-(HNO3)n(with n being mostly 1) are produced in
the ion source and subsequently introduced into the flow re-actor. There these ions undergo ion-molecule reactions of the type NO3-(HNO3)n+H2SO4→HSO4-(HNO3)n+HNO3
whose rate coefficients are close to the ion-molecule colli-sion rate coefficients. Using the mass spectrometer the abun-dance ratio of product and reagent ions is measured. Build-ing on this ion abundance ratio the H2SO4-concentration in
the flow reactor is determined. The latter is typically only about 50% of the ambient atmospheric sulphuric acid con-centration due to H2SO4-losses to the walls of the sampling
line and the flow reactor. In order to quantify these H2SO4
-losses an H2SO4-source is used for careful calibrations. Also
carefully determined is the H2SO4-background signal of the
CIMS-instrument, which dictates the H2SO4-detection limit.
During QUEST 2 the H2SO4-detection limit was as low
as about 1×10⁵molecules cm−3corresponding to an atmo-spheric mole fraction of 4×10⁻¹⁵. The time-resolution of the sulphuric acid measurements was better than one sec-ond but usually sulphuric acid concentrations were inte-grated over 100 s to reduce the statistical error. The absolute
M. Boy et al.: Sulphuric acid closure and contribution to nucleation mode particle growth 865
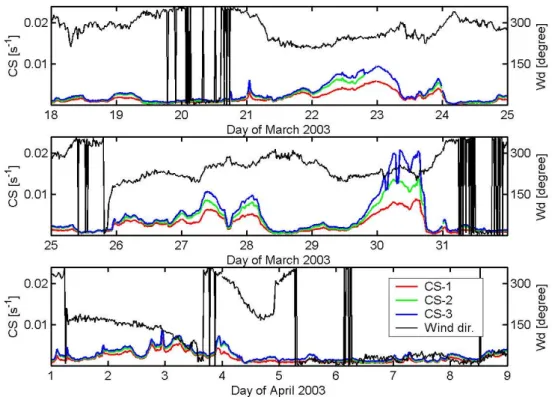
Fig. 1. Different calculated condensational sink values (explanation in Sect. 2.5) and wind-direction for Hyyti¨al¨a, Finland.
uncertainty of the measured H2SO4-concentration is plus or
minus 31%. A paper addressing in detail the CIMS used and the H2SO4-measurements made during the QUEST 2
cam-paign is in preparation (Sellegri et al., 2005). 2.3 Methane
Methane concentration was measured with a tunable diode laser trace gas analyser (TDL TGA100, Campbell Scientific Inc., USA) during the QUEST 2 campaign. The measure-ment system consisted of a TDL TGA100 and an ultrasonic 3-D anemometer (Solent 1012, Gill Ltd., Lymington, Hamp-shire, England). The sample air was drawn to the TDL at 50– 60 mbar pressure through a PD1000 drier (Perma pure Inc.) and a 10 m long sample tubing at a flow rate of 3 l min−1. The measurements were conducted at 10 Hz frequency. The TDL was calibrated once during the campaign with calibration gases containing 0.004 ppm and 1.831 ppm of CH4. Methane
measurements were conducted from 28 March to 23 April. The average CH4 concentration during the measurement
period was 1.941 ppm CH4. Variation in CH4concentration
was very small throughout the measurement period (CH4in
ppm: average=1.941, max=1.988, min=1.873). 2.4 Non-methane hydrocarbons and formaldehyde Ambient monoterpenes were sampled continuously through-out the sampling period on Tenax TA (200 mg in1/4” stainless
steel tubes, 50 Nml min−1, 120 min per sample). All
sam-pling was done through a1/2” ozone scrubber (4 plies MnO 2
coated copper screens) and a 5 cm, 0.5 mm ID Teflon tube (to limit diffusion artefacts), placed immediately in front of each sample tube. A diffusion control tube, through which no sample flow was taken, was placed alongside the sample tubes. Twenty-four hour sampling was achieved by a sys-tem of timers, solenoid valves, and mass flow control and the sample tubes changed once a day. After sampling, the tubes were stored in a cool and dry environment. Analy-sis was performed by ATD-GC-MS (Automatic thermal des-orption, gas chromatography and mass spectrometric detec-tion and quantificadetec-tion). The main monoterpenes observed were α-pinene and 13-carene, accompanied by camphene,
β-pinene, myrcene and limonene.
Formaldehyde samples were collected by drawing air through C18-cartridges (Sep-Pak, Waters) coated with DNPH (2,4-dinitrophenyl hydrazine) and analyzed using a liquid chromatograph with a mass spectrometer (LC-MS). Sampling time was 24 h and flow rate 980 ml min−1. The measurements are described in more detail by Hell´en et al. (2004).
In this work we will use only formaldehyde and monoter-penes as non-methane hydrocarbons, other NMHC’s were not measured during the campaign. In Sect. 5 we will cal-culate in sensitivity studies the influence of different values of our measured NMHC’s concerning the OH-budget.
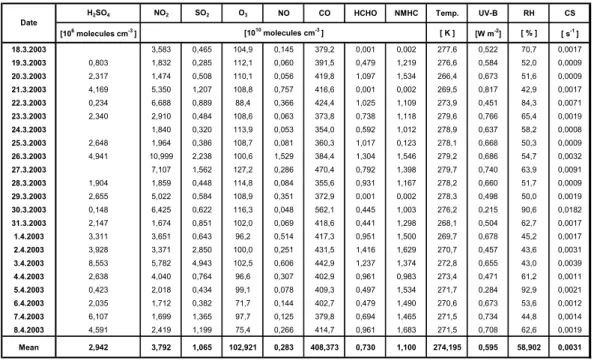
Table 1. Daytime mean values of different parameters averaged between 9 a.m. and 3 p.m. (NMHC=non-methane hydrocarbons, UV-B=solar irradiance between 280–320 nm, RH=relative humidity and CS=condensational sink values, 24-h average for HCHO).Table 1
H2SO4 NO2 SO2 O3 NO CO HCHO NMHC Temp. UV-B RH CS
1 1 2 2 2 2 2 2 2 2 2 2 3 3 [106 molecules cm-3 ] [ K ] [W m-2] [ % ] [ s-1 ] 8.3.2003 3,583 0,465 104,9 0,145 379,2 0,001 0,002 277,6 0,522 70,7 0,0017 9.3.2003 0,803 1,832 0,285 112,1 0,060 391,5 0,479 1,219 276,6 0,584 52,0 0,0009 0.3.2003 2,317 1,474 0,508 110,1 0,056 419,8 1,097 1,534 266,4 0,673 51,6 0,0009 1.3.2003 4,169 5,350 1,207 108,8 0,757 416,6 0,001 0,002 269,5 0,817 42,9 0,0017 2.3.2003 0,234 6,688 0,889 88,4 0,366 424,4 1,025 1,109 273,9 0,451 84,3 0,0071 3.3.2003 2,340 2,910 0,484 108,6 0,063 373,8 0,738 1,118 279,6 0,766 65,4 0,0019 4.3.2003 1,840 0,320 113,9 0,053 354,0 0,592 1,012 278,9 0,637 58,2 0,0008 5.3.2003 2,648 1,964 0,386 108,7 0,081 360,3 1,017 0,123 278,1 0,668 50,3 0,0009 6.3.2003 4,941 10,999 2,238 100,6 1,529 384,4 1,304 1,546 279,2 0,686 54,7 0,0032 7.3.2003 7,107 1,562 127,2 0,286 470,4 0,792 1,398 279,7 0,740 63,9 0,0091 8.3.2003 1,904 1,859 0,448 114,8 0,084 355,6 0,931 1,167 278,2 0,660 51,7 0,0009 9.3.2003 2,655 5,022 0,584 108,9 0,351 372,9 0,001 0,002 278,3 0,498 50,0 0,0019 0.3.2003 0,148 6,425 0,622 116,3 0,048 562,1 0,445 1,003 276,2 0,215 90,6 0,0182 1.3.2003 2,147 1,674 0,851 102,0 0,069 418,6 0,441 1,298 268,1 0,504 62,7 0,0017 1.4.2003 3,311 3,651 0,643 96,2 0,514 417,3 0,951 1,500 269,7 0,678 45,2 0,0017 2.4.2003 3,928 3,371 2,850 100,0 0,251 431,5 1,416 1,629 270,7 0,457 43,6 0,0031 3.4.2003 8,553 5,782 4,943 102,5 0,606 442,9 1,237 1,374 272,8 0,655 43,0 0,0039 4.4.2003 2,638 4,040 0,764 96,6 0,307 402,9 0,961 0,983 273,4 0,471 61,2 0,0011 5.4.2003 0,423 2,018 0,434 99,1 0,078 409,3 0,497 1,534 271,7 0,284 92,9 0,0021 6.4.2003 2,035 1,712 0,382 71,7 0,144 402,7 0,479 1,490 270,6 0,673 53,6 0,0012 7.4.2003 6,107 1,699 1,365 97,7 0,125 379,8 0,694 1,465 271,5 0,734 44,8 0,0014 8.4.2003 4,591 2,419 1,199 75,4 0,266 414,7 0,961 1,683 271,5 0,708 62,6 0,0019 Mean 2,942 3,792 1,065 102,921 0,283 408,373 0,730 1,100 274,195 0,595 58,902 0,0031 e [1010 molecules cm-3 ] Table 2 Nr. Reactions
j and k at 273 K and 1 bar k in [cm3 molecule-1 s-1 ] Dat 1. O3 + hν O(1 D) + O2 jO3 Max. = 1.22 * 10-5 O(1 D) + H2O 2 OH k1 2,2 * 10-10 2. HO2 + NO OH NO2 k2 9,24 * 10-12 3. HO2 + O3 OH + 2 O2 k3 1,76 * 10-15 j in [s-1] OH production terms OH loss terms
OH production and HO2 loss terms
4. OH + NO2 HNO3 k4 1,41 * 10-11
5. OH + CH4 CH3 + H2O k5 3,55 * 10-15
6. OH + CO HO2 + CO2 k6 1,50 * 10-13
7. OH + HCHO HO2 + CO + H2O k7 9,37 * 10-12
8. OH + H2 HO2 + H2O k8 3,53 * 10-15
9. OH + O3 HO2 + O2 k9 5,12 * 10-14
10. OH + NMHC RO2 + H2O k10 various
HO2 production terms
11. HCHO + hν 2 HO2 + CO jHCHO Max. = 1.23 * 10-5
12. HO2 + HO2 H2O2 + O2 k12 5,33 * 10-12
13. HO2 + RO2 ROOH + O2 k13 1,6 * 10-11
14. OH + SO2 H2SO4 k14 9,82 * 10-13
HO2 loss terms
H2SO4 production terms and OH loss term OH loss and HO2 production terms
O2
O2
M
O2
2.5 Condensational sink
The aerosol condensational sink (CS) determines how rapidly molecules will condense onto pre-existing aerosols (CS, Kulmala et al., 2001b) and can be calculated from
CS =2π D ∞ Z 0 DpβM(Dp)n(Dp)dDp=2π D Z i βMDpiNi.(1)
Dis the diffusion coefficient of sulphuric acid and the tran-sitional correction factor βM is typically calculated using the expression by Fuchs and Sutugin (1971). N is the number concentration and Dp is the diameter of the particles in the i’th size class measured with a DMPS (Differential mobil-ity particle sizer) system at dry relative humidmobil-ity (CS-1 in Fig. 1). The hygroscopic growth rate correction for particles measured in Hyyti¨al¨a at RH=90% was included according to H¨ameri et al. (2001) and further we used the growth param-eterisation from Swietlicki et al. (2000) to count for the real relative humidity (CS-2 in Fig. 1). Finally, we also included particles larger than 500 nm, measured with an APS (Aero-dynamic Particle Sizer) system and handled them in the same way as the DMPS data explained above (CS-3 in Fig. 1).
3 Observed data
In this and the following sections, we concentrate our anal-ysis on the days of the campaigns when sulphuric acid was measured (18 March until the 8 April). Figure 1 shows the
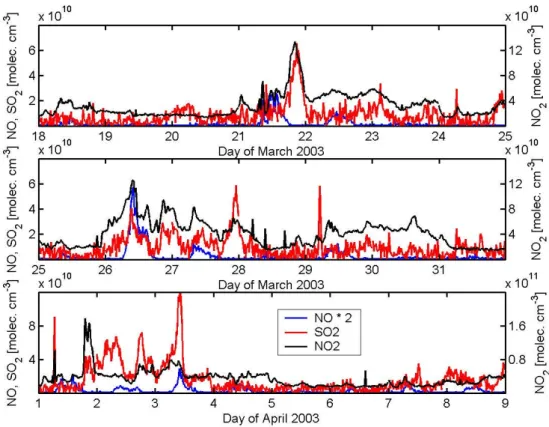
different condensational sink values discussed in the previ-ous section, as well as the wind direction. Figure 2 presents the concentrations of NO, NO2 and SO2 and Fig. 3 gives
the solar irradiance (UV-B: 280 to 320 nm) and temperature profiles. Further, Table 1 gives the daytime averages (be-tween 9 a.m. and 3 p.m.) of all these parameters includ-ing H2SO4, O3, CO, HCHO (formaldehyde, 24-h averages),
NMHC (non-methane hydrocarbon) and relative humidity for all days.
Over the whole period the average condensational sink calculated with the hygroscopicity and humidity param-eterisations, explained in Sect. 2.5, were higher than those calculated from dry particle diameters by a fac-tor of 1.35 (mean (CS-2)/mean (CS-1)). In addition, including the coarse mode particles, measured above 500 nm, raised the condensation sink by a factor of 1.17 (mean (CS-3)/mean (CS-2)). Including all corrections for the CS values led to an overall increase of the condensa-tional sink values calculated from the measured dry particle number concentrations and size distributions (DMPS-data: CS-1 in Fig. 1) to the estimated diameter of CS-3 by a factor of 1.58.
The concentrations of NO and NO2(Fig. 2 and Table 1) are
in the range of BDL (below detection limit) to 1.1 ppb (BDL – 2.9×10¹⁰molecules cm−3)and 0.45 to 8.3 ppb (1.2×10¹⁰– 2.2×10¹¹molecules cm−3), respectively. The concentra-tion of SO2 was on the order of BDL to 4.6 ppb (BDL –
1.2×10¹¹molecules cm−3). Low concentrations of all three gases (NO and SO2=BDL and NO2<1 ppb) were typical
M. Boy et al.: Sulphuric acid closure and contribution to nucleation mode particle growth 867
Fig. 2. Nitrogen oxide, nitrogen dioxide and sulphur dioxide concentrations for Hyyti¨al¨a, Finland.
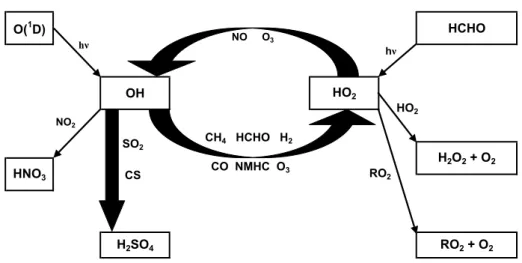
O(1D) HCHO H2O2 + O2 H2SO4 RO2 + O2 OH HO2 HNO3 hν hν RO2 NO2 SO2 CS NO O3 CH4 HCHO H2 CO NMHC O3 HO2
Fig. 4. Block diagram of the chemistry in the photo stationary state calculations. during times, when less polluted air masses originated over
the Northern Atlantic or the Polar region arrived at Hyyti¨al¨a. High CS-values are, in the majority of the days, accompa-nied by high concentrations of nitrogen oxide, nitrogen diox-ide and sulphur dioxdiox-ide. This rough classification agrees to a certain extent with the wind direction profile, which gives less polluted air masses during periods, when the wind direc-tion was north-east to north-west.
The temperature profiles and the solar UV-B irradiance are plotted in Fig. 3. On the third day (20 March) the Tdav
(day-time average temperature, see Table 1) dropped to 266.4 K, the lowest value during the campaign. The wind direction during this day was close to North and signs indicate that Po-lar or Arctic air masses passed over the station. After this day, the Tdav increased to 279.6 K and the wind direction
changed to southeast. This resulted in an increase of NO, NO2, SO2and CS. Continuing in the same manner and
in-cluding 72 h backward trajectories calculated by the HYS-PLIT model (NOAA – National Oceanic and Atmospheric Administration, Rolph, 2003) we can clearly divide 16 days of the selected period into two categories:
– Less polluted air masses originated over the Atlantic or
Polar region:
19, 20, 24, 25, 31 March, 5, 6 and 7 April.
– Higher polluted air masses passed over Central Europe
or England:
21, 22, 26, 27, 29, 30 March, 2 and 3 April
We will apply this air mass classification in Sect. 5.4 to investigate the influence of different measured parameters on the radical balance and sulphuric acid concentration.
4 Pseudo steady state model
In order to calculate the concentrations of sulphuric acid we used a simple zero-dimensional box model (Fig. 4). The in-tention was not to run a full-scale model with the complete
organic and inorganic chemistry, but rather to check the con-sistency of our model with measured sulphuric acid concen-tration values. With the limited number of compounds mea-sured in the present study, a full model including biogenic VOC chemistry would result in substantial uncertainties with respect to the calculated concentrations. Photo stationary state conditions were assumed for each of the radical species, i.e. both OH and HO2were assumed sufficiently short-lived
that they remain in steady state with the ambient conditions. The model can be called as pseudo steady state model (see Seinfeld and Pandis, 1998). This gives us the balance equa-tions for the radicals:
d[C]
dt ≈0 = PC−LC. (2)
Here PC represents the total production rate for C, and LC is the corresponding loss rate. The balance equations for both radicals can now be solved by using the measured con-centrations of the other species as input parameters. We used a typically northern hemisphere value of 500 ppb for H2 and for methane an average value of 1.941 ppm (see
Sect. 2.3). The [HO2]/([HO2]+6 [RO2]) ratio is typically
0.5–0.8 (Cantrell et al., 1996, 1997). Recent studies by Carslaw et al. (2002) during the Eastern Atlantic Spring Ex-periment 1997 (EASE97) at Mace Head, Ireland measured lower values of 0.18–0.4. In our analysis, we decided to use a mean value from the published data, which is 0.5 and gives [HO2]=[RO2]. However, in sensitivity studies in Sect. 5.2 we
will change this parameter to investigate its influence on the radical budgets. All reactions and rate coefficients included in the radical balance calculations and the calculation for sul-phuric acid concentration are listed in Table 2.
The used balance equation for calculating the OH radical concentrations with the k-values from Table 2 is
OH=POH LOH
POH=2 ∗ [O3] ∗ jO3∗[H2O] ∗ k1+[HO2] ∗ [NO] ∗ k2+
M. Boy et al.: Sulphuric acid closure and contribution to nucleation mode particle growth 869
Table 2. Reactions and rate coefficients used in the photo stationary calculations of the radical concentrations. All rate coefficients have been calculated for a relevant average temperature of 273 K using the temperature dependent rate equations from Atkinson et al. (2001) and Seinfeld and Pandis (1998).
Table 1
H2SO4 NO2 SO2 O3 NO CO HCHO NMHC Temp. UV-B RH CS
1 1 2 2 2 2 2 2 2 2 2 2 3 3 [106 molecules cm-3 ] [ K ] [W m-2] [ % ] [ s-1 ] 8.3.2003 3,583 0,465 104,9 0,145 379,2 0,001 0,002 277,6 0,522 70,7 0,0017 9.3.2003 0,803 1,832 0,285 112,1 0,060 391,5 0,479 1,219 276,6 0,584 52,0 0,0009 0.3.2003 2,317 1,474 0,508 110,1 0,056 419,8 1,097 1,534 266,4 0,673 51,6 0,0009 1.3.2003 4,169 5,350 1,207 108,8 0,757 416,6 0,001 0,002 269,5 0,817 42,9 0,0017 2.3.2003 0,234 6,688 0,889 88,4 0,366 424,4 1,025 1,109 273,9 0,451 84,3 0,0071 3.3.2003 2,340 2,910 0,484 108,6 0,063 373,8 0,738 1,118 279,6 0,766 65,4 0,0019 4.3.2003 1,840 0,320 113,9 0,053 354,0 0,592 1,012 278,9 0,637 58,2 0,0008 5.3.2003 2,648 1,964 0,386 108,7 0,081 360,3 1,017 0,123 278,1 0,668 50,3 0,0009 6.3.2003 4,941 10,999 2,238 100,6 1,529 384,4 1,304 1,546 279,2 0,686 54,7 0,0032 7.3.2003 7,107 1,562 127,2 0,286 470,4 0,792 1,398 279,7 0,740 63,9 0,0091 8.3.2003 1,904 1,859 0,448 114,8 0,084 355,6 0,931 1,167 278,2 0,660 51,7 0,0009 9.3.2003 2,655 5,022 0,584 108,9 0,351 372,9 0,001 0,002 278,3 0,498 50,0 0,0019 0.3.2003 0,148 6,425 0,622 116,3 0,048 562,1 0,445 1,003 276,2 0,215 90,6 0,0182 1.3.2003 2,147 1,674 0,851 102,0 0,069 418,6 0,441 1,298 268,1 0,504 62,7 0,0017 1.4.2003 3,311 3,651 0,643 96,2 0,514 417,3 0,951 1,500 269,7 0,678 45,2 0,0017 2.4.2003 3,928 3,371 2,850 100,0 0,251 431,5 1,416 1,629 270,7 0,457 43,6 0,0031 3.4.2003 8,553 5,782 4,943 102,5 0,606 442,9 1,237 1,374 272,8 0,655 43,0 0,0039 4.4.2003 2,638 4,040 0,764 96,6 0,307 402,9 0,961 0,983 273,4 0,471 61,2 0,0011 5.4.2003 0,423 2,018 0,434 99,1 0,078 409,3 0,497 1,534 271,7 0,284 92,9 0,0021 6.4.2003 2,035 1,712 0,382 71,7 0,144 402,7 0,479 1,490 270,6 0,673 53,6 0,0012 7.4.2003 6,107 1,699 1,365 97,7 0,125 379,8 0,694 1,465 271,5 0,734 44,8 0,0014 8.4.2003 4,591 2,419 1,199 75,4 0,266 414,7 0,961 1,683 271,5 0,708 62,6 0,0019 Mean 2,942 3,792 1,065 102,921 0,283 408,373 0,730 1,100 274,195 0,595 58,902 0,0031 e [1010 molecules cm-3 ]
Table 2
Nr. Reactionsj and k at 273 K and 1 bar k in [cm3 molecule-1 s-1] Dat 1. O3 + hν O(1D) + O2 jO3 Max. = 1.22 * 10-5 O(1D) + H 2O 2 OH k1 2,2 * 10-10 2. HO2 + NO OH NO2 k2 9,24 * 10-12 3. HO2 + O3 OH + 2 O2 k3 1,76 * 10-15 j in [s-1] OH production terms OH loss terms
OH production and HO2 loss terms
4. OH + NO2 HNO3 k4 1,41 * 10-11 5. OH + CH4 CH3 + H2O k5 3,55 * 10-15 6. OH + CO HO2 + CO2 k6 1,50 * 10-13 7. OH + HCHO HO2 + CO + H2O k7 9,37 * 10-12 8. OH + H2 HO2 + H2O k8 3,53 * 10-15 9. OH + O3 HO2 + O2 k9 5,12 * 10-14 10. OH + NMHC RO2 + H2O k10 various HO2 production terms
11. HCHO + hν 2 HO2 + CO jHCHO Max. = 1.23 * 10-5
12. HO2 + HO2 H2O2 + O2 k12 5,33 * 10-12
13. HO2 + RO2 ROOH + O2 k13 1,6 * 10-11
14. OH + SO2 H2SO4 k14 9,82 * 10-13
HO2 loss terms
H2SO4 production terms and OH loss term
OH loss and HO2 production terms
O2 O2 M O2 LOH= [NO2] ∗ k4+[CH4] ∗ k5+[CO] ∗ k6+ [HCHO] ∗ k7+[H2] ∗ k8+[O3] ∗ k9+ [NMHC] ∗ k10+[SO2] ∗ k14 (3)
In the same way, the HO2radical concentrations were
deter-mined. In order to solve the two coupled equations we used for each time step 10 iterations. With the achieved hydroxyl concentrations and the CS-values we further estimated the concentrations of sulphuric acid.
The photolysis rates (jO3) for ozone were calculated
by using spectral irradiance data measured by a radio-spectrometer. A detailed description of the theory and the instrument is given in Boy and Kulmala (2002a). In the same way, we calculated the photolysis rate for formalde-hyde by using the absorption cross sections and quantum yields from DeMore et al. (1994). Concerning the uncer-tainties of the photolysis rates, it is worth to mention that the radio-spectrometer is placed about 0.5 km away from the measuring station SMEAR II. During periods with high
frac-tion of cumulus clouds, this could result in significant tem-poral differences in measured and photochemical active radi-ation at the stradi-ation.
5 Results and discussion
The results were divided into four parts. In the first section, we will discuss the calculation of the hydroxyl and hydroper-oxy radicals and the fraction of the sinks and sources of these species. The next sub-section will give a comparison be-tween the measured and calculated sulphuric acid concen-trations and show the closure. Also sensitivity studies of the influence of some key parameters were performed. In the following sub-section we determine the contribution of the sulphuric acid molecules to the particle growth rates. In the end of this section, we use the air mass classification given in Sect. 3 and point out the differences of some variables.
Fig. 5. Calculated hydroxyl and hydroperoxy radical concentrations for Hyyti¨al¨a, Finland.
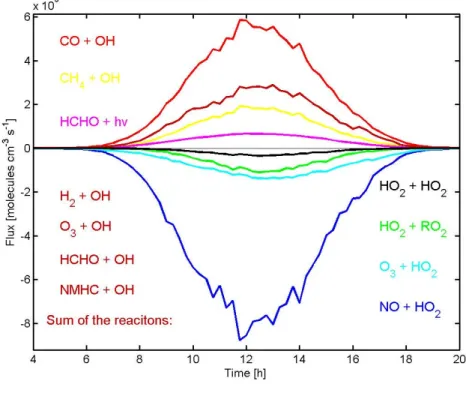
Fig. 6. Plot of calculated contributions of various sink and source terms for the hydroxyl radical concentration averaged for 15-min time intervals between the 18 March and the 8 April 2003.
M. Boy et al.: Sulphuric acid closure and contribution to nucleation mode particle growth 871
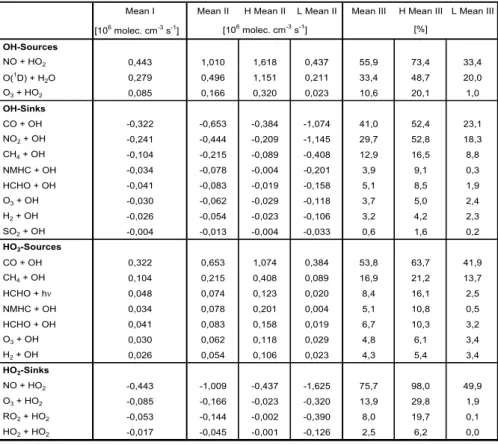
Table 3. Average sink and source terms of the OH and HO2radical balance for the 18 March until the 8 April 2003 (Mean I=average
for all days between 8 a.m. and 4 p.m.; Mean II=average daily maxims with H and L are the highest and lowest values; Mean III=average contributions of the single reactions to the corresponding source and loss terms of one radical with H and L are the highest and lowest values).Table 3
Mean I Mean II H Mean II L Mean II Mean III H Mean III L Mean III
NO O(1 O3 CO NO2 CH4 NMH HCH O3 H2 SO2 HO2 CO CH4 HCH NMH HCH O3 H2 HO2 NO O3 RO2 HO2 [106 molec. cm-3 s-1] Sources + HO2 0,443 1,010 1,618 0,437 55,9 73,4 33,4 D) + H2O 0,279 0,496 1,151 0,211 33,4 48,7 20,0 + HO2 0,085 0,166 0,320 0,023 10,6 20,1 1,0 Sinks + OH -0,322 -0,653 -0,384 -1,074 41,0 52,4 23,1 + OH -0,241 -0,444 -0,209 -1,145 29,7 52,8 18,3 + OH -0,104 -0,215 -0,089 -0,408 12,9 16,5 8,8 C + OH -0,034 -0,078 -0,004 -0,201 3,9 9,1 0,3 O + OH -0,041 -0,083 -0,019 -0,158 5,1 8,5 1,9 + OH -0,030 -0,062 -0,029 -0,118 3,7 5,0 2,4 + OH -0,026 -0,054 -0,023 -0,106 3,2 4,2 2,3 + OH -0,004 -0,013 -0,004 -0,033 0,6 1,6 0,2 -Sources + OH 0,322 0,653 1,074 0,384 53,8 63,7 41,9 + OH 0,104 0,215 0,408 0,089 16,9 21,2 13,7 O + hν 0,048 0,074 0,123 0,020 8,4 16,1 2,5 C + OH 0,034 0,078 0,201 0,004 5,1 10,8 0,5 O + OH 0,041 0,083 0,158 0,019 6,7 10,3 3,2 + OH 0,030 0,062 0,118 0,029 4,8 6,1 3,4 + OH 0,026 0,054 0,106 0,023 4,3 5,4 3,4 -Sinks + HO2 -0,443 -1,009 -0,437 -1,625 75,7 98,0 49,9 + HO2 -0,085 -0,166 -0,023 -0,320 13,9 29,8 1,9 + HO2 -0,053 -0,144 -0,002 -0,390 8,0 19,7 0,1 + HO2 -0,017 -0,045 -0,001 -0,126 2,5 6,2 0,0 [%] [106 molec. cm-3 s-1] Table 4 Scenario RO NO SC-1 SC-2 SC-3 SC-5 SC-6 SC-7 SC-8 NO
NMHC 2 2 M-Ratio S-Ratio GAP
M = [HO2] M 1,16 0,636 13,8 2 * M = [HO2] M 1,17 0,635 14,5 4 * M = [HO2] M 1,19 0,635 16,0 M = 2 * [HO2] M 1,22 0,623 18,0 M = 4 * [HO2] M 1,27 0,631 21,3 M = [HO2] NO2-SC I 1,07 0,522 6,5 M = [HO2] NO2-SC II 0,98 0,412 -2,0 2 * M = [HO2] NO2-SC II 0,99 0,412 -1,0 NO2 > 1,5 ppb → NO2 = NO2 * 0,9 NO2 > 2 ppb → NO2 = NO2 * 0,8 NO2 > 1,5 ppb → NO2 = NO2 * 0,8 NO2 > 2 ppb → NO2 = NO2 * 0,6 red values SC-4 2-SC II: NO2-SC I: M = Measu 5.1 OH and HO2concentrations
Figure 5 gives the calculated hydroxyl and hydroperoxy radical concentrations for the selected period. The daily maxima for the OH and the HO2 species are in the range
of 4.1×10⁵ to 1.8×10⁶molecules cm−3 and 1.0×10⁷ to 1.5×10⁸molecules cm−3, respectively. The calculated val-ues are in agreement with earlier model calculations for the same site (SMEAR II) by Hakola et al. (2003). Figures 6 and 7 show the diurnal contributions of the different sink and source terms for both radicals, averaged for the selected days and Table 3 gives some statistical parameters concern-ing these calculations. The nomenclature of sink and source terms in this context is somehow controversial, although of-ten used in the literature. However, during this work we will retain the terms and point out that different opinions concern-ing the use of sink and source terms in this context exist.
Concerning the daytime averages of the whole period more than 55% of the OH production results from the reac-tion of hydroperoxy radicals with nitrogen oxide and around one third is produced by the photolysis of ozone and the fol-lowing reaction of the exited oxygen molecules with water vapour. The reaction of ozone with HO2 contributes only
10% to the OH concentration. However, during single days
like for example the 23 March with high values of solar irra-diance (see Fig. 3) and low concentrations of NO (see Fig. 2) the photolysis of ozone contributes close to half of the hy-droxyl radical concentration. During the 21 days, the Reac-tions 1 to 3 of Table 2 participate in the OH-formation with 20–49%, 33–73% and 1–20%, respectively.
For the various sink terms of the OH radicals (Reactions 4–10 and 14 of Table 2) the dominating ones with over 83% concerning the daytime averages are the three reaction of OH radicals with CO (≈41%), NO2 (≈30%) and CH4(≈13%).
All the other reactions contribute together less than 17% to the decrease of the hydroxyl concentration. Worth mention-ing is that the reaction of the non-methane hydrocarbons with the OH radicals can reach up to 9.1% on single days. How-ever, comparing this result with earlier publications (Carslaw et al., 2002 and Handisides et al., 2003) the fraction of the NMHC in the OH-balance in our calculations is low. The rea-son for underestimating the influence of the NMHC comes from the fact, that monoterpenens and formaldehyde were the only non-methane hydrocarbons measured during the QUEST campaign. We will consider this in the next sub-section and use different values for the NMHCs in sensitivity studies.
Table 4. Sensitivity study of the calculated sulphuric acid con-centrations in comparison with the measured ones (M-Ratio=Mean value of the daily (9 a.m.–3 p.m.) averaged ratios between mea-surements and calculations, S-Ratio=standard deviation of these values and GAP=the difference in percent between measured and calculated concentrations). Highlighted fields are the parameters changed for investigation.
Scenario NMHC RO2 NO2 M-Ratio S-Ratio GAP
SC-1 M = [HO2] M 1.16 0.636 16 SC-2 2 * M = [HO2] M 1.17 0.635 17 SC-3 4 * M = [HO2] M 1.19 0.635 19 SC-4a M = 0,25 * [HO2] M 1.10 0.645 10 SC-4b M = 0,5 * [HO2] M 1.12 0.641 12 SC-5a M = 2 * [HO2] M 1.22 0.623 22 SC-5b M = 4 * [HO2] M 1.27 0.631 27 SC-6 M = [HO2] NO2-SC I 1.07 0.522 7 SC-7 M = [HO2] NO2-SC II 0.98 0.412 -2 SC-8 2 * M = [HO2] NO2-SC II 0.99 0.412 -1 NO2 > 1,5 ppb → NO2 = NO2 * 0.90 NO2 > 2 ppb → NO2 = NO2 * 0.80 NO2 > 1,5 ppb → NO2 = NO2 * 0.80 NO2 > 2 ppb → NO2 = NO2 * 0.60 NO2-SC II: NO2-SC I: M = Measured values
In the same way as above we calculated the contributions of the single reactions to the production (Reactions 6–11 Ta-ble 2) and loss (Reactions 2, 3, 12 and 13 of TaTa-ble 2) of the hydroperoxy radicals. The HO2production comes in
aver-age with more than 53% through the reaction of OH with CO. All other reactions play a minor role here, contributing between 4 to 17%. The loss terms for this radical are even more strongly dominated by one term, which is the reaction of NO with HO2(average=75%). During single days, this
term contributes up to 98% to the decrease of the hydroper-oxy concentrations.
5.2 H2SO4concentrations
In this section, we calculate sulphuric acid concentrations us-ing the condensational sink values (see Sect. 2) and perform sensitivity studies for several parameters to investigate the in-fluence of certain variables. Table 4 gives the selected values for three different variables (NMHC, RO2and NO2)and the
means and standard deviations of the ratios (9 a.m. to 3 p.m.) between measured and calculated sulphuric acid concentra-tions. We also investigate the closure between measured and calculated values. The overall goal of these sensitivity stud-ies are not to modify data to reach the best fit with the mea-sured sulphuric acid concentration, but to investigate the pos-sible uncertainties and the resulting effects of different rele-vant parameters.
The concentrations of the non-methane hydrocarbons con-sist in this work only of measurements from monoterpenes.
Isoprene and other NMHC’s were not measured during the campaign. However, from exploratory measurements made at Hyyti¨al¨a in April, 1999 (Janson, unpublished data) as well as from EMEP VOC data (e.g. EMEP/CCC Report 7/2001), we would expect reactive alkene concentrations, such as ethene, propene, and butene, to be on the order of tens to hundreds of ppts, and less reactive aromatics, like benzene and toluene, to be a few hundred ppts and tens to a hundred ppts, respectively, depending greatly on the air mass trajec-tory. The natural sources for isoprene, in the Nordic coun-tries, are Norway spruce and Sphagnum moss in wetlands. However, the emission of isoprene from these sources, es-pecially from wetlands, should be very low at this time of year (Janson and De Serves, 1998). Therefore, we would expect our NMHC concentrations to be on the order of a fac-tor 2 too low. We used twice and four times higher values from the monoterpenes to investigate the behaviour of differ-ent NMHC-values on the OH-budget and so on the sulphuric acid concentration. The results presented in Table 4 under scenario 1 (SC-1) indicate that the mean measured sulphuric acid concentrations are 16% higher than the calculated ones. Increasing the concentrations of the non-methane hydrocar-bons by factors of 2 and 4 (SC-2 and SC-3, Table 4) increased the gap between measured and calculated H2SO4
concen-trations from 16 to 17 and 19%, respectively (=decrease of our calculated H2SO4concentrations compared to measured
ones by 1 and 3%). The reason is simple to understand. A larger NMHC load increases the competition for the OH rad-ical and thereby decreases the rate of reaction for SO2.
Peroxy radicals are the sum of HO2and RO2. The
concen-trations of the first one were calculated using our model (see Sect. 3). The relation of RO2to HO2was discussed in Sect. 4
and now we used different values for this ratio. Using half or quarter values of RO2compared to HO2increased the
cal-culated sulphuric acid concentrations by 4 and 6%, respec-tively (SC 4a and b, Table 4). A decline of 6 and 11% was achieved by doubling and quadrupling the fraction of RO2
compared to HO2(SC 5a and b, Table 4). The peroxy radical
contributes on single days up to 20% to the sink terms of the hydroperoxy radicals and decreases thereby significantly the sources for OH. However, the RO2concentrations are maybe
overestimated since the reaction of this radical with NO is neglected and its reaction rates can be much higher than the HO2-RO2rates under certain conditions, which leads to an
important decrease of the RO2concentrations. For this
rea-son we will use the ratio of [HO2]=[RO2] during the rest of
this manuscript.
As a last variable we investigated the effect of NO2
con-centration. The chemiluminescence analyzer used for de-tecting NO and NOx was not NO2 specific. Its catalytic
converter used to measure NO2 after reduction to NO
re-duces also other oxidized nitrogen species. Therefore the NO2 concentration readings (obtained as the calculated
dif-ference between the measured NO and NOxconcentrations)
M. Boy et al.: Sulphuric acid closure and contribution to nucleation mode particle growth 873
Fig. 7. Same as Fig. 6 for the hydroperoxy radical.
organic nitrates. Especially during the time when the wind transported higher polluted air masses from the South to Hyyti¨al¨a the NO2 mixing ratios increased up to 5 ppb and
higher. However, no measurements concerning the real ni-trogen dioxide fraction exist, and for this reason, we selected during times with high NO2concentrations two different
sce-narios (NO2-SC I and II, Table 4). The result of these
sen-sitivity studies (SC 6 and 7, Table 4) demonstrates the high effect from the nitrogen dioxide concentration. A decrease of 20% for NO2>1.5 ppb and 40% for NO2>2 ppb increases
our calculated sulphuric acid concentrations compared to the measured ones by 18%. We selected a high limit decrease of nitrogen dioxide because of an increased emission of PANs during periods the air masses originated from industrialised areas. The atmospheric lifetime of the PAN-molecules in the temperature range 273–298 K lies between 0.5 and 8 h (Sein-feld and Pandis, 1998).
In SC 8 we combined the results by including modified values from two discussed parameters (NMHC were multi-plied by a factor of 2 and NO2 were modified by scenario
NO2-SC II, see Table 4). The ratio between measurements
and calculations reached now a value close to unity and the standard deviation decreased to 0.412. The results indicate that the selected assumptions produce the best agreement compared with the measured H2SO4 concentrations.
Fig-ure 8 shows the measFig-ured and calculated (SC 8, Table 4) sulphuric acid concentrations from the 18 March until the 8 April. The mean daytime (6 a.m. to 6 p.m.) correlation co-efficient between the two curves (measured and calculated – by SC 8 – H2SO4)is 0.645 with a standard deviation of 0.23.
The maximum midday sulphuric acid concentrations varied between 3×10⁵to 1.9×10⁷molecules cm−3for the
measure-ments and 3×10⁵to 1.4×10⁷molecules cm−3for the
calcu-lations, respectively. Some peaks of H2SO4 in the evening
(e.g. 24, 27, 28 March and 2 April) were not produced in our calculations. However, as mentioned already in Sect. 1 we exclude night time chemistry in this work and therefore our photo stationary model cannot calculate any OH concen-trations after sunset. On some days (e.g. 25 or 28) the cal-culated sulphuric acid concentrations exceeds the measured ones clearly (factor between 2–4). These days are also the days with the lowest condensation sink values. One explana-tion might be the fact that during times with low CS-values air masses mostly originated over the Atlantic or Polar region containing high amounts of sea-salt aerosols. These aerosols normally are more hygroscopic compared to particles orig-inated from industrialised regions, like Central Europe or England and so our hygroscopic growth factors would be too small. In the next two sub-sections we will use calculated sulphuric acid concentrations achieved by using the settings of scenario 8 (see Table 4).
According to our results and sensitivity analysis, we can see that the sulphuric acid concentrations can be estimated reasonably. The calculated results are typically within 20(%) of the measured values and almost always within 50(%) from
each other. However, there are cases where the error is po-tentially much larger. As an overall error estimation we can consider errors related to sinks and sources of sulphuric acid. The source is related to OH concentration times sulphur dioxide concentration. The error related to OH concentration is probably within the range of 0.5–2.0 times the real value (see Table 3), and the error related to SO2concentration is
within 5%. The sink term is actually the condensation sink. In our analysis we have used accommmodation coefficient of unity, and the other sources of error is related to determi-nation of ambient aerosol size distribution. This will cause uncertainty of 20%. Altogether the maximum error in sul-phuric acid concentration is in the range of 0.4–2.5 times the actual concentration.
5.3 Particle growth rates
With the sulphuric acid concentrations (CH2SO4), we can now
calculate the particle diameter growth rates in the nucleation mode between 3 and 25 nm (Kulmala et al., 2001b) by
dDp
dt =
mH2SO4·βm·DH2SO4·CH2SO4
Dp·ρH2SO4
. (4)
Here mH2SO4is the molecular mass, ρH2SO4 is the liquid
den-sity and DH2SO4is the diffusion coefficient of sulphuric acid.
βm is the transitional correction factor for the mass fluxes (Fuchs and Sutugin, 1971) and Dp is the particle diameter. Equation (4) can be integrated from Dpoto Dpto obtain:
CH2SO4 = ρH2SO4 D2p−Dpo2 8 + " 4 3α −0.623 # ·λ ·0.5 · (Dp−Dpo)+ 0.623 · λ2·ln λ + Dp λ + Dpo ! /1H2SO4 ·mH2SO4. (5)
Here, α is accommodation coefficient (i.e. sticking probabil-ity, a value of one were used for all particles and conditions in this work), λ is the mean free path of the sulphuric acid molecules and 1t is the time step.
Table 5 gives the growth rates based on particle number size distributions from DMPS-measurements and the growth rates determined with Eq. (4) from measured and calcu-lated sulphuric acid concentrations for all days, when high amounts of small particles above 3 nm were visible on the DMPS-plots (particle formation periods). The growth rates from the DMPS data plots were estimated visually. Due to the somewhat inaccurate nature of this method, an uncer-tainty by a factor of two has to be taken into account.
Boy et al. (2003) estimated a growth rate fraction for sul-phuric acid of 4–31% by analysing two years of data from the field station in Hyyti¨al¨a, Finland. Both growth rate fractions determined with the measured and calculated sulphuric acid concentrations are in the lower range of this earlier estima-tions (dDp/dtaverage=8.8%). The result indicate, that the
M. Boy et al.: Sulphuric acid closure and contribution to nucleation mode particle growth 875
Table 5. Particle growth rates for several days during the campaign achieved by: DMPS=based on measured particle number concentration with size distribution; [H2SO4-M]=based on measured sulphuric acid concentrations and [H2SO4-C]=based on calculated sulphuric acid
concentration. The later ones are calculated through Eq. (3). Air mass classification: P=“polluted days” and C=“clean days” (see Sect. 3).
Table 5
Air mass GR Measurements Calculations GR(H2SO4-M) GR(H2SO4-C)
classi- DMPS [H2SO4] GR(H2SO4-M) [H2SO4] GR(H2SO4-C) / GR(DMPS) / GR(DMPS)
fication [nm h-1 ] [mol. cm-3] [nm h-1 ] [mol. cm-3] [nm h-1 ] [%] [%]
19.3.2003 C 1,0 7,18E+05 0,06 1,23E+06 0,10 6,1 10,5 20.3.2003 C 1,5 1,82E+06 0,15 2,26E+06 0,19 10,2 12,6 21.3.2003 P 2,6 2,81E+06 0,24 2,62E+06 0,22 9,1 8,5 25.3.2003 C 2,5 1,78E+06 0,15 2,29E+06 0,20 6,1 7,8 26.3.2003 P 3,6 3,62E+06 0,31 3,20E+06 0,28 8,6 7,6 29.3.2003 P 3,6 2,03E+06 0,17 1,34E+06 0,12 4,8 3,2 31.3.2003 C 3,5 2,77E+06 0,23 2,70E+06 0,23 6,7 6,5 2.4.2003 P 2,4 4,79E+06 0,40 3,05E+06 0,26 16,9 10,7 3.4.2003 P 3,8 3,28E+06 0,28 1,88E+06 0,16 7,3 4,2 6.4.2003 C 1,8 1,86E+06 0,16 1,72E+06 0,15 8,7 8,1 7.4.2003 C 2,9 4,62E+06 0,39 5,15E+06 0,44 13,5 15,0
Average 2,7 2,74E+06 0,2 2,50E+06 0,2 8,9 8,6
Date
Table 6
Clean air Polluted
masses air masses
Gas concentrations
CO molec. cm-3 3,93E+12 4,09E+12
O3 molec. cm-3 1,00E+12 1,09E+12
NO2-SC-II molec. cm-3 1,72E+10 4,16E+10
SO2 molec. cm-3 6,07E+09 1,74E+10
NMHC molec. cm-3 6,37E+08 2,91E+09
NO molec. cm-3 7,91E+08 4,68E+09
Radical concentrations
OH molec. cm-3 5,13E+05 4,64E+05
HO2 molec. cm-3 5,79E+07 1,89E+07
Condensational sink
CS-SC II s-1 1,10E-03 2,90E-03
Sulfuric acid concentration
Calculated molec. cm-3 2,56E+06 2,42E+06
Measured molec. cm-3 2,26E+06 3,31E+06
Growth rates GR [H2SO4-M] nm h-1 0,19 0,28 GR [H2SO4-C] nm h-1 0,22 0,21 GR [DMPS] nm h-1 2,20 3,20 GR [H2SO4-M] / GR [DMPS] % 8,68 8,78 GR [H2SO4-C] / GR [DMPS] % 9,84 6,43 Parmaters Unit
during particle formation periods to participate in the growth process of the aerosols and can reach on certain days frac-tions up to 17% and most probably higher.
5.4 Air mass influences
In the last sub-section we will use the air mass classification discussed in Sect. 3 and investigate the trend of certain pa-rameters under different aerosol loads. Hereby we will only use these days from the classification from Sect. 3 where particle formation occurred (see Table 5). Table 6 present the event-time (particle formation periods) averages for sev-eral gases, the condensational sink and the growth rates as mean values during the “clean” and “polluted” air mass peri-ods. The high anthropogenic influence during the more pol-luted days was reflected in two to six times higher concentra-tions of SO2, NO2and NO. Traffic, industry and households
mostly emitted these species. Ozone and carbon monoxide are approximately in the same range in both air mass classes. Mainly the combination of six times lower NO concentra-tions – main source term of the OH radicals – and three times lower NO2concentrations – beside CO, the second important
sink term of the OH radicals – led to a nearly equal con-centration of hydroxyl radicals in “clean” and “polluted” air masses. Carslaw et al. (2002) presented measured OH and HO2 concentrations at Mace Head, Ireland for air masses
originated from France, UK and Polar regions. Their results agree with ours in that the hydroxyl radical concentrations in all air masses are about equal and that the hydroperoxy radical concentrations are approximately double during the periods the air originated from the Northern regions.
Concerning the “clean” and “polluted” air masses, 2.6 times lower CS values during the times when the air
orig-inated over the Atlantic or the Polar region was detected, which reflects the higher load of aerosols during days when the air masses are originated from more industrialised re-gions. The difference of this parameter combined with three times higher concentrations of sulphur dioxide dur-ing more polluted periods resulted in about equal sulphuric acid concentrations in our calculations; the measured H2SO4
concentrations led to a slightly higher ratio (“polluted”-H2SO4/”clean”-H2SO4=1.46). The difference of 46% in the
H2SO4 concentrations between the calculations and
mea-surements could result from different compositions of the aerosols and consequently different hygroscopic growth fac-tors. Especially during the “polluted” periods, high amounts of soot particles with growth factors close to unity are ac-companied. The effect of such low hygroscopicity aerosols results in lower CS-values, and consequently, in higher sul-phuric acid concentrations.
Concerning the growth rates of particles, a 1.5 times higher value was determined with measured aerosol number size distributions during days when the air originated from Central Europe or UK. The fact that clear particle formation events occur more often during days with less aerosol load was pointed out in many publications like e.g. Boy and Kul-mala (2002b) or Clement et al. (2001). However, the nearly identical contribution of sulphuric acid to the particle growth during the “polluted” periods compared to the “clean” days is unexpected. These results indicate that sulphuric acid al-ways participated during the time of the campaign between 3 to 17% in the aerosol condensation growth of the nucleation mode particles.
876 M. Boy et al.: Sulphuric acid closure and contribution to nucleation mode particle growth
Table 6. Certain measured and calculated parameters divided by air mass classification discussed in Sect. 3 (NO2-SC II and CS-SC II see
Table 4; GR classes see Table 5).
Air mass GR Measurements Calculations GR(H2SO4-M) GR(H2SO4-C)
classi- DMPS [H2SO4] GR(H2SO4-M) [H2SO4] GR(H2SO4-C) / GR(DMPS) / GR(DMPS)
fication [nm h-1 ] [mol. cm-3] [nm h-1 ] [mol. cm-3] [nm h-1 ] [%] [%]
19.3.2003 C 1,0 7,18E+05 0,06 1,23E+06 0,10 6,1 10,5 20.3.2003 C 1,5 1,82E+06 0,15 2,26E+06 0,19 10,2 12,6 21.3.2003 P 2,6 2,81E+06 0,24 2,62E+06 0,22 9,1 8,5 25.3.2003 C 2,5 1,78E+06 0,15 2,29E+06 0,20 6,1 7,8 26.3.2003 P 3,6 3,62E+06 0,31 3,20E+06 0,28 8,6 7,6 29.3.2003 P 3,6 2,03E+06 0,17 1,34E+06 0,12 4,8 3,2 31.3.2003 C 3,5 2,77E+06 0,23 2,70E+06 0,23 6,7 6,5 2.4.2003 P 2,4 4,79E+06 0,40 3,05E+06 0,26 16,9 10,7 3.4.2003 P 3,8 3,28E+06 0,28 1,88E+06 0,16 7,3 4,2 6.4.2003 C 1,8 1,86E+06 0,16 1,72E+06 0,15 8,7 8,1 7.4.2003 C 2,9 4,62E+06 0,39 5,15E+06 0,44 13,5 15,0
Average 2,7 2,74E+06 0,2 2,50E+06 0,2 8,9 8,6
Date
Table 6
Clean air Polluted masses air masses Gas concentrations
CO molec. cm-3 3,93E+12 4,09E+12
O3 molec. cm-3 1,00E+12 1,09E+12
NO2-SC-II molec. cm-3 1,72E+10 4,16E+10
SO2 molec. cm-3 6,07E+09 1,74E+10
NMHC molec. cm-3 6,37E+08 2,91E+09
NO molec. cm-3 7,91E+08 4,68E+09
Radical concentrations
OH molec. cm-3 5,13E+05 4,64E+05
HO2 molec. cm-3 5,79E+07 1,89E+07
Condensational sink
CS-SC II s-1 1,10E-03 2,90E-03
Sulfuric acid concentration
Calculated molec. cm-3 2,56E+06 2,42E+06
Measured molec. cm-3 2,26E+06 3,31E+06
Growth rates GR [H2SO4-M] nm h-1 0,19 0,28 GR [H2SO4-C] nm h-1 0,22 0,21 GR [DMPS] nm h-1 2,20 3,20 GR [H2SO4-M] / GR [DMPS] % 8,68 8,78 GR [H2SO4-C] / GR [DMPS] % 9,84 6,43 Parmaters Unit
6 Summary and conclusions
In this work, we used measurements from the QUEST field campaign conducted in Hyyti¨al¨a during March and April 2003. Among many other parameters, sulphuric acid was measured continuously on 21 days. We concentrated our analyses on daytimes (9 a.m.–3 p.m.) during this period. The measured concentrations were compared with calculated ones, achieved by a simple pseudo steady state box model including photo stationary states. Further, we estimated the particle growth rates for the nucleation mode aerosols deter-mined by measured particle number concentrations with size distributions and from the concentrations of sulphuric acid. In the end, we classified the days with air masses originated from Europe or UK and from the Atlantic or Polar region to investigate the influence of several variables on the OH and H2SO4concentrations and on the particle growth rates.
As a first result we presented the importance of the various sink and source terms in the OH and HO2radical balance as
mean values for the selected time. Nitrogen oxide was the dominant source term (mean contribution=55.9%) and car-bon monoxide the key sink term (mean contribution=41%)
in the hydroxyl radical balance. The same two components play also the major role in the hydroperoxy radical balance with opposite signs (mean source contribution by CO=53.8% and sink by NO=75.7%). The daily maxima for the OH and the HO2species are in agreement with earlier model
calcu-lations by Hakola et al. (2003) for the same site, with val-ues of 4.1×10⁵ to 1.8×10⁶molecules cm−3, and 1×10⁷ to 1.5×10⁸molecules cm−3, respectively.
In sensitivity studies we investigated the influence of non-methane hydrocarobons, peroxy radicals and nitrogen diox-ide on the concentration of sulphuric acid. By comparing our calculated values of sulphuric acid with the measured ones, we gained the best agreement by decreasing the nitrogen dioxide concentrations during periods when high-polluted air arrived at the SMEAR II station from south to south-east, and by doubling the NMHCs. Using these assumptions, the mean ratio for the whole period between measured and calculated H2SO4concentrations reached a value close to unity with a
standard deviation of 0.412. The investigated sulphuric acid closure thus achieved a high agreement between the calcu-lated and measured sulphuric acid concentrations.
M. Boy et al.: Sulphuric acid closure and contribution to nucleation mode particle growth 877 With the measured and calculated sulphuric acid
concen-trations, we calculated particle diameter growth rates. In addition we estimated the particle growth rates through the DMPS data and defined the contribution of sulfuric acid to the particle growth rates. The average value of 8.8% were in the lower range of earlier estimations by Boy et al. (2003) for the same site (4–31%). This indicates that the concentration of sulphuric acid seems always to be high enough during par-ticle formation periods to participate in the growth process of the aerosols and can reach on certain days fractions up to 17% and most probably higher.
We classified days in two categories by using measure-ments and 72 h back trajectories from HYSPLIT:
– Polluted air masses originated over Central
Eu-rope or UK with high concentrations of SO2, NO2
and NO ( average: 1.74×10¹⁰, 4.16×10¹⁰ and 4.68×10⁹molecules cm−3, respectively) and also high CS values (average 0.0029 s−1).
– “Clean” air masses originated over the North Atlantic
or Polar region with 2 to 6 times smaller SO2, NO2and
NO concentrations (average: 6.07×10⁹, 1.72×10¹⁰and 7.91×10⁸molecules cm−3, respectively) and about 2 to 3 times smaller CS values (average 0.0011 s−1). The results of this analysis showed, that the growth rates de-termined by DMPS-measurements during “polluted” air pe-riods are by a factor of 1.45 higher compared to the “cleaner” days. The contribution of sulphuric acid to the growth rates is approximately equal. Obviously sulfuric acid is involved (fraction between 3 to 17%) in new particle production and growth of aerosols over boreal forest regions in Northern Eu-rope, although it might be not the key parameter in the parti-cle formation process itself.
Acknowledgements. The QUEST team acknowledge the
finan-cial support from the European Commission under the contract number EVK2-CT2001-00127 and the Academy of Finland. Further, the authors gratefully acknowledge the NOAA Air Resources Laboratory (ARL) for the provision of the HYS-PLIT transport and dispersion model and/or READY website (http://www.arl.noaa.gov/ready.html) used in this publication.
Edited by: A. Laaksonen
References
Boy, M. and Kulmala, M.: The part of the solar spectrum with the highest influence of the formation of SOA in the continen-tal boundary layer, Atmos. Chem. Phys., 2, 375–386, 2002a, SRef-ID: 1680-7324/acp/2002-2-375.
Boy, M. and Kulmala, M.: Nucleation events in the continental boundary layer: Influence of physical and meteorological param-eters, Atmos. Chem. Phys., 2, 1–16, 2002b,
SRef-ID: 1680-7324/acp/2002-2-1.
Boy, M., Rannik, ¨U., Lehtinen, K. E. J., Tarvainen, V., Hakola, H., and Kulmala, M.: Nucleation events in the continental PBL – long term statistical analyses of aerosol relevant characteristics, J. Geophys. Res., 108(D21), 4667, doi:10.1029/2003JD003838, 2003.
Cantrell, C. A., Shetter, R. E., Gilpin, T. M., and Calvert, J. G.: Peroxy radicals measured during Mauna Loa Observatory Photo-chemistry Experiment 2 – The data and first analysis, J. Geophys. Res., 101, 14 643–14 652, 1996.
Cantrell, C. A., Shetter, R. E., Calvert, J. G., Eisele, F. L., Williams, E., Baumann, K., Brune, W. H., Stevens, P. S., and Mather, J. H.: Peroxy radicals from photostationary state deviations and steady state calculations during the Tropospheric OH Photo-chemistry Experiment at Idaho Hill, Colorado, J. Geophys. Res., 102, 6369–6378, 1997.
Carslaw, N., Creasey, D. J., Heard, D. E., Jacobs, P. J., Lee, J. D., Lewis, A. C., McQuaid, J. B., Pilling, M. J., Bauguitte, S., Pen-kett, A., Monks, P. S., and Salibury, G.: Eastern Atlantic Spring Experiment 1997 (EASE97), 2. Comparisons of model concen-trations of OH, HO2, and RO2 and measurements, J. Geophys. Res. 107(D14), 4190, doi:10.1029/2001JD001568, 2002. DeMore, W. G., Sander, S. P., Golden, D. M., Hampson, R. F.,
Kurylo, M. J., Howard, C. J., Ravishankara, A. R., Kolb, C. E., and Molina, M. J.: Chemical Kinetics and Photochemical Data for use in Stratospheric Modelling, Evaluation No. 11, JPL Pub-lication 94-26, Jet Propulsion Laboratory, Pasadena, CA, 1994. Eisele F. L. and Tanner D. J.: Measurement of the gas phase
con-centration of H2SO4and methane sulfonic acid and estimates of H2SO4production and loss in the atmosphere, J. Geophys. Res.,
98(D5), 9001—9010, 1993.
Fuchs, N. A. and Sutugin, A. G.: Highly dispersed aerosol, in: Top-ics in current aerosol research, edited by: Hidy, G. M. and Brock, J. R., Pergamon, New York, 1971.
H¨ameri, K., V¨akev¨a, M., Aalto, P., Kulmala, M., Swietlicki, E., Zhou, J., Seidl, W., Becker, E., and O’Dowd, C. D.: Hygroscopic and CCN properites of aerosol particles in boreal forest, Tellus 53 B, 345–359, 2001.
Hakola, H., Tarvainen, V., Laurila, T., Hiltunen, V., Hell´en, H., and Keronen, P.: Seasonal variation of VOC concentrations above a boreal coniferous forest, Atmos. Environ., 37(12), 1623–1634, 2003.
Handisides, G. M., Plass-D¨ulmer, C., Gilge, S., Bingemer, H., and Berresheim, H.: Hohenpeissenberg Photochemical Experiment (HOPE 2000): Measurements and photostationary state calcula-tions of OH and peroxy radicals, Atmos. Chem. Phys., 3, 1565– 1588, 2003,
SRef-ID: 1680-7324/acp/2003-3-1565.
Hanke, M., Uecker, J., Reiner, T., and Arnold, F.: Atmospheric peroxy radicals: ROXMAS, a new mass-spectrometric method-ology for speciated measurements of HO2 and Sigma RO2 and first results, International Journal of Mass Spectrometry, 213(2– 3), 91–99, 2002.
Hell´en, H., Hakola H., Reissell A., and Ruuskanen T. M.: Carbonyl compounds in boreal coniferous forest air in Hyyti¨al¨a, Southern Finland, Atmos. Chem. Phys., 4, 1771–1780, 2004,
SRef-ID: 1680-7324/acp/2004-4-1771.
Janson, R. and De Serves, C.: Isoprene emissions from boreal wetlands in Scandinavia, J. Geophys. Res., 103(D19), 25 513– 25 517, 1998.
Korhonen, P., Kulmala, M., Laaksonen, A., Viisanen, Y., McGraw, R., and Seinfeld, J. H.: Ternary nucleation of H2SO4, NH3 and H2O in the atmosphere, J. Geophys. Res., 104, 26 349–26 353, 1999.
Kulmala, M., H¨ameri, K. K., Aalto, P., M¨akel¨a, J., Pirjola, L., Nils-son, E. D., Buzorius, G., Rannik, ¨U., Dal Maso, M., Seidl, W., Hoffmann, T., Jansson, R., Hansson, H.-C., O’Dowd, C., and Viisanen, Y.: Overview of the international project on biogenic aerosol formation in the boreal forest (BIOFOR), Tellus B, 53, 324–343, 2001a.
Kulmala, M., Dal Maso, M., M¨akel¨a, J. M., Pirjola, L., V¨akev¨a, M., Aalto, P., Miikkulainen, P., H¨ameri, K., and O’Dowd, C.: On the formation, growth and composition of nucleation mode particles, Tellus B, 53, 479–490, 2001b.
Kulmala, M.: How particles nucleate and grow, Science, 307(5647), 1000–1001, 2003.
Kulmala, M., Vehkam¨aki, H., Pet¨aj¨a, T., Dal Maso, M., Lauri, A., Kerminen, V.-M., Birmili, W., and McMurry, P. H.: Formation and growth rates of ultrafine atmospheric particles: A review of observations, J. Aerosol Sci, 35, 2, 143–176, 2004a.
Kulmala, M., Kerminen, V.-M., Anttila, T., Laaksonen, A., and O’Dowd, C.: Organic aerosol formation via sul-phate cluster activation, J. Geophys. Res., 109, D04205, doi:10.1029/2003JD003961, 2004b.
Menon, S., Del Genio, A. D., Koch, D., and Tselioudis, G.: GCM simulations of the aerosol indirect effect: Sensitivity to cloud parameterization and aerosol burden, J. Atmos. Sci., 59, 692– 713, 2002.
Ramanathan, V., Crutzen, P. J., Kiehl, J. T., and Rosenfeld, D.: Aerosol, climate, and the hydrological cycle, Science, 294, 2119–2124, 2001.
Rolph, G. D.: Real-time Environmental Applications and Dis-play sYstem (READY) Website (http://www.arl.noaa.gov/ready/ hysplit4.html), NOAA Air Resources Laboratory, Silver Spring, MD, 2003.
Seinfeld, J. H. and Pandis, S. N.: Atmospheric chemistry and physic, John Wiley & Sons, New York, 1998.
Sellegri, K., Umann, B., Hanke, M., and Arnold, F.: Deployment of a ground-based CIMS apparatus for the detection of organic gases in the boreal forest during the QUEST campaign, Atmos. Chem. Phys., 5, 357–372, 2005.
Solberg, S., Dye, C., Roemer, M., and Schmidbauer, N.: VOC mea-surements 1999, EMEP/CCC Report 7, 2001.
Stieb, D. M., Judek, S., and Burnett, R. T.: Meta-analysis of time-series studies of air pollution and mortality: Effects of gases and particles and their influence of cause of death, age and season. J. Air & Manage. Assoc. 52, 470–484, 2002.
Swietlicki, E., Zhou, J., Covert, D. S., H¨ameri, K., Busch, B., V¨akeva, M., Dusek, U., Berg, O. H., Wiedensohler, A., Aalto, P., M¨akel¨a, J., Martinsson, B. G., Papaspiropoulos, G., Mentes, B., Frank, G., and Stratmann, F.: Hygroscopic properties of aerosols in the north-eastern Atlantic during ACE-2, Tellus 52 B, 201– 227, 2000.
Weber, R. J., Marti, J. J., McMurry, P. H., Eisele, F. L., Tanner, D. J., and Jefferson, A.: Measurements of new particle formation and ultrafine particle growth rates at a clean continental site, J. Geophys. Res., 102, 4375–4385, 1997.
Wichmann, H.-H. and Peters, A.: Epidemiological evidence of the effects of ultrafine particle exposure, Phil. Trans. R. Soc. Lond., A., 358, 2751–2769, 2000.


![Table 5. Particle growth rates for several days during the campaign achieved by: DMPS=based on measured particle number concentration with size distribution; [H 2 SO 4 -M]=based on measured sulphuric acid concentrations and [H 2 SO 4 -C]=based on calculate](https://thumb-eu.123doks.com/thumbv2/123doknet/14543602.535821/14.892.133.761.168.453/particle-campaign-achieved-concentration-distribution-sulphuric-concentrations-calculate.webp)
