HAL Id: hal-02068952
https://hal.sorbonne-universite.fr/hal-02068952
Submitted on 15 Mar 2019
HAL is a multi-disciplinary open access
archive for the deposit and dissemination of
sci-entific research documents, whether they are
pub-lished or not. The documents may come from
teaching and research institutions in France or
abroad, or from public or private research centers.
L’archive ouverte pluridisciplinaire HAL, est
destinée au dépôt et à la diffusion de documents
scientifiques de niveau recherche, publiés ou non,
émanant des établissements d’enseignement et de
recherche français ou étrangers, des laboratoires
publics ou privés.
Hidden or missing outflows in highly obscured galaxy
nuclei?
N. Falstad, F. Hallqvist, S. Aalto, S. König, S. Muller, R. Aladro, F. Combes,
A. S. Evans, G. A. Fuller, J. S. Gallagher, et al.
To cite this version:
N. Falstad, F. Hallqvist, S. Aalto, S. König, S. Muller, et al.. Hidden or missing outflows in highly
obscured galaxy nuclei?. Astronomy and Astrophysics - A&A, EDP Sciences, 2019, 623, pp.A29.
�10.1051/0004-6361/201834586�. �hal-02068952�
arXiv:1901.06723v1 [astro-ph.GA] 20 Jan 2019
Astronomy & Astrophysicsmanuscript no. hcn_vs_oh_outflow_v5 ESO 2019c January 23, 2019
Hidden or missing outflows in highly obscured galaxy nuclei?
⋆
N. Falstad
1, F. Hallqvist
1, S. Aalto
1, S. König
1, S. Muller
1, R. Aladro
2, F. Combes
3, A. S. Evans
4, 5, G. A. Fuller
6,
J. S. Gallagher
7, S. García-Burillo
8, E. González-Alfonso
9, T. R. Greve
10, 11, C. Henkel
2, 12, M. Imanishi
13, T. Izumi
13,
J. G. Mangum
4, S. Martín
14, 15, G. C. Privon
16, K. Sakamoto
17, S. Veilleux
18, and P. P. van der Werf
191 Department of Space, Earth and Environment, Chalmers University of Technology, Onsala Space Observatory, 439 92 Onsala,
Sweden
e-mail: [email protected]
2 Max-Planck-Institut für Radioastronomie, Auf dem Hügel 69, 53121, Bonn, Germany
3 Observatoire de Paris, LERMA, College de France, CNRS, PSL Univ., UPMC, Sorbonne Univ., F-75014, Paris, France 4 National Radio Astronomy Observatory, 520 Edgemont Road, Charlottesville, VA 22903, USA
5 Department of Astronomy, 530 McCormick Road, University of Virginia, Charlottesville, VA 22904, USA
6 Jodrell Bank Centre for Astrophysics, School of Physics & Astronomy, The University of Manchester, Oxford Road, Manchester
M13 9PL, UK
7 Department of Astronomy, University of Wisconsin-Madison, 5534 Sterling, 475 North Charter Street, Madison WI 53706, USA 8 Observatorio de Madrid, OAN-IGN, Alfonso XII, 3, E-28014-Madrid, Spain
9 Universidad de Alcalá, Departamento de Física y Matemáticas, Campus Universitario, E-28871 Alcalá de Henares, Madrid, Spain 10 Cosmic Dawn Center (DAWN), DTU-Space, Technical University of Denmark, Elektrovej 327, DK-2800 Kgs. Lyngby; Niels
Bohr Institute, University of Copenhagen, Juliane Maries Vej 30, DK-2100 Copenhagen
11 Department of Physics and Astronomy, University College London, Gower Street, London WC1E 6BT, UK 12 Astron. Dept., King Abdulaziz University, P.O. Box 80203, 21589 Jeddah, Saudi Arabia
13 National Astronomical Observatory of Japan, National Institutes of Natural Sciences (NINS), 2-21-1 Osawa, Mitaka, Tokyo
181–8588, Japan
14 European Southern Observatory, Alonso de Córdova 3107, Vitacura 763 0355, Santiago, Chile 15 Joint ALMA Observatory, Alonso de Córdova 3107, Vitacura 763 0355, Santiago, Chile
16 Department of Astronomy, University of Florida, 211 Bryant Space Sciences Center, Gainesville, 32611 FL, USA 17 Institute of Astronomy and Astrophysics, Academia Sinica, PO Box 23-141, 10617 Taipei, Taiwan
18 Department of Astronomy, University of Maryland, College Park, MD 20742, USA
19 Leiden Observatory, Leiden University, P.O. Box 9513, NL-2300 RA Leiden, The Netherlands
ABSTRACT
Context.Understanding the nuclear growth and feedback processes in galaxies requires investigating their often obscured central regions. One way to do this is to use (sub)millimeter line emission from vibrationally excited HCN (HCN-vib), which is thought to trace warm and highly enshrouded galaxy nuclei. It has been suggested that the most intense HCN-vib emission from a galaxy is connected to a phase of nuclear growth that occurs before the nuclear feedback processes have been fully developed.
Aims.We aim to investigate if there is a connection between the presence of strong HCN-vib emission and the development of feedback in (ultra) luminous infrared galaxies ((U)LIRGs).
Methods.We collected literature and archival data in order to compare the luminosities of rotational lines of HCN-vib, normalized to the total infrared luminosity, to the median velocities of 119 µm OH absorption lines, potentially indicating outflows, in a total of 17 (U)LIRGs.
Results.The most HCN-vib luminous systems all lack signatures of significant molecular outflows in the far-infrared OH absorption lines. However, at least some of the systems with bright HCN-vib emission do have fast and collimated outflows that can be seen in spectral lines at longer wavelengths, including in millimeter emission lines of CO and HCN (in its vibrational ground state) as well as in radio absorption lines of OH.
Conclusions.We conclude that the galaxy nuclei with the highest LHCN−vib/LIRdo not drive wide-angle outflows detectable using the
median velocities of far-infrared OH absorption lines. It is possible that this is due to an orientation effect where sources which are oriented in such a way that their outflows are not along our line of sight also radiate a smaller proportion of their infrared luminosity in our direction. It could also be that massive wide-angle outflows destroy the deeply embedded regions responsible for bright HCN-vib emission, so that the two phenomena cannot coexist. This would strengthen the idea that vibrationally excited HCN traces a heavily obscured stage of evolution before nuclear feedback mechanisms are fully developed.
Key words. galaxies: evolution – galaxies: nuclei – galaxies: ISM – ISM: molecules –ISM: jets and outflows
⋆ Herschelis an ESA space observatory with science instruments
pro-vided by European-led Principal Investigator consortia and with impor-tant participation from NASA.
1. Introduction
Luminous and ultraluminous infrared galaxies ((U)LIRGs) are gas-rich systems that radiate intensely in the infrared portion of the electromagnetic spectrum, with infrared luminosities (LIR =
L(8–1000 µm)) in excess of 1011L⊙ and 1012L⊙, respectively
(e.g., Sanders & Mirabel 1996). These large luminosities are due to dust-reprocessed radiation from intense star formation, an active galactic nucleus (AGN), or both. In the local Universe, (U)LIRGs are relatively rare compared to less luminous ob-jects, but surveys at millimeter and submillimeter wavelengths have shown that they are much more numerous at high red-shifts (e.g., Smail et al. 1997; Hughes et al. 1998), indicating that they play an important role in the evolution of galaxies. Two important questions in this context are: how did the su-permassive black holes (SMBHs) found in the nuclei of most galaxies grow, and how are they related to the evolution of their host galaxies? From observations, we know that tight re-lations between the mass of the central SMBH and various properties of the host galaxy exist in large ellipticals (e.g., Magorrian et al. 1998; Ferrarese & Merritt 2000; Gebhardt et al. 2000; Kormendy & Ho 2013). It has been suggested that these relations were partly established through a process, mostly tak-ing place in the early Universe, in which galaxies of similar masses collide and merge (see, e.g., Kormendy & Ho 2013, for a review). In such mergers, large amounts of gas are funneled into the new nucleus, giving rise to intense starbursts, AGN ac-tivity, or both. The exact physics of how the black hole-host re-lations would be established are still obscure, but several sug-gested galaxy merger scenarios include a starburst dominated phase followed by a phase of obscured AGN activity. Eventu-ally, the AGN becomes strong enough to drive outflows that clear the surrounding material and reveal the central activity (e.g., Sanders et al. 1988a; Hopkins et al. 2006; Urrutia et al. 2008; Simpson et al. 2012). Thus, studies of the most dust-embedded phase of evolution and the early stages of feedback are essential in order to understand how SMBHs grow together with their host galaxies.
However, observations of the most enshrouded galaxy nu-clei are hampered by the large amounts of obscuring mate-rial that surround them. One solution to this problem is to ob-serve at millimeter and radio wavelengths, where the dust is less optically thick (e.g., Barcos-Muñoz et al. 2015). Some com-mon tracers of obscured galaxy nuclei at these wavelengths are the low-J rotational lines of the HCN and HCO+ molecules. Recently, however, it has been shown that, in the most ob-scured systems, even these dense-gas tracers are heavily affected by continuum- and/or self-absorption by cooler foreground gas (e.g., Sakamoto et al. 2009; Aalto et al. 2015b; Martín et al. 2016). A better suited tracer of the most obscured systems is of-fered by HCN in its first vibrationally excited state, v2=1
(here-after HCN-vib). Strong emission lines from rotational transitions within the v2=1 state have been detected in external galaxies at
(sub)millimeter wavelengths, first by Sakamoto et al. (2010) and then in many subsequent observations. With energy levels that lie more than 1000 K above the ground state, HCN-vib is mainly excited by absorption of mid-infrared radiation. However, to be efficiently populated it requires brightness temperatures in ex-cess of 100 K at 14 µm, the wavelength of the transition between the ground and first vibrationally excited states of HCN, translat-ing into a H2column density larger than 2 × 1023cm−2for a dust
temperature of 100 K (Aalto et al. 2015b). This makes bright HCN-vib emission an excellent unabsorbed (Martín et al. 2016) tracer of high column density gas with high mid-infrared surface brightness. While the direct mid-infrared radiation from such re-gions is often hidden from us by the large quantities of obscuring material, the rotational transitions inside the vibrationally ex-cited states occur at millimeter and submillimeter wavelengths where the dust opacity is lower. The low-J rotational lines of
HCN-vib are thus useful probes of the nuclear mid-infrared source in heavily obscured objects. Since the first extragalactic (sub)millimeter detection of HCN-vib rotational line emission by Sakamoto et al. (2010), the field has developed rapidly (e.g., Imanishi & Nakanishi 2013; Aalto et al. 2015a,b; Imanishi et al. 2016a,b, 2018; Martín et al. 2016), notably thanks to the Ata-cama Large Millimeter/submillimeter Array (ALMA).
In their study of HCN-vib in obscured galaxies, Aalto et al. (2015b) found that all galaxies with detected HCN-vib emission show evidence of inflows, outflows, or both. In addition, they found a tentative trend that galaxies with fast molecular out-flows have fainter HCN-vib emission relative to their total in-frared luminosity. The trend is especially striking when compar-ing the strength of the HCN-vib emission to the velocity of the wide-angle OH outflows studied by, for example, Veilleux et al. (2013). Based on a relatively small sample of nine galaxies, Aalto et al. (2015b) tentatively suggest that strong HCN-vib emission is connected to a rapid phase of nuclear growth that occurs right before the onset of strong feedback.
In this paper, we present the results of a study employing a sample of 19 galaxies including data from the literature as well as previously unpublished data, in order to further investigate the connection, or lack thereof, between strong HCN-vib emis-sion and molecular outflows. The sample used in this study is described in Sect. 2 and in Sect. 3 we present the results which are then discussed in Sect. 4. Finally, the conclusions that we draw from the analysis are summarized in Sect. 5. Throughout the paper, a H0=73 km s−1Mpc−1, Ωm =0.27, and ΩΛ=0.73
cosmology is adopted.
2. Sample
We have searched for (U)LIRGs with existing ALMA observa-tions of HCN-vib that are either already published or that have the data publicly available in the the ALMA science archive1. In addition, we have included published HCN-vib observations taken with the Plateau de Bure Interferometer (PdBI), the North-ern Extended Millimeter Array (NOEMA), or the Submillime-ter Array (SMA). We have not included non-detections, unless they have existing observations of the OH doublet at 119 µm, which we use to determine the outflow velocity. Non-detections have also been excluded when a meaningful upper limit to the HCN-vib flux could not be determined, either due to low sen-sitivity spectra or due to significant flux from the HCO+ line
which is separated from HCN-vib by ∼400 km s−1. This is a
possible source of bias, as HCN-vib emission may be hidden by the HCO+ line in sources with outflowing gas. In practice, most sources that have been excluded either do not have any outflow signatures in the far-infrared OH lines that we use to trace outflows (see below), or have not been observed in these lines. The two exceptions are IRAS 19254-7245 (Imanishi et al. 2016a) and NGC 6240 (ALMA project 2015.1.01448.S, PI: R. Tunnard), in which the median velocities of the OH 119 µm lines are ∼ − 250 and ∼ − 200 km s−1, respectively. In total, 10 sources have been excluded, most of them due to lack of OH measure-ments.
For consistency of the sample, we ensure that outflow ve-locities were measured using the same common tracers and following the same procedures. All sources with HCN-vib ob-servations have therefore been checked for obob-servations of the far-infrared OH doublet at 119 µm with the Herschel Space
1 The ALMA science archive is available at
N. Falstad et al.: Hidden or missing outflows in highly obscured galaxy nuclei?
Observatory (Pilbratt et al. 2010) as this is a known tracer of molecular outflows on subkiloparsec scales, which has been observed in a large number of (U)LIRGs (e.g., Fischer et al. 2010; Veilleux et al. 2013; González-Alfonso et al. 2017b). The OH molecule has high abundances in photodissociation regions as well as in X-ray dominated regions (e.g., Maloney et al. 1996; Goicoechea et al. 2011; Meijerink et al. 2011). Unlike other common outflow tracers like the millimeter rotational tran-sitions of CO and HCN, the ground state OH 119 µm doublet is often detected in absorption towards the far-infrared background (e.g., Veilleux et al. 2013), providing an unambiguous tracer of the gas motion. The transitions between excited states (for ex-ample the doublets at 65 and 84 µm) are generally weaker and the line wings are not always detected (González-Alfonso et al. 2017b). Recently, the 119 µm doublet was also used to detect a fast outflow (. 800 km s−1) in a galaxy at a redshift of 5.3
(Spilker et al. 2018). Systematic searches of outflow signatures in the far-infrared OH lines have revealed evidence of molecular outflows in approximately two thirds of the observed (U)LIRG samples (Veilleux et al. 2013; Spoon et al. 2013). From this de-tection rate, Veilleux et al. (2013) inferred a wide average open-ing angle of ∼145◦, assuming that all objects in their
sam-ple have outflows. In fact, based on radiative transfer mod-els as well as spatially resolved observations of two outflows, González-Alfonso et al. (2017b) argue that the 119 µm OH ab-sorptions are primarily sensitive to wide-angle outflows. On the other hand, unambiguous signatures of inflows are only found in one tenth of the sources in the sample of Veilleux et al. (2013), suggesting that OH inflows are either rare or have, on average, smaller opening angles.
In particular, the 43 sources in the far-infrared OH sam-ple of Veilleux et al. (2013) have been checked for observa-tions of the (sub)millimeter HCN-vib J = 3–2 or J = 4–3 lines. Fourteen of these had HCN-vib detections or data that allowed for meaningful upper limits to be estimated. One of them, IRAS 05189-2524 (see Appendix B), has previously un-published data in the ALMA science archive while data for the remaining thirteen were taken from Sakamoto et al. (2010); Aalto et al. (2015a,b); Imanishi et al. (2016a,b); Martín et al. (2016); Privon et al. (2017); Aladro et al. (2018); and König et al. (in prep.). In addition, five sources not included in the sam-ple of Veilleux et al. (2013) were found to have usable obser-vations of HCN-vib. One, IRAS 12224-0624 (see Appendix B), has previously unpublished data in the ALMA science archive while the other four were taken from Aalto et al. (2015b) and Imanishi et al. (2016a). Three of these five sources, Zw 049.057, IRAS 20414-1651, and NGC 7469, also have existing observa-tions of the OH 119 µm doublet (see Appendix C).
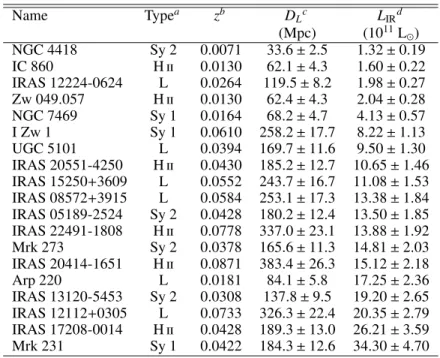
In total, 19 (U)LIRGs with existing HCN-vib observations were found. Of these, 17 also have observations of the OH 119 µm doublet. The final sample, with the adopted redshift and distance of each source, is presented in Table 1.
3. Results
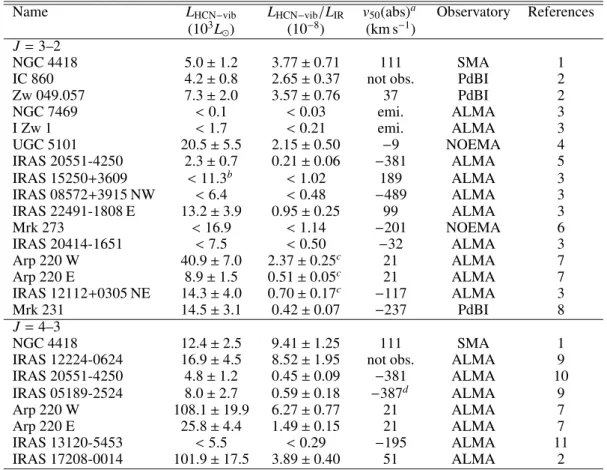
Vibrationally excited HCN luminosities, LHCN−vib/LIR ratios,
and OH median velocities are presented in Table 2. We adopt the LHCN−vib/LIRratio as a parameter to describe the strength of
HCN-vib in a normalized fashion. However, we are aware that some part of the total LIRmay be unrelated to the dusty nucleus,
and instead come from, for example, an extended starburst. In particular, in systems with multiple nuclei, for example Arp 220 and IRAS 12112+0305, LIR will have contributions from both
nuclei. In our sample, we are not aware of any sources were
these effects would affect the LHCN−vib/LIR ratio enough to
sig-nificantly change our results. We use the median velocity of the OH lines instead of the terminal outflow velocity as the former provides more robust values (Veilleux et al. 2013). Velocities are only given for those sources with absorption in the OH 119 µm doublet, as this means that the gas is in the foreground and that a positive or negative velocity shift can be interpreted as evidence of gas moving towards or away from the background nucleus, re-spectively. We note that this does not necessarily indicate in- or outflowing gas in all cases as, for example, interactions between two nuclei can also affect the OH kinematics. In addition, it is important to take the uncertainties in the velocity determination into account. For example, Veilleux et al. (2013) define an out-flow as having an OH absorption feature with a median velocity more negative than −50 km s−1, which is the typical uncertainty on the velocities. The requirement to detect the OH doublet in absorption is a possible source of bias as this requires a high enough column density of OH in front of a strong enough far-infrared background source. However, we note that all galaxies with an HCN-vib detection, if observed, have also been detected in absorption in the OH 119 µm doublet. Therefore, no sources with a combination of high HCN-vib luminosity and a fast out-flow have been missed due to this effect.
The line luminosities presented in Table 2 have been calcu-lated following Eq. (1) in Solomon & Vanden Bout (2005), ap-plied to HCN-vib:
LHCN−vib=1.04 × 10⁻³SHCN−vib∆v νrest(1 + z)−1D2L, (1)
where LHCN−vib is the HCN-vib luminosity measured in L⊙,
SHCN−vib∆v is the velocity integrated flux in Jy km s−1, νrest is
the rest frequency in GHz, and DL is the luminosity distance in
Mpc. Due to differences in the adopted redshifts and distances, these values differ slightly from those given in the original refer-ence for some of the sources. In case of non-detections, we have included the 3σ upper limit to the line luminosity. In the case of IRAS 15250+3609, the HCN-vib line is likely blended with a potential outflow signature in the nearby HCO+line. Here, we
have attributed the entire emission feature to the HCN-vib line, and the value given should be considered an upper limit to the HCN-vib luminosity. A short discussion of this source as well as descriptions of the analysis of previously unpublished HCN-vib observations and new OH outflow measurements can be found in Appendices A, B, and C.
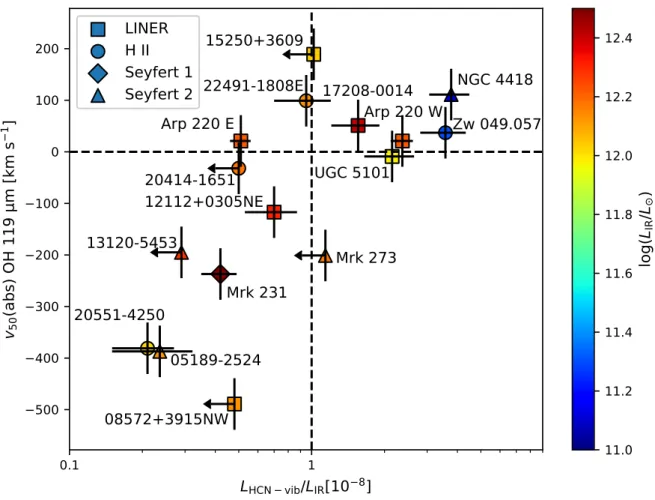
In Fig. 1, the OH absorption median velocities are plotted against the luminosities of the HCN-vib line, normalized to the total infrared luminosity of each galaxy. When available, the J = 3–2 line has been chosen. In the four sources where both transitions have been observed, the luminosity ratio between the J =4–3 and J = 3–2 lines lies in the range 2–3, with a mean of 2.5. For sources where only the J = 4–3 line has been observed, we have therefore divided its luminosity by 2.5 and included it in the plot with an extra 20% uncertainty added in quadrature. The two galaxies with only emission in the 119 µm doublet, I Zw 1 and NGC 7469, are not included in the plot, but we note that neither of them have an HCN-vib detection.
In the plot in Fig. 1 we see that, in our sample, the sources with high LHCN−vib/LIRratios, in excess of 10−8, all lack fast
out-flows as traced by the median velocity of the OH 119 µm dou-blet. However, galaxies without fast outflows do not necessarily have high LHCN−vib/LIRratios. The lack of sources in the upper
left portion of the diagram is likely due to selection effects; that area should be populated by less obscured sources of lower lumi-nosity that are not able to drive outflows or provide the necessary conditions for efficient HCN-vib excitation.
Table 1. Sample galaxies. Name Typea zb D Lc LIRd (Mpc) (1011L⊙) NGC 4418 Sy 2 0.0071 33.6 ± 2.5 1.32 ± 0.19 IC 860 H ii 0.0130 62.1 ± 4.3 1.60 ± 0.22 IRAS 12224-0624 L 0.0264 119.5 ± 8.2 1.98 ± 0.27 Zw 049.057 H ii 0.0130 62.4 ± 4.3 2.04 ± 0.28 NGC 7469 Sy 1 0.0164 68.2 ± 4.7 4.13 ± 0.57 I Zw 1 Sy 1 0.0610 258.2 ± 17.7 8.22 ± 1.13 UGC 5101 L 0.0394 169.7 ± 11.6 9.50 ± 1.30 IRAS 20551-4250 H ii 0.0430 185.2 ± 12.7 10.65 ± 1.46 IRAS 15250+3609 L 0.0552 243.7 ± 16.7 11.08 ± 1.53 IRAS 08572+3915 L 0.0584 253.1 ± 17.3 13.38 ± 1.84 IRAS 05189-2524 Sy 2 0.0428 180.2 ± 12.4 13.50 ± 1.85 IRAS 22491-1808 H ii 0.0778 337.0 ± 23.1 13.88 ± 1.92 Mrk 273 Sy 2 0.0378 165.6 ± 11.3 14.81 ± 2.03 IRAS 20414-1651 H ii 0.0871 383.4 ± 26.3 15.12 ± 2.18 Arp 220 L 0.0181 84.1 ± 5.8 17.25 ± 2.36 IRAS 13120-5453 Sy 2 0.0308 137.8 ± 9.5 19.20 ± 2.65 IRAS 12112+0305 L 0.0733 326.3 ± 22.4 20.35 ± 2.79 IRAS 17208-0014 H ii 0.0428 189.3 ± 13.0 26.21 ± 3.59 Mrk 231 Sy 1 0.0422 184.3 ± 12.6 34.30 ± 4.70
Notes.(a)Optical spectral types, H ii, L (for LINER), Sy 1 and Sy 2 (for Seyfert 1 and 2, respectively). When available, we have used the
classifi-cations from Veilleux et al. (1995) and Kim et al. (1998), otherwise, we have used classificlassifi-cations from Sanders et al. (1988b), Baan et al. (1998), and Véron-Cetty & Véron (2001).(b)In priority order, we have used redshifts from Veilleux et al. (2013), Sanders et al. (2003), or Strauss et al.
(1992), except for IRAS 05189-2524 where the redshift from Sanders et al. (1991) was used.(c)Luminosity distances were calculated from the
redshifts following the same procedure as Sanders et al. (2003).(d)Infrared luminosities were calculated using the prescription in Table 1 of
Sanders & Mirabel (1996) (originally from Pérault (1987)) using IRAS fluxes taken from Sanders et al. (2003), except for IRAS 20414-1651 where fluxes were taken from Moshir et al. (1992), and I Zw 1 where they were taken from Sanders et al. (1989).
4. Discussion
Our comparison of HCN-vib line luminosities and OH 119 µm absorption line velocities in nearby (U)LIRGs shows a trend of positive, or low negative, velocities, indicating inflows or slow outflows, in sources with bright HCN-vib emission relative to the total infrared luminosity. This might indicate that regions with the high mid-infrared brightness temperatures required for effi-cient population of HCN-vib are not affected by inflowing gas, but are destroyed by, or cannot form in the presence of, strong outflows. In this section, we discuss possible reasons for the lack of outflow signatures in the OH 119 µm absorptions in HCN-vib luminous sources, and how the HCN-HCN-vib lines relate to other tracers of heavily obscured regions.
4.1. Why do the HCN-vib luminous galaxies lack outflow signatures in the far-infrared OH lines?
There are several scenarios that could explain the lack of out-flow signatures in the galaxies that have bright HCN-vib emis-sion. One is that there are no outflows, another that the outflows are hidden from detection using the median velocity of the OH 119 µm absorption lines, and a third is that the distribution in Fig. 1 is due to orientation effects. These scenarios are discussed in the following sections. We also briefly discuss a possible evo-lutionary scenario in which the HCN-vib luminous galaxies are in a pre-feedback phase. Admittedly, our sample is quite hetero-geneous in that it contains galaxies of different merger types, in different merger stages, of different optical classifications, and with infrared luminosities spanning more than an order of mag-nitude. It is therefore possible that there are several independent
reasons for the lack of far infrared outflow signatures in HCN-vib luminous galaxies.
4.1.1. No outflows
If there are no outflows, it might be due to the HCN-vib lumi-nous galaxies being intrinsically different from the galaxies with weaker HCN-vib emission. For example, Veilleux et al. (2013) find a tendency for systems with dominant AGN to have faster OH outflows; it might then be that the HCN-vib luminous sys-tems, which do not show fast OH outflows, are instead starburst dominated. Indeed, in the two sources with the highest abso-lute HCN-vib luminosities, IRAS 17208-0014 and Arp 220, less than 10% of the bolometric luminosities are estimated to come from AGN activity, based on the 15 to 30 µm continuum ra-tio (Veilleux et al. 2013). However, this diagnostic can be mis-leading in galaxies where the nuclei are optically thick into the far infrared. Furthermore, at least two other sources with strong HCN-vib emission, NGC 4418 and UGC 5101, have AGN frac-tions & 50%. While the uncertainty on the AGN fraction deter-mined in this way is estimated to be 20% on average, it is likely much higher in the strongly buried sources discussed here.
Another possible explanation for a real lack of outflows in some sources is that we are witnessing a pre-feedback phase in young systems that will later evolve into objects with weak HCN-vib emission and fast outflows. This pos-sibility is discussed further in Sect. 4.1.4. As discussed by González-Alfonso et al. (2017b), the lack of outflows could also be due to the fact that, in the most extremely buried sources, it is difficult to find paths with more moderate columns that can be efficiently accelerated to high velocities.
N. Falstad et al.: Hidden or missing outflows in highly obscured galaxy nuclei? Table 2. LHCN−viband outflow properties.
Name LHCN−vib LHCN−vib/LIR v50(abs)a Observatory References
(103L
⊙) (10−8) (km s−1)
J =3–2
NGC 4418 5.0 ± 1.2 3.77 ± 0.71 111 SMA 1
IC 860 4.2 ± 0.8 2.65 ± 0.37 not obs. PdBI 2 Zw 049.057 7.3 ± 2.0 3.57 ± 0.76 37 PdBI 2 NGC 7469 <0.1 <0.03 emi. ALMA 3 I Zw 1 <1.7 <0.21 emi. ALMA 3 UGC 5101 20.5 ± 5.5 2.15 ± 0.50 −9 NOEMA 4 IRAS 20551-4250 2.3 ± 0.7 0.21 ± 0.06 −381 ALMA 5 IRAS 15250+3609 <11.3b <1.02 189 ALMA 3 IRAS 08572+3915 NW <6.4 <0.48 −489 ALMA 3 IRAS 22491-1808 E 13.2 ± 3.9 0.95 ± 0.25 99 ALMA 3 Mrk 273 <16.9 <1.14 −201 NOEMA 6 IRAS 20414-1651 <7.5 <0.50 −32 ALMA 3 Arp 220 W 40.9 ± 7.0 2.37 ± 0.25c 21 ALMA 7 Arp 220 E 8.9 ± 1.5 0.51 ± 0.05c 21 ALMA 7 IRAS 12112+0305 NE 14.3 ± 4.0 0.70 ± 0.17c −117 ALMA 3 Mrk 231 14.5 ± 3.1 0.42 ± 0.07 −237 PdBI 8 J =4–3 NGC 4418 12.4 ± 2.5 9.41 ± 1.25 111 SMA 1
IRAS 12224-0624 16.9 ± 4.5 8.52 ± 1.95 not obs. ALMA 9 IRAS 20551-4250 4.8 ± 1.2 0.45 ± 0.09 −381 ALMA 10 IRAS 05189-2524 8.0 ± 2.7 0.59 ± 0.18 −387d ALMA 9 Arp 220 W 108.1 ± 19.9 6.27 ± 0.77 21 ALMA 7 Arp 220 E 25.8 ± 4.4 1.49 ± 0.15 21 ALMA 7 IRAS 13120-5453 <5.5 <0.29 −195 ALMA 11 IRAS 17208-0014 101.9 ± 17.5 3.89 ± 0.40 51 ALMA 2
Notes.(a)Median OH outflow velocities taken from Veilleux et al. (2013) or, for sources not in their sample, from archival data following the same
procedure. Sources that have not been observed or where the doublet was detected in emission are indicated with not obs. or emi., respectively. The typical uncertainty on the velocities is 50 km s−1.(b)Imanishi et al. (2016a) interpret an emission feature at the position of the HCN-vib line as a
sub-peak of the nearby HCO+line. Here, we use this value as an upper limit to the HCN-vib luminosity.(c)The L
HCN−vib/LIRis calculated using the
total LIRof the system, possibly introducing some bias in systems with multiple nuclei.(d)The median velocity of the lines in IRAS 05189-2524
has been adjusted to correct for the different redshift adopted compared to the one used by Veilleux et al. (2013).
References. (1) Sakamoto et al. (2010); (2) Aalto et al. (2015b); (3) Imanishi et al. (2016a); (4) König et al. (in prep.); (5) Imanishi et al. (2016b); (6) Aladro et al. (2018); (7) Martín et al. (2016); (8) Aalto et al. (2015a); (9) This work; (10) Imanishi & Nakanishi (2013); (11) Privon et al. (2017)
Interestingly, as Aalto et al. (2015b) notes, fast molecular outflows have been found, with other tracers and at longer wave-lengths, in some of the HCN-vib luminous systems. For exam-ple, a compact v > 800 km s−1 CO J = 2–1 outflow has been found in the ULIRG IRAS 17208-0014 (García-Burillo et al. 2015) and an equally fast, compact, and collimated, HCN J = 1–0 outflow has been detected in the ULIRG Arp 220 (Barcos-Muñoz et al. 2018). Possible outflow signatures are also found in Zw 049.057 (Falstad et al. 2018) as well as in NGC 4418 and IRAS 22491-1808 (Fluetsch et al. 2018), al-though at lower velocities. If we also consider the fact that UGC 5101 has faint high-velocity wings in its OH 119 µm ab-sorption lines (Veilleux et al. 2013), it turns out that all of the six most HCN-vib luminous sources have signatures of molecular outflows.
4.1.2. Obscured, episodic, or collimated outflows
For the HCN-vib bright systems that do have outflows, there must be a reason why we do not see them in the far-infrared OH absorption lines. One possibility is that these objects have extreme optical depths in the far-infrared dust continuum, so
that much of the outflowing gas cannot be seen due to obscu-ration by the dust. In at least some of the sources, high optical depths have indeed been inferred from radiative transfer mod-eling of Herschel observations (e.g., González-Alfonso et al. 2012; Falstad et al. 2015). If this is combined with young out-flows that are still very compact, any signatures of them may be completely hidden in the far-infrared. In such a situation, in-flows on larger scales, for example as the one seen in Arp 299A (Falstad et al. 2017), may still be detectable. In fact, at least three of the five most obscured sources (Arp 220, IRAS 17208-0014, and Zw 049.057; Baan et al. 1989; Falstad et al. 2018) have out-flows that are seen in the OH lines at centimeter wavelengths but not in the far-infrared. In Zw 049.057, infrared and optical im-ages reveal multiple clouds in a polar dust structure, which might suggest that the outflow in this galaxy is not steady in time (Gal-lagher et al. in prep.). It is thus possible that, in some galaxies, we are witnessing an episodic process where the nuclear region is alternating between feedback and accretion dominated states.
Looking at the spectra presented by Veilleux et al. (2013), UGC 5101 and IRAS 17208-0014 even exhibit weak blueshifted line wings in the OH 119 µm absorption lines. This indicates the presence of gas moving towards us, but as the absorptions
0.1 1 LHCN − vib/LIR[10−8] −
500
5400
5300
5200
5100
0
100
200
v50
(ab
s)
OH
11
9 4
m
(m
s
51
]
05189
-2524 13120-5453 17208-0014 Arp 220 W Arp 220 E Zw 049.057 Mrk 231 Mrk 273 NGC 4418 UGC 5101 08572+3915NW 12112+0305NE 15250+3609 20414-1651 20551-4250 22491-1808E LINER H II Seyfert 1 Seyfert 2 11.0 11.2 11.4 11.6 11.8 12.0 12.2 12.4 lo g( LIR /L⊙ )Fig. 1. Median OH absorption velocity as a function of the HCN-vib luminosity relative to the the total infrared luminosity. For sources with observations of the J = 3–2 transition, only this line is plotted. For sources with detections only in the J = 4–3 line, the HCN-vib luminosity has been scaled down by a factor of 2.5, with an extra uncertainty of 20% included in the error bars. Squares, circles, diamonds, and triangles represent LINER, H ii, Seyfert 1, and Seyfert 2 optical spectral types, respectively. Colors indicate the total infrared luminosity of each system. Upper limits (3σ) are indicated with arrows.
at negative velocities are shallow, they do not have a strong effect on the median velocities of the lines. As discussed by González-Alfonso et al. (2017b), this may suggest that we are witnessing collimated outflows in these sources, as opposed to the wide-angle outflows that the OH 119 µm lines seem to be pri-marily sensitive to. With all this in mind, it seems that the regions responsible for the bright HCN-vib emission are not destroyed by (fast) outflows in general, but rather by the kind of wide-angle outflows from the nuclear infrared-emitting region that are able to shift the median velocity of the OH 119 µm ground state lines by several hundreds of km s−1.
Turning to the two sources that show pure emission in the OH 119 µm doublet, I Zw 1 and NGC 7469, we note that they lack HCN-vib detections and that the upper limits to their LHCN−vib/LIR ratios are among the lowest in our sample.
Fur-thermore, NGC 7469 has also been observed in the OH 65 µm doublet, another tracer of obscured nuclei, but no absorption was detected (González-Alfonso et al. 2015). This is consistent with the results of Veilleux et al. (2013) that the sources with pure OH emission are the ones where an AGN dominates the luminosity and that these objects represent a phase where the feedback has subsided after clearing a path through the dusty surroundings.
4.1.3. Orientation effects
An alternative explanation to the distribution of galaxies in Fig. 1 is that it is produced by a simple orientation effect. For exam-ple, using the OH 119 µm doublet, Veilleux et al. (2013) found unambiguous evidence of outflows in 70% of their sources, a de-tection rate which is consistent with all sources having molecular outflows, with an average opening angle of ∼145◦. The sources
with no outflow signatures would then be those that are oriented approximately edge-on, with outflows perpendicular to our line of sight. It is harder to explain why these would also be the sources with bright HCN-vib emission, as the obscuration in a dusty edge-on disk would rather have the effect of lowering the visible HCN-vib flux, unless the line is masing as seen towards some circumstellar envelopes (e.g., Lucas & Cernicharo 1989; Bieging 2001; Menten et al. 2018).
However, the comparison so far has been based on the HCN-vib luminosity divided by the total infrared luminosity which, due to the higher dust opacity in the infrared, is more affected by orientation effects. The infrared luminosity that we see will thus depend on the orientation, with higher values for face-on galaxies. This effect may indeed be significant; for example,
N. Falstad et al.: Hidden or missing outflows in highly obscured galaxy nuclei?
Efstathiou et al. (2014) estimated that the true infrared lumi-nosity of IRAS 08572+3915 may be as high as 1.1 × 10¹³ L
⊙,
more than five times higher than the value inferred assuming the luminosity is isotropic. Another possible example is Arp 220 where the total infrared luminosity estimated from the IRAS fluxes is ∼1.7 × 10¹² L⊙while Sakamoto et al. (2017) estimate
the bolometric luminosity from the western nucleus alone to be ∼3 × 10¹²L⊙.
If we do not divide LHCN−vib by the total infrared
luminos-ity, we see that Mrk 231 has an HCN-vib luminosity compara-ble to those of the HCN-vib bright galaxies. However, it is still less luminous than in the ULIRGs Arp 220 W and IRAS 17208-0014, and only a factor of two or three brighter than in the LIRGs Zw 049.057, IC 860, and NGC 4418. Furthermore, none of the other sources with v50 . −200 km s−1 have strong HCN-vib
emission. Clearly, a larger sample will be required to investigate this issue further. If the distribution of sources in Fig. 1 is in-deed due to an orientation effect, more sources with both strong HCN-vib emission and outflow signatures in the far-IR OH lines should show up in an extended sample.
4.1.4. Evolution
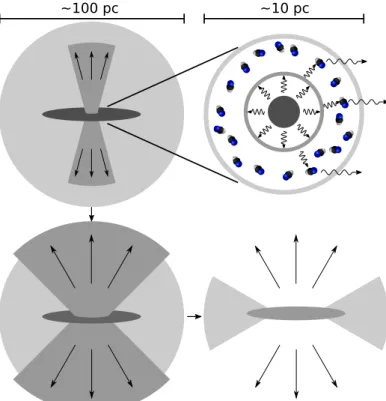
Following Aalto et al. (2015b), we present a possible evolution-ary scenario in which bright HCN-vib emission is tracing ex-tremely obscured nuclei in a phase that occurs before the nuclear feedback is able to drive wide-angle outflows, or at least before such outflows can be observed in the far-infrared OH lines. In this scenario, the deeply embedded regions which provide the necessary conditions for HCN-vib excitation can coexist with fast collimated outflows, but are disrupted once nuclear wide-angle outflows have developed. A schematic view of one pos-sible version of the scenario is presented in Fig. 2. Here, the most obscured sources consist of a mid-infrared core, responsi-ble for the HCN-vib emission, surrounded by an obscuring layer of cooler dust that accounts for the far-infrared emission. Out-flows in these objects are collimated and often so compact that they are still embedded in the outer layer of dust, and thus ob-scured from view in the far-infrared. In the next phase, the out-flows have broken through the cooler dust layer and widened considerably, making them clearly detectable in most galaxies. As gas and dust is transported from the regions around the nu-cleus, the conditions in the mid-infrared core change, becoming less favorable for the excitation of HCN-vib. Finally, when a path has been cleared through the surrounding dust, OH is no longer detectable in absorption and the conditions for HCN-vib excita-tion in the core are no longer met.
A similar evolutionary sequence has been suggested by González-Alfonso et al. (2017a), and we note that, apart from UGC 5101, the HCN-vib luminous sources from our sample co-incide with the sources in their extremely buried pre-feedback phase. It should be noted that, even if an evolutionary scenario like this applies in some cases, all sources in our sample may not be on the same evolutionary track. For example, a lot of nu-clear power is required in order to push large columns of gas to high velocities, and LIRGs like NGC 4418 and Zw 049.057 may therefore never develop powerful wiangle outflows de-tectable in the far-IR OH lines. Instead, they might evolve along the horizontal axis in Fig. 1.
Finally, an interesting comparison can be made with the highly collimated molecular outflows that are found around low-mass protostars in the earliest (class 0) stages of their formation (e.g., Konigl & Pudritz 2000; Codella et al. 2014). With time, gas at larger and larger angles from the outflow axis may be
en-~100 pc ~10 pc
Fig. 2. Schematic view of a possible evolutionary scenario. The upper left panel shows the most obscured phase where both the mid-infrared core and the outflow are still completely embedded in a layer of cooler dust. The upper right panel shows the conditions in the mid-infrared core in this phase. A central energy source is heating the dusty core through radiative trapping. Mid-infrared photons, which cannot escape the dusty environment, vibrationally excite the HCN molecules which may then undergo rotational transitions and emit (sub)millimeter pho-tons that are able to penetrate the obscuring dust. In the lower left panel, the outflow has broken through the cooler layer of dust and widened, making it visible in the far-infrared. The lower right panel shows a third stage where the outflow has cleared a path through the surrounding dust layer. In the two final stages, conditions in the core are no longer suffi-cient for luminous HCN-vib emission to occur.
trained, eventually sweeping away most of the envelope around the star (e.g., Arce & Sargent 2006). Furthermore, vibrationally excited HCN has been detected toward molecular hot cores around massive protostars using the direct l-type transitions, that is transitions between the l-type levels inside a rotational state, at cm-wavelengths (e.g., Rolffs et al. 2011).
4.2. HCN-vib compared to other tracers of obscured nuclear regions.
As discussed in Aalto et al. (2015b), a prerequisite for the ex-citation of HCN-vib is the presence of warm and dusty re-gions, making it a good tracer of deeply buried nuclei. Follow-ing this logic, our results indicate that the most obscured nuclei lack evolved, wide-angle outflows. Interestingly, the results of González-Alfonso et al. (2017b), who use the equivalent width of the OH 65 µm doublet as a measure of the obscuration, sug-gest that the fastest outflows arise in some of the most obscured nuclei. They do however point out that sources with high equiv-alent width in OH 65 µm do not necessarily have fast outflows. By comparing our Fig. 1 with their Fig. 4, we see that five of the six most HCN-vib luminous sources that are included in both samples also belong to the group of sources with high equivalent width but low outflow velocity, indicating that they are obscured
also when using the OH 65 µm equivalent width as a measure. On the other hand, five of the sources with low HCN-vib lumi-nosity are also found among the sources with high OH 65 µm equivalent width, indicating that they also contain obscured nu-clei. It appears that the two measures trace different parts or physics of the galaxy nuclei. Indeed, González-Alfonso et al. (2017b) state that high equivalent widths require dust temper-atures in excess of 60 K, while dust tempertemper-atures above 100 K are required for bright HCN-vib emission (Aalto et al. 2015b). It is thus possible that bright HCN-vib emission exclusively traces more obscured parts of the nuclei, where the dust is hotter.
In a similar manner, Spoon et al. (2013) also find that the fastest outflows are found in those sources that are still deeply embedded as indicated by strong mid-infrared silicate absorptions. However, as already noted by Aalto et al. (2015b), González-Alfonso et al. (2015) find that silicate absorptions are biased toward relatively unobscured mid-infrared emitting re-gions, again indicating that the HCN-vib is actually tracing a more extreme form of obscuration.
5. Conclusions
We explore a possible correlation between the strength of molec-ular outflows in the far-infrared OH 119 µm lines and the lumi-nosity of rotational lines of vibrationally excited HCN. A sim-ple comparison of HCN-vib line luminosities, normalized to the total infrared luminosity of the host galaxy, and the median ve-locities of OH 119 µm absorption lines shows that galaxies with unusually bright HCN-vib emission tend to lack fast molecular outflows, but that galaxies without fast outflows do not neces-sarily have bright HCN-vib emission. This may be an orienta-tion effect or something that reflects a true difference between the sources, for example that the most obscured sources cannot drive wide-angle outflows or that their outflows are young and have not yet dispersed the nuclear gas and dust concentrations. Following Aalto et al. (2015b), we present an evolutionary se-quence, that may apply to some of the sources, in which bright HCN-vib emission is tracing extremely obscured nuclei in a phase that occurs before the onset of wide-angle outflows. Once these massive outflows have been launched, they quickly disrupt the deeply embedded regions responsible for the bright HCN-vib emission. We note, however, that more studies are needed in order to extend the sample and explore the relation further. As the Herschel Space Observatory, which was used for the OH out-flow measurements, is no longer operational, such studies should concentrate on observations of HCN-vib in galaxies which have already been observed in the OH 119 µm doublet. Another pos-sibility is to search for hidden outflows using the radio lines of OH, either in its ground state (Baan et al. 1989) or in rotationally excited states (Falstad et al. 2018).
Acknowledgements. This paper makes use of the following ALMA data: ADS/JAO.ALMA#2015.1.00708.S, ADS/JAO.ALMA#2016.1.00140.S. ALMA is a partnership of ESO (representing its member states), NSF (USA) and NINS (Japan), together with NRC (Canada), MOST and ASIAA (Taiwan), and KASI (Republic of Korea), in cooperation with the Republic of Chile. The Joint ALMA Observatory is operated by ESO, AUI/NRAO and NAOJ. This research has made use of the NASA/IPAC Extragalactic Database (NED), which is operated by the Jet Propulsion Laboratory, California Institute of Technology, under contract with the National Aeronautics and Space Administration.
References
Aalto, S., Garcia-Burillo, S., Muller, S., et al. 2015a, A&A, 574, A85 Aalto, S., Martín, S., Costagliola, F., et al. 2015b, A&A, 584, A42
Aladro, R., König, S., Aalto, S., et al. 2018, A&A, 617, A20 Arce, H. G. & Sargent, A. I. 2006, ApJ, 646, 1070
Baan, W. A., Haschick, A. D., & Henkel, C. 1989, ApJ, 346, 680 Baan, W. A., Salzer, J. J., & LeWinter, R. D. 1998, ApJ, 509, 633 Barcos-Muñoz, L., Aalto, S., Thompson, T. A., et al. 2018, ApJ, 853, L28 Barcos-Muñoz, L., Leroy, A. K., Evans, A. S., et al. 2015, ApJ, 799, 10 Bieging, J. H. 2001, ApJ, 549, L125
Codella, C., Cabrit, S., Gueth, F., et al. 2014, A&A, 568, L5 Efstathiou, A., Pearson, C., Farrah, D., et al. 2014, MNRAS, 437, L16 Falstad, N., Aalto, S., Mangum, J. G., et al. 2018, A&A, 609, A75
Falstad, N., González-Alfonso, E., Aalto, S., & Fischer, J. 2017, A&A, 597, A105
Falstad, N., González-Alfonso, E., Aalto, S., et al. 2015, A&A, 580, A52 Ferrarese, L. & Merritt, D. 2000, ApJ, 539, L9
Fischer, J., Sturm, E., González-Alfonso, E., et al. 2010, A&A, 518, L41 Fluetsch, A., Maiolino, R., Carniani, S., et al. 2018, arXiv e-prints
[arXiv:1805.05352]
García-Burillo, S., Combes, F., Usero, A., et al. 2015, A&A, 580, A35 Gebhardt, K., Bender, R., Bower, G., et al. 2000, ApJ, 539, L13
Ginsburg, A. & Mirocha, J. 2011, PySpecKit: Python Spectroscopic Toolkit, As-trophysics Source Code Library
Goicoechea, J. R., Joblin, C., Contursi, A., et al. 2011, A&A, 530, L16 González-Alfonso, E., Armus, L., Carrera, F. J., et al. 2017a, PASA, 34, e054 González-Alfonso, E., Fischer, J., Graciá-Carpio, J., et al. 2012, A&A, 541, A4 González-Alfonso, E., Fischer, J., Spoon, H. W. W., et al. 2017b, ApJ, 836, 11 González-Alfonso, E., Fischer, J., Sturm, E., et al. 2015, ApJ, 800, 69 Hopkins, P. F., Hernquist, L., Cox, T. J., Robertson, B., & Springel, V. 2006,
ApJS, 163, 50
Hughes, D. H., Serjeant, S., Dunlop, J., et al. 1998, Nature, 394, 241 Imanishi, M. & Nakanishi, K. 2013, AJ, 146, 91
Imanishi, M., Nakanishi, K., & Izumi, T. 2016a, AJ, 152, 218 Imanishi, M., Nakanishi, K., & Izumi, T. 2016b, ApJ, 825, 44 Imanishi, M., Nakanishi, K., & Izumi, T. 2018, ApJ, 856, 143 Kim, D.-C., Veilleux, S., & Sanders, D. B. 1998, ApJ, 508, 627 Konigl, A. & Pudritz, R. E. 2000, Protostars and Planets IV, 759 Kormendy, J. & Ho, L. C. 2013, ARA&A, 51, 511
Lahuis, F., Spoon, H. W. W., Tielens, A. G. G. M., et al. 2007, ApJ, 659, 296 Lucas, R. & Cernicharo, J. 1989, A&A, 218, L20
Magorrian, J., Tremaine, S., Richstone, D., et al. 1998, AJ, 115, 2285 Maloney, P. R., Hollenbach, D. J., & Tielens, A. G. G. M. 1996, ApJ, 466, 561 Martín, S., Aalto, S., Sakamoto, K., et al. 2016, A&A, 590, A25
McMullin, J. P., Waters, B., Schiebel, D., Young, W., & Golap, K. 2007, in As-tronomical Society of the Pacific Conference Series, Vol. 376, AsAs-tronomical Data Analysis Software and Systems XVI, ed. R. A. Shaw, F. Hill, & D. J. Bell, 127
Meijerink, R., Spaans, M., Loenen, A. F., & van der Werf, P. P. 2011, A&A, 525, A119
Menten, K. M., Wyrowski, F., Keller, D., & Kami´nski, T. 2018, A&A, 613, A49 Moshir, M., Kopman, G., & Conrow, T. A. O. 1992, IRAS Faint Source Survey,
Explanatory supplement version 2
Ott, S. 2010, in Astronomical Society of the Pacific Conference Series, Vol. 434, Astronomical Data Analysis Software and Systems XIX, ed. Y. Mizumoto, K.-I. Morita, & M. Ohishi, 139
Pérault, M. 1987, PhD thesis, PhD dissertation, Université Paris VII, (1987) Pilbratt, G. L., Riedinger, J. R., Passvogel, T., et al. 2010, A&A, 518, L1 Poglitsch, A., Waelkens, C., Geis, N., et al. 2010, A&A, 518, L2 Privon, G. C., Aalto, S., Falstad, N., et al. 2017, ApJ, 835, 213 Rolffs, R., Schilke, P., Wyrowski, F., et al. 2011, A&A, 529, A76 Sakamoto, K., Aalto, S., Barcos-Muñoz, L., et al. 2017, ApJ, 849, 14
Sakamoto, K., Aalto, S., Evans, A. S., Wiedner, M. C., & Wilner, D. J. 2010, ApJ, 725, L228
Sakamoto, K., Aalto, S., Wilner, D. J., et al. 2009, ApJ, 700, L104
Sanders, D. B., Mazzarella, J. M., Kim, D.-C., Surace, J. A., & Soifer, B. T. 2003, AJ, 126, 1607
Sanders, D. B. & Mirabel, I. F. 1996, ARA&A, 34, 749
Sanders, D. B., Phinney, E. S., Neugebauer, G., Soifer, B. T., & Matthews, K. 1989, ApJ, 347, 29
Sanders, D. B., Scoville, N. Z., & Soifer, B. T. 1991, ApJ, 370, 158 Sanders, D. B., Soifer, B. T., Elias, J. H., et al. 1988a, ApJ, 325, 74
Sanders, D. B., Soifer, B. T., Elias, J. H., Neugebauer, G., & Matthews, K. 1988b, ApJ, 328, L35
Simpson, J. M., Smail, I., Swinbank, A. M., et al. 2012, MNRAS, 426, 3201 Smail, I., Ivison, R. J., & Blain, A. W. 1997, ApJ, 490, L5
Solomon, P. M. & Vanden Bout, P. A. 2005, ARA&A, 43, 677
Spilker, J. S., Aravena, M., Béthermin, M., et al. 2018, Science, 361, 1016 Spoon, H. W. W., Farrah, D., Lebouteiller, V., et al. 2013, ApJ, 775, 127 Strauss, M. A., Huchra, J. P., Davis, M., et al. 1992, ApJS, 83, 29 Urrutia, T., Lacy, M., & Becker, R. H. 2008, ApJ, 674, 80
Veilleux, S., Kim, D.-C., Sanders, D. B., Mazzarella, J. M., & Soifer, B. T. 1995, ApJS, 98, 171
Veilleux, S., Meléndez, M., Sturm, E., et al. 2013, ApJ, 776, 27 Véron-Cetty, M.-P. & Véron, P. 2001, A&A, 374, 92
N. Falstad et al.: Hidden or missing outflows in highly obscured galaxy nuclei?
Appendix A: Vibrationally excited HCN in IRAS 15250+3609
The ULIRG IRAS 15250+3609 was observed in the HCO+
J =3–2 line by Imanishi et al. (2016a). They interpreted a peak close to the expected position of the HCN-vib line as an out-flow signature in the HCO+ line. Their interpretation is
sup-ported by the fact that similar features are seen in the HCN J =3–2 and J = 4–3 lines (Imanishi et al. 2016a, 2018). How-ever, relative to the main lines, the sub-peak close to the HCO+ line is stronger than the one close to the HCN line. This could be due to differing abundances or excitation in the outflowing gas but it could also be a contribution from HCN-vib. Further-more, IRAS 15250+3609 has a high equivalent width in the OH 65 µm doublet (González-Alfonso et al. 2015), indicating that the galaxy is highly obscured, as well as an HCN absorption at 14 µm (Lahuis et al. 2007). Here, we have attributed the feature as completely due to HCN-vib emission, but it is likely that it is indeed blended with an HCO+outflow signature and the value given here should be considered an upper limit to the HCN-vib luminosity.
Appendix B: Previously unpublished HCN-vib detections
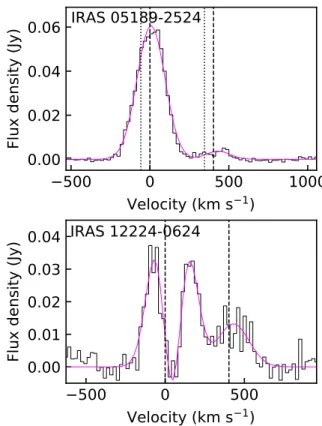
We found two sources with previously unpublished detections of HCN-vib in the ALMA science archive, IRAS 12224-0624 (project 2015.1.00708.S, PI: L. Armus), and IRAS 05189-2524 (project 2016.1.00140.S, PI: D. Iono). The observations of IRAS 05189-2524 were conducted during two runs on 2016 November 12 and 15 with a total of 42 antennas with baseline lengths ranging between 15.1 m and 1.0 km. A spectral win-dow centered at 341.8 GHz covered a bandwidth of 1.875 GHz (∼1650 km s−1at the frequency of HCN-vib J = 4–3), with a
fre-quency resolution of 3.9 MHz. During both runs J0522-3627 was used as bandpass and flux calibrator, and J0457-2324 was used as phase calibrator. The total on-source time of the observations was 3340 s and the final sensitivity achieved was 0.5 mJy beam−1 per 20 km s−1 (∼24 MHz) channel. For the imaging we used
Briggs weighting with a robustness factor of 0.5. The resulting beam size is 0.29′′ ×0.22′′(PA ∼63◦).
The observations of IRAS 12224-0624 were conducted dur-ing a sdur-ingle run on 2016 April 27 with a total of 38 antennas with baseline lengths ranging between 15.1 m and 452.8 m. A spectral window centered at 347.4 GHz covered a bandwidth of 1.875 GHz (∼1600 km s−1 at the frequency of HCN-vib J =
4–3), with a frequency resolution of 3.9 MHz. The calibrators used were J1256-0547, which was used for bandpass and flux calibration, and J1246-0730, which was used for phase calibra-tion. The total on-source time of the observations was 395 s and the final sensitivity achieved was 1.5 mJy beam−1per 20 km s−1
(∼24 MHz) channel. For the imaging we used Briggs weight-ing with a robustness factor of 0.5. The resultweight-ing beam size is 0.51′′ × 0.44′′(PA ∼82◦).
For both sources, the Common Astronomy Software Ap-plications (CASA; McMullin et al. 2007) package was used to reapply the calibration and perform imaging. The line fluxes used to calculate the HCN-vib luminosities were then found by fitting Gaussians to the HCO+ and HCN-vib lines in
tra that were spatially integrated over the sources. These spec-tra are presented in Fig. B.1. We note that the wavelengths of the HCO+ and HCN-vib lines in IRAS 05189-2524 are offset
from those expected when using the redshift of 0.0426 adopted by Veilleux et al. (2013). They are however consistent with the
redshift of ∼0.0428 found from the CO J = 1–0 observations reported by Sanders et al. (1991). Using this redshift instead of the one adopted by Veilleux et al. (2013) to determine the me-dian OH absorption velocity results in an extra velocity shift of −45 km s−1.
−500
0
500
1000
Velocity (km s
−1
)
0.00
0.02
0.04
0.06
Flu
d
en
sit
y (
Jy)
IRAS 05189-2524
−500 0 500 Velocity(km s
−1
)
0.00
0.01
0.02
0.03
0.04
Flu
x d
en
sit
(
J )
IRAS 12224
-0624Fig. B.1. Spectral fits to the HCO+and HCN-vib J = 4–3 lines in the
two galaxies IRAS 05189-2524 and IRAS 12224-0624. The solid black histograms represent the data and the solid magenta lines are the best fits to the data. The velocity scale is set relative to the frequency of the HCO+ J = 4–3 line. Dashed vertical lines indicate the expected
positions of the HCO+and HCN-vib J = 4–3 lines given the adopted
redshifts. The dotted lines in the plot for IRAS 05189-2524 indicate the expected positions given the redshift adopted by Veilleux et al. (2013).
Appendix C: New OH outflow measurements
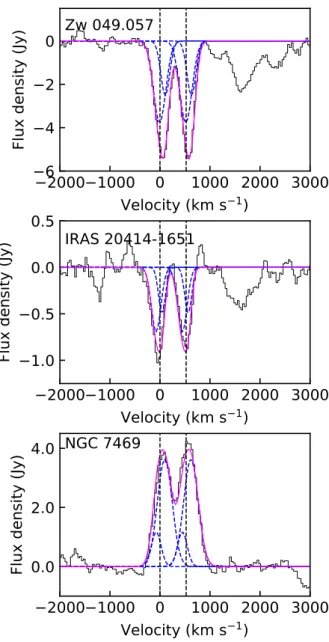
Three of the sources with existing HCN-vib observations also had observations of the OH doublet at 119 µm taken with the Photodetector Array Camera and Spectrometer (PACS; Poglitsch et al. 2010) on Herschel but were not included in the sample of Veilleux et al. (2013). The observations of Zw 049.057 (OBSID: 1342248368, PI: E. González-Alfonso) were conducted on 2012 July 20 for a duration of 1478 s, the observations of IRAS 20414-1651 (OBSID: 1342217908, PI: D. Farrah) were conducted on 2011 April 5 for a duration of 8879 s, and the observations of NGC 7469 (OBSID: 1342235840, PI: E. González-Alfonso) were conducted on 2011 December 31 for a duration of 1086 s. All observations were performed in high spectral sampling, range spectroscopy mode. The observations had been processed with version 14.2 of the standard pipeline and were not in need of reprocessing. In all sources, the nu-clear far-IR emission is spatially unresolved in the central 9.4′′
(∼2 kpc) spaxel of the PACS 5 x 5 spaxel array. As the cen-tral PACS spaxel is smaller than the point spread function of the spectrometer, the spectrum was extracted using the point source correction task in the Herschel interactive processing
environ-ment (HIPE; Ott 2010) version 14.0.1. Before analyzing the ab-sorption lines, polynomials of order two were fitted to the con-tinuum and then subtracted from the spectra. For consistency, the profiles of the 119 µm OH doublets were modeled using the same procedure as in Veilleux et al. (2013). Each line was fit-ted with two Gaussian components characterized by their ampli-tude, position, and width. The separation between the two lines of the doublet was fixed at 0.208 µm in the rest frame and the amplitude and width of the two lines were the same for each component. The median velocities of the absorptions (v50(abs))
were then determined from these fits. The fitting procedure was carried out using the spectroscopic analysis toolkit PySpecKit (Ginsburg & Mirocha 2011) and the continuum subtracted spec-tra with the fits overplotted are presented in Fig. C.1.
−2000−1000 0 1000 2000 3000 Velocity
(km s
1
)
6
4
2
0
Flu
x d
en
sit
y (
Jy)
Zw 049.057
−2000−1000 0 1000 2000 3000 Velocity(km s
−1
)
−1.0
−0.5
0.0
0.5
Flu
x d
en
sit
(
J )
IRAS 20414
-1651 −2000−1000 0 1000 2000 3000 Velocity(km s
1
)
0.0
2.0
4.0
Flu
x d
en
sit
y (
Jy)
NGC 7469
Fig. C.1. Spectral fits to the OH 119 µm absorption lines in the galaxies Zw 049.057, IRAS 20414-1651, and NGC 7469. The solid black his-tograms represent the data, the solid magenta lines are the best multi-component fits to the data, and the dashed blue lines are the individual components. The velocity scale is set relative to the frequency of the blue component of the doublet. Dashed vertical lines indicate the ex-pected positions of the two absorption components given the adopted redshifts.