HAL Id: hal-02297668
https://hal.sorbonne-universite.fr/hal-02297668
Submitted on 26 Sep 2019
HAL is a multi-disciplinary open access
archive for the deposit and dissemination of
sci-entific research documents, whether they are
pub-lished or not. The documents may come from
L’archive ouverte pluridisciplinaire HAL, est
destinée au dépôt et à la diffusion de documents
scientifiques de niveau recherche, publiés ou non,
émanant des établissements d’enseignement et de
CARE-rCortex: a Matlab toolbox for the analysis of
CArdio-REspiratory-related activity in the Cortex
F. Grosselin, X. Navarro-Sune, M. Raux, T. Similowski, M. Chavez
To cite this version:
F. Grosselin, X. Navarro-Sune, M. Raux, T. Similowski, M. Chavez. CARE-rCortex: a Matlab
tool-box for the analysis of CArdio-REspiratory-related activity in the Cortex. Journal of Neuroscience
Methods, Elsevier, 2018, 308, pp.309-316. �10.1016/j.jneumeth.2018.08.011�. �hal-02297668�
CARE-rCortex: a Matlab toolbox for the analysis of
CArdio-REspiratory-related activity in the Cortex
F. Grosselina,b,∗, X. Navarro-Suneb,c, M. Rauxc,d, T. Similowskic,e, M. Chavezf
aSorbonne Universit´es, UPMC Univ. Paris 06, INSERM U-1127, CNRS UMR-7225, Institut du Cerveau et de la Moelle
´
Epini`ere (ICM), Groupe Hospitalier Piti´e Salpˆetri`ere-Charles Foix, 75013, Paris, France
bmyBrainTechnologies, 75010, Paris, France
cSorbonne Universit´es, UPMC Univ. Paris 06, INSERM UMRS1158, Neurophysiologie Respiratoire Exp´erimentale et
Clinique, 75005, Paris, France
dAP-HP, Groupe Hospitalier Piti´e Salpˆetri`ere-Charles Foix, D´epartement d’Anesth´esie-R´eanimation, 75013, Paris, France eAP-HP, Groupe Hospitalier Piti´e Salpˆetri`ere-Charles Foix, Service de Pneumologie et R´eanimation M´edicale du
D´epartement R3S, 75013, Paris, France
fCNRS UMR-7225, Groupe Hospitalier Piti´e-Salpˆetri`ere-Charles Foix, 75013, Paris, France
Abstract
Background: Although cardio-respiratory (CR) system is generally controlled by the autonomic nervous system, interactions between the cortex and these primary functions are receiving an increasing interest in neurosciences. New method: In general, the timing of such internally paced events (e.g. heartbeats or respiratory cycles) may display a large variability. For the analysis of such CR event-related EEG potentials, a baseline must be correctly associated to each cycle of detected events. The open-source toolbox CARE-rCortex provides an easy-to-use interface to detect CR events, define baselines, and analyse in time-frequency (TF) domain the CR-based EEG potentials. Results: CARE-rCortex provides some practical tools to detect and validate these CR events. Users can define baselines time-locked to a phase of respiratory or heart cycle. A statistical test has also been integrated to highlight significant points of the TF maps with respect to the baseline. We illustrate the use of CARE-rCortex with the analysis of two real cardio-respiratory datasets. Comparison with existing methods: Compared to other open-source toolboxes, CARE-rCortex allows users to automatically detect CR events, to define and check baselines for each detected event. Different baseline normalizations can be used in the TF analysis of EEG epochs. Conclusions: The analysis of CR-related EEG activities could provide valuable information about cognitive or pathological brain states. CARE-rCortex runs in Matlab as a plug-in of the EEGLAB software, and it is publicly available athttps://github.com/FannyGrosselin/CARE-rCortex.
Keywords: EEG, cardio-respiratory event-related potentials, Event-Related Desynchronization (ERD), Event-Related Synchronization (ERS)
1. Introduction
Interactions between brain and cardiac or respi-ratory activity is receiving an increasing interest in
∗Corresponding author: grosselin.fanny@gmail.com
neurosciences (Dubois et al., 2016; Perakakis et al.,
2017). These primary functions are controlled by the autonomic nervous system, particularly the medulla oblongata and the pons (Bianchi et al.,1995) for the respiration. The medulla oblongata also plays an im-portant role in cardiac activities with ganglia along
Figure 1: Example of respiratory event-related potential. Av-eraged amplitude across the epochs of the central EEG activity (Cz electrode) of a subject during spontaneously breathing (in red) or during an inspiratory load task (in blue). The dashed vertical line indicates the inspiration onset.
the cervical and thoracic spinal cord (Shen and Zipes,
2014). However, specific events can modulate the cardio-respiratory (CR) system through the cortex. In humans, the breathing function can be modulated by emotions or any external constraint limiting the airflow (e.g. desynchronization between a patient’s breathing and the airflow delivered by a ventilator, or breathing against an inspiratory load as illustrated in Fig.1). In this case, the control of breathing comes from suprapontine structures, especially from corti-cal structures (Colebatch et al.,1991;Ramsay et al.,
1993;Straus,2005).
Changes in breathing rhythms are captured by somatosensory mechanoreceptors in the chest and are related to an activation of the cortex like other mechanoreceptors located in different locations in the body. These afferent signals impact the ongoing ef-ferent drive which regulates cardio-respiratory func-tion through a nested hierarchy of simple reflexes and more complex higher level feedback systems (Dirlich et al.,1998).
Different works have also shown an effect of these somatosensory signals on the EEG with experimental studies based on heartbeat event-related potentials. Indeed, several studies had highlighted an EEG po-tential about 300-600ms after the R-wave of the heart especially during an attentional task of focusing on the heartbeats (Montoya et al., 1993; Schandry and Montoya,1996;Dirlich et al.,1998) (see Fig.2). This potential related to afferent cardiac information re-flects the awareness of one’s own heartbeats (Gray et al.,2007).
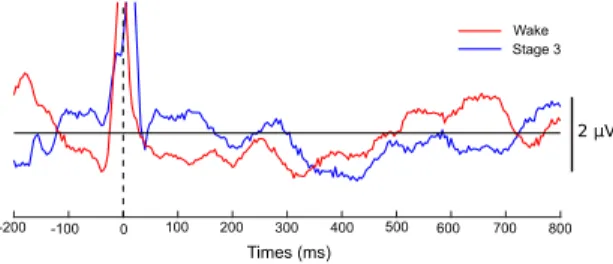
Figure 2: Example of heartbeat-related potential. Averaged amplitude of EEG signals at channel C3 in a healthy awake subject during resting state with closed eyes (in red), and dur-ing stage 3 of the sleep (in blue). The dashed line indicates the R-peak time.
All these research studies are based on evoked lated potentials (ERP), i.e. an estimate of the re-sponse that is time-locked to a stimulus. Event-related changes at different EEG frequency bands constitute an important indicator of the underlying brain processes. Sensory processing and motor be-haviour are connected, for instance, with the localized decrease of power in certain frequency bands (Durka et al., 2004). Therefore, the quantification of sig-nificant changes in the EEG time-frequency content associated to the externally/internally paced events needs a normalization with an appropriate baseline (e.g. the baseline time period should always end be-fore each trial onset).
As mentioned above, the timing of internally paced events (e.g. heartbeats or respiratory cycles) can be modulated by different internal mechanisms, hence highly variable even within a subject. To study the significance of cardio-respiratory related EEG changes, researchers need analysis tools to: i) au-tomatically detect non-regular events and, ii) define a baseline correctly locked to each detected event.
EEGLAB (Delorme and Makeig, 2004) is a well-known interactive Matlab (The Mathworks, Inc., MA) toolbox for processing electrophysiological data. It proposes different easy-to-use tools for single chan-nel time-frequency (TF) representation, such as a baseline-normalized spectrogram or the analysis of event-related power changes (Makeig, 1993). Field-Trip (Oostenveld et al., 2010) is another Matlab based toolbox that also provides TF analysis by ap-plying a normalization with respect to a fixed baseline
interval. ERPWAVELAB (Mørup et al., 2007) also proposes a tool to analyse event-related potentials in both EEG and magneto-encephalography (MEG) data in TF domain. As additional features, ERP-WAVELAB offers the possibility of performing multi-subject and multiple condition analysis and provides tools for artefact rejection in TF domain.
However, all these tools do not provide event de-tection from cardio-respiratory signals and do not lock baseline to time-variable events. HEPLAB ( Per-akakis and Ciria,2018) was recently introduced to fa-cilitate heartbeat evoked potential (HEP) analysis. It computes heartbeat-evoked events in EEGLAB from continuous EEG signals using R events. These events are automatically detected by means of an external toolbox, ECGLAB (Vicente et al., 2013). FieldTrip is then recommended for statistical analysis between groups and conditions. Another Matlab based tool-box, ECG-kit (Demski and Soria,2016), includes sev-eral algorithms to detect heartbeats and pulse, clas-sifies cardiac events and provides an ECG delineator. However, these tools are limited to the analysis of ECG activities in time domain.
In this work, we propose a new toolbox, CARE-rCortex, that includes useful features to analyse the EEG potentials related to cardiac or breath-ing rhythms. It proposes an automated detection and validation of CR events such as the heart-beats, and the breathing cycles. Using detected events, users can define a time-locked optimal base-line. CARE-rCortex also integrates a manual valida-tion of baseline locavalida-tion to correct possible misplace-ments. Moreover, TF maps are purposely designed for frequency bands of interest, and can be normal-ized by the baseline time-locked to the chosen CR events.
The paper is structured as follows. Firstly, an overview of the main functionalities of our toolbox is presented. This is followed by a brief description of the methods implemented in the toolbox (event de-tection, baseline management, time-frequency maps and significance analysis). Finally, we illustrate the usefulness of CARE-rCortex with the analysis of two real cardio-respiratory datasets.
2. Methods
2.1. Toolbox overview
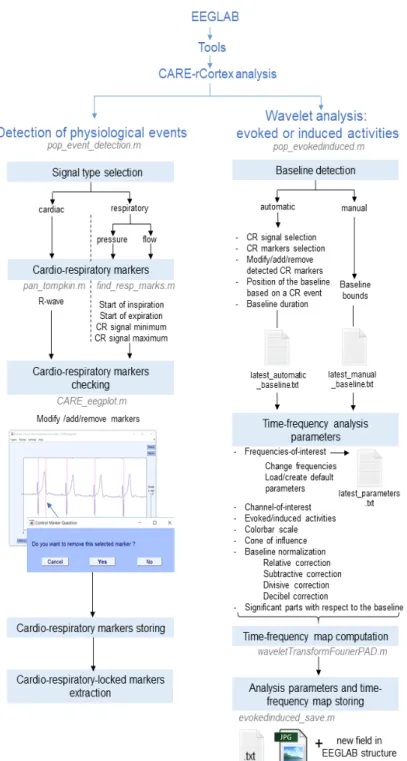
CARE-rCortex was designed as a plug-in for EEGLAB software using Matlab graphical user in-terface (GUI). The GUI allows users to analyse data interactively without Matlab programming experi-ence, although experienced users can also run CARE-rCortex functions from the command line. To start using our toolbox, EEG or other electrophysiolog-ical data have to be firstly loaded into EEGLAB workspace. Depending on the data format, some sup-plementary packages could be required by EEGLAB. 2.1.1. Detection of events and creation of markers
After loading the data, EEG epochs have to be ex-tracted with respect to a CR event. These markers are generally selected as time-locking event type(s) during the extraction of epochs by EEGLAB. Be-cause the markers are not always related to CR recordings, CARE-rCortex provides a tool to de-tect CR events and create the corresponding markers (Fig. 3). Namely, our toolbox allows the detection of: i) the R-wave of the QRS complex in the ECG signals; or ii) different respiratory events such as the inspiration or expiration onsets, the maxima or min-ima of the respiratory pressure or airflow signals. Be-fore saving them as markers for EEGLAB, a manual validation of the detected events can be done. Dur-ing this validation, events can be added, modified or deleted.
2.1.2. Artefact reduction
EEG recordings are often contaminated by non-neural physiological activities, as well as other ex-ternal or environmental noises, that seriously de-grade the signals of interest (Urig¨uen and Garcia-Zapirain,2015). Such perturbations include classical eye movements and muscular-related activities, but also breathing or heart cycle-related artefacts. The heart’s electrical activity for instance, can be mea-sured anywhere on the body surface and can also be observed in EEG recordings along with brain elec-tric components. This inherent artefact, termed car-diac field artefact (CFA), is most prominent during ventricular depolarization (QRS complex), and it is
characterized by a sharp potential synchronized to the R-peak, corresponding to the onset of ventricular contraction (Dirlich et al.,1997,1998).
Since the user can take advantage of the built-in EEGLAB functions or other external plug-built-ins for artefact reduction, CARE-rCortex does not provide further tools for such purpose. For instance, “Reject data epochs” or “Reject continuous data” functions can be used to reject EEG segments contaminated with muscle, ocular or head movements-related arte-facts. Spatial filters or independent component anal-ysis (ICA) can effectively remove interferences from a wide variety of artefactual sources in EEG record-ings, including CFA, but only when the number of channels and the amount of data are large enough (Urig¨uen and Garcia-Zapirain,2015).
For epoched EEG analysis, different template sub-traction methods can also be used to reduce the CFA (Debener et al.,2009). Nevertheless, such meth-ods assume a lack of correlation between neural ac-tivity and cardiac acac-tivity and a temporal stability of the artefact, which may result in inaccurate artefact estimation and therefore lead to greater residual con-tamination after subtraction (Debener et al.,2009). 2.1.3. Baseline management
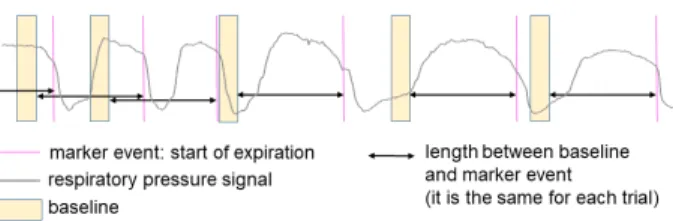
To analyse CR event-related potentials, a baseline is usually removed from EEG epochs. The baseline term refers to the basal EEG activity when no ac-tions are being prepared, and is usually selected from a period sufficiently far from the onset of the event of interest. To analyse pre-expiration potentials, for in-stance, a baseline should be chosen at the beginning of the inspiration time. In most of the studies, the baseline is the same for each epoch and it is charac-terized by its length and its position from the marker event. Nevertheless, when CR events are studied, some baseline periods may overlap the targeted ac-tivity in previous or posterior cycles (see an example in Fig. 4).
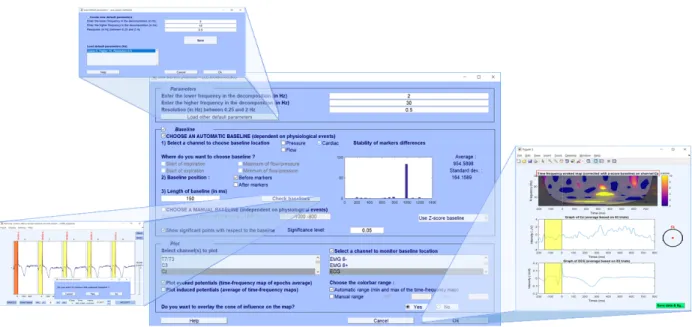
Our toolbox allows researchers to define and cor-rect the baseline of CR events through a GUI inter-face (Fig. 5). This can be done either manually or automatically according to the detected CR cycles. To accurately define the baseline of detected events, CARE-rCortex displays a histogram of time distances
between consecutive markers. Baseline lengths and their positions can be thus chosen as a function of the distances between CR events. The automatic setting of baselines can be easily checked with an interactive plot, allowing the user to remove or add baselines by simply clicking on the plot. Of note, epochs must have only one baseline, located between its start and the event marker. Otherwise, a warning message sug-gests solutions to fix the problem.
Figure 4: Example of improper baseline selection for a res-piratory pressure signal. To analyse pre-exres-piratory activity, baselines should be placed in the pre-inspiratory period of the pressure cycle (as it is the case for the 4thbaseline). In this
ex-ample, some baselines are either located in the previous cycle or out of the pre-inspiratory period (1st, 2nd and 3rd base-lines).
2.1.4. Time-frequency maps
The parametrization of the TF analysis can be done within the same GUI interface. Researchers can select the frequency range of interest for the analysis as well as the frequency resolution. By default, the minimal frequency resolution is set at 0.25 Hz, and the lowest frequency at 2 Hz, for a fast and optimal EEG potential analysis related to CR events.
The GUI of CARE-rCortex allows researchers to plot the result of time-frequency analysis (Fig. 3and
5). For a given EEG channel, the time-frequency analysis can be performed in two different ways (Tallon-Baudry and Bertrand, 1999): either time-frequency map of epoch average (evoked activities) or the average of time-frequency maps (induced ac-tivities). For each TF map, a cone of influence can be also displayed to delimit the TF region not influenced by edge effects (Torrence and Compo,1998). For the selected channels, CARE-rCortex can also display the EEG epoch average with the median baseline region indicated on the plot.
Figure 5: The Graphical User Interface of the CARE-rCortex toolbox.
Different parameters of the time-frequency anal-ysis, baseline location and length can be loaded or saved in external configuration files. CARE-rCortex will load these values in forthcoming user sessions. Users can also export figures containing frequency maps with the results. Finally, time-frequency data and the corresponding significant masks are automatically saved into a new EEGLAB data structure field.
2.2. Methods implemented in the analysis 2.2.1. Cardio-respiratory event detection
To detect cardiac events (R peaks in QRS com-plex), we adopted Pan-Tompkins’s algorithm (Pan and Tompkins, 1985), using the Matlab implemen-tation done by (Sedghamiz, 2014). This is a real-time algorithm that reliably recognizes QRS complex based on the analysis of slope, amplitude and width. The algorithm automatically adjusts thresholds and parameters to be adapted to ECG changes such as QRS morphology and heart rate (Pan and Tompkins,
1985). Breathing cycles are detected using a peak de-tector, adapting the algorithm described in (Navarro et al.,2015) to both air flow and pressure signals.
2.2.2. Baseline management
A baseline period is associated to each CR event detected by the previously mentioned algorithms. The baseline length can be chosen by the user. To check that each baseline is placed before or after a given event, we implemented a functionality to visu-alize and manage the baselines. This function was inspired from eegplot, an EEGLAB script to visualize and check the EEG signal in each epoch.
2.2.3. Time-frequency analysis
Morlet wavelet decomposition. The wavelet trans-form (WT) is a useful analysis tool for time-frequency representation of non-stationary signals, obtained by convolving the signal s with a scaled and translated wavelet function (Mallat, 1998). The WT provides thus a decomposition of the signal variance at dif-ferent scales. Although continuous wavelets often yield a redundant decomposition of analysed signals (the information extracted from a given scale band slightly overlaps with that from neighbouring scales), they are more robust to noise as compared with other decomposition schemes (Mallat, 1998; Torrence and Compo,1998). The complex Morlet wavelet
decom-position is employed in the toolbox as it provides a very good time localization with a high frequency resolution. In addition, the Morlet wavelet has the advantage of having both real and imaginary parts, which allows a separation of the phase and the am-plitude of the studied signal (Schiff et al., 1994;van Vugt et al.,2007).
Cone of influence. For finite-length time series, nu-merical errors in the wavelet spectrum will occur at the beginning and at the end of the segment. The area of the TF map where such effects are relevant, the so-called cone of influence, is chosen here as the e-folding time (the wavelet power for a discontinu-ity at the edges drops by a factor e−2) of the Morlet wavelet function (Torrence and Compo, 1998). Two TF representations. CARE-rCortex allows re-searchers to obtain two time-frequency representa-tions of event-related EEG responses (Tallon-Baudry and Bertrand,1999):
• Evoked cortical activities are characterized by precise time-locking to the stimulus onset. They are obtained by estimating the wavelet power spectrum of the signal that results from the av-erage of all the N single EEG epochs Ei. To
as-sess significant changes in the TF spectrum, the baseline correction is applied on the final wavelet transform.
• In contrast to the evoked response, induced ac-tivities are characterized by a temporal shift from epoch to epoch (Grandchamp and Delorme,
2011). No phase relationship is assumed between the oscillatory responses and the stimulus on-set. Hence, these activities cannot be revealed by classical averaging techniques. To analyse these induced activities, the wavelet power spectrum is firstly obtained for each Ei, then averaged.
Fol-lowing (Grandchamp and Delorme,2011), signif-icance test can be obtained by applying a base-line correction for each Ei before the averaging.
Normalization of TF maps. To normalize the result-ing TF spectrum by a baseline, four approaches are available:
• Relative baseline: the mean and standard devi-ation are calculated inside the baseline for each frequency band in the TF map. Such values are used to normalize all time points at each fre-quency to provide a time-frefre-quency map in stan-dard deviations (a z-score) of the values observed during the baseline.
• Subtractive baseline: consists in removing the mean of the baseline from each frequency band of the TF map (Grandchamp and Delorme,2011). • Divisive baseline: normalized TF maps are ob-tained by the ratio between the wavelet power spectrum and the mean of the baseline obtained at each frequency.
• Decibel baseline: is the result of ten times the log-transformed divisive baseline correction (Grandchamp and Delorme, 2011). Changes in the TF maps are expressed in decibels (dB). Baseline correction based on permutation methods to assess significant differences. To find the signif-icant time-frequency points with respect to the cho-sen baseline, we use a permutation (non-parametric) method inspired from (Grandchamp and Delorme,
2011). Briefly, this method consists in randomly se-lecting a baseline period within the epochs limits and then applying them to other (different) randomly se-lected epochs. We repeat this procedure N p = 200 times to have the same number of time-frequency sur-rogate distributions and hence obtain the histograms of the mean values across time for each frequency bin. Then, values on the original induced time-frequency map lying outside the 100*α % of the tails are con-sidered as statistically different with respect to the baseline at a significant level p < α. To take into account the multiple comparisons problem, α is di-vided by the number of time samples according to the Bonferroni correction.
For evoked activity, since time-frequency maps are not computed by epoch Ei, surrogate distributions
are obtained as follows: First, N p subsets contain-ing N /2 epochs randomly selected are formed. Each subset is averaged, then transformed to an evoked time-frequency map that is baseline-corrected. As
the permutation approach above, baseline period is placed randomly within an epoch then permuted with that from another evoked TF map.
3. Case studies using real data
To illustrate the utility of the proposed tool-box, we used data from two different databases that include EEG and cardio-respiratory record-ings. We firstly used CARE-rCortex to com-pare time-frequency maps from EEGs in two dif-ferent respiratory conditions: normal breathing ver-sus forced breathing. In a second example, we used a polysomnography recording from the Phys-ionet database to compare heartbeat activity at dif-ferent sleep stages. Likewise, each case use was im-plemented using a different event-related approach: evoked activity to compare respiratory conditions, and induced activity to assess heartbeat potentials. 3.1. Respiratory analysis
Protocol and data. This study was carried out on healthy subjects breathing through a mouthpiece (see (Hudson et al., 2016) for a detailed description of the protocol, ethical approval and recording de-vices). EEG signals were recorded by surface elec-trodes along with the breathing activity using a pneu-motachograph at 2500 Hz sampling rate. We selected respiratory pressure and Cz channel data from one subject during normal breathing (10 minutes) and inspiratory load (10 minutes). The experiment was designed to simulate breathing discomfort in ven-tilated patients when the mechanical ventilator is improperly adjusted. Breathing discomfort implies brain state changes that can be detected and studied by analysing the EEG activity (Navarro-Sune et al.,
2017).
Data processing. After importing data (the installa-tion of BVA import/export EEGLAB plug-in ( An-dreas and Delorme, 2013) is required), it was pro-cessed according to the method described by Raux et al. (Raux, 2007) and was down-sampled to 500Hz and low-pass filtered at 30Hz cut-off frequency. Respiratory marks were automatically detected by
CARE-rCortex. EEG was segmented into 3.5 sec-onds excerpts according to the respiratory marks so the pre- and post-inspiratory times were 2.5 and 1 seconds respectively. Then, the time-frequency anal-ysis was done using CARE-rCortex. Because we are interested in pre-inspiratory activities, the baseline period, of 300 ms, was applied at the start of the expiration. We studied frequencies between 2 and 30Hz with a resolution of 0.25Hz. Regions in the TF map were detected as statistically different from the baseline activity with a p < 0.01.
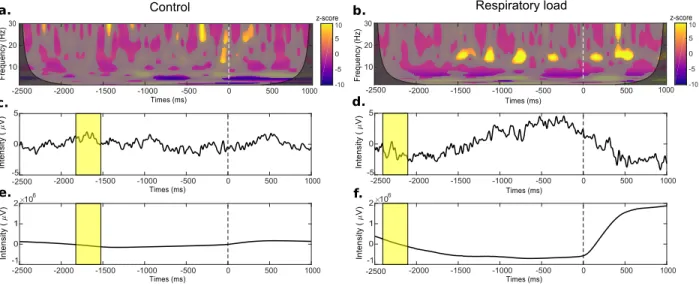
Results. The results concerning respiratory-related activity can be seen in Fig. 6-a and 6-b. Signifi-cant regions in the time-frequency plane with respect to the baseline resulted in increased z-values during inspiratory load. Indeed, the existence of a respira-tory pre-motor activity in this condition was espe-cially noticeable around 15Hz between 1500 and 500 ms before inspiratory triggers. As expected, differ-ences between the two conditions (normal and forced breathing) were also evidenced in time domain aver-aged potentials (see Fig 6-c and 6-d). On the other hand, the absence of this pre-motor activity during normal breathing can be explained by the fact that the automatic breathing is normally controlled by the brain stem. Hence, inspiratory related activity was not relevant in time-frequency maps.
3.2. Cardiac analysis
Protocol and data. We selected a subject (slp45 ) from the MIT-BIH Polysomnographic Database (see (Ichimaru and Moody, 1999)). Data were acquired during sleep for evaluation of chronic obstructive sleep apnea syndrome, and included (among other monitoring signals) one EEG (C3-O1) and ECG sig-nals sampled at 250 Hz, plus the annotated beat-by-beat and sleep stage scorings. We only analysed seg-ments corresponding to wakefulness and sleep stage 3 (the deepest sleep) as they typically present different heartbeat-related potentials (see Fig. 2).
Data processing. Firstly, a bandpass filter (cutoff fre-quencies 1-40 Hz) was applied on both EEG and ECG signals, and heart beat marks (corresponding to R
Figure 6: CARE-rCortex results of respiratory event-related EEG potentials under control versus inpiratory load conditions. TF maps of Cz activities under the control condition (a) and the load condition (b) for a healthy subject. The non-significant mask with respect to the baseline is superimposed to each of the time-frequency map. Cone of influence is displayed on each of the time-frequency map as a superimposition of the time-frequency map and its significant mask. EEG activity averaged across the epochs of Cz in each condition (control (c) versus charge (d)) with the median baseline in yellow. Averaged pressure across the epochs in each condition (control (e) versus inspiratory load (f )) with the median baseline indicated by the yellow rectangles.
peaks) were detected by using “Detect physiologi-cal events” tool of CARE-rCortex. Then, EEG was segmented into 1-second trials, from 200 milliseconds before to 800 milliseconds after each beat mark. To reduce a potential effect of cardiac field artefact, we subtracted from each trial, a template of cardiac arte-fact. Such template was obtained as the median EEG epoch estimated over adjacent cardiac cycles (given the detected beat marks). Baseline was placed be-tween -200 ms to -50 ms before the R peak detection to normalize the data by a z-score correction. Time-frequency analysis was done between 2 and 30 Hz with a frequency resolution of 0.25 Hz.
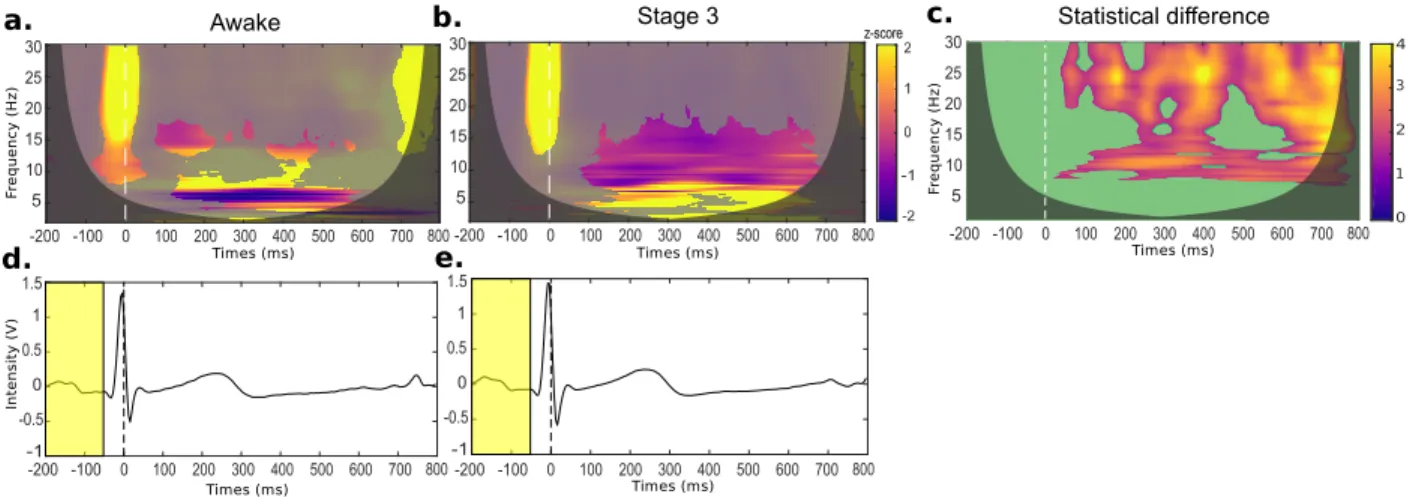
Results. Heartbeat induced activities in the EEG are depicted in Fig. 7-a and 7-b. Significant areas in the time-frequency map with respect to the base-line can be observed both in wakefulness and stage 3 sleep. Compared to wakefulness, an increase of slow (2-7 Hz) activities is clearly observed during sleep stage. Due to physiologically induced changes
in heart rate (Snisarenko,1978), an artefact template cannot be accurately estimate. This can explain that, despite the artefact reduction procedure, the large potential associated to the R-wave can still be clearly distinguished from baseline in both conditions.
Since each induced map is the average of an en-semble of time-frequency maps, we could also com-pare the differences between wakefulness and stage 3 using a permutation test (Maris and Oostenveld,
2007). In Fig. 7-c we can observe that differences are mainly associated to alpha (around f = 10 Hz) and faster activities (f > 20 Hz) between 150 and 400 ms, and beyond t = 600 ms. Although differences be-tween 150 and 400 ms could be due to differences in the propagation of ECG T-wave potentials (Dirlich et al.,1997), note that cardiac activities in that period are similar in both conditions, as shown in Figs. 7 -d-e. Differences in neural responses can therefore be explained by the slow brain activities that predomi-nate in deep sleep stages, and not by differences in heart activities. We note, however, that differences
Figure 7: Heartbeat event-related potentials during wakefulness and sleep stage 3 conditions for a healthy subject. Time-frequency maps of the EEG activity during wakefulness (a) and the sleep stage 3 (b). Unmasked color regions in time-Time-frequency maps indicate the significant activation levels with respect to the baseline (p < 0.01). The statistical differences between (a) and (b) are shown in (c), where the superimposed green mask highlights the significant differences between the two conditions. Black zones correspond to the cones of influence, i.e. regions not influenced by edge effects. Average of cardiac signals across the epochs with the median baseline (yellow rectangle), during wakefulness (d) and sleep stage 3 (e).
localized beyond t = 650 ms might be due to differ-ences in cardiac activities recorded at the end of EEG epochs.
4. Discussion and conclusion
In this paper, we have introduced an open source toolbox as an EEGLAB plug-in for EEG analysis in time-frequency domain. Contrarily to other tools that also offer TF analysis - like EEGLAB ( De-lorme and Makeig, 2004), FieldTrip (Oostenveld et al., 2010) or ERPWAVELAB (Mørup et al., 2007) - CARE-rCortex provides an easy-to-use interface to normalize TF maps with a baseline time-locked to cardio-respiratory events. Furthermore, CARE-rCortex allows the detection and the manual valida-tion of CR events, necessary to define a baseline time-locked to a phase of the heart or breathing rhythms. A statistical test has also been integrated to highlight significant points of the TF maps with respect to the baseline.
To illustrate the functionalities of our plug-in, we have studied two real cardio-respiratory datasets. For the respiratory example, we have found a central
pre-inspiratory activation of the EEG activity in inspira-tory load condition, which is absent during sponta-neous breathing. This finding corroborated the im-plication of central areas in the cortex to compensate breathing impairment (Dubois et al., 2016). For the cardiac case, an increased synchronization (with re-spect to the baseline) in delta and theta activities was found during deep sleep. When comparing the awake and the sleep conditions, the main differences were observed in the high-alpha and the fast EEG bands, in particular around ECG T-wave, which cannot be explained by differences in cardiac activities.
Brain activity changes during different cognitive or pathological brain states are involved in auto-nomic regulation. During these conditions, cardiac and respiratory autonomic modulation might par-tially depend on central nervous system modulation, allowing potential exploration of higher brain struc-ture activity through peripheral autonomic modula-tion. The analysis of cardio-respiratory-related cor-tical activities could provide valuable information about brain states in respiratory or psychiatric dis-orders, sleep/dreaming stages, etc.
Although the CARE-rCortex toolbox is designed to study EEG activities locked to heartbeats or breathing rhythms, the approach is applicable to any neuroimaging functional method (e.g. EEG, fMRI, and MEG signals) in both animal or human studies. One of the major limitations of the current toolbox concerns the detection of CR events which still needs a manual checking of the baseline locations. This is-sue could be improved in a further release. Another limitation results from artefacts recorded by the EEG electrodes. Before using CARE-rCortex, researchers can use existing plug-ins of EEGLAB to correct or reject EEG epochs contaminated with ocular or head movements, or by muscle artefacts. If several EEG channels are available, spatial filters or ICA-based methods can be applied to reduce the cardiac arte-fact. To complement the interface, other features could be implemented in the toolbox like phase syn-chrony or coherence computations. In future versions of the toolbox, we could also extend the event detec-tion to other physiological events like the isotonic or isometric contractions in electromyographic signals.
The CARE-rCortex toolbox can be freely down-loaded fromhttps://github.com/FannyGrosselin/ CARE-rCortex where a detailed tutorial explain-ing all the features of the toolbox is also avail-able. The toolbox was developed with a Matlab version (R2017b) and the last release of EEGLAB (eeglab 14 1 1b). The toolbox works on all major operating systems and is compatible with different versions of Matlab newer than R2013a.
Acknowledgments
The work of X. Navarro-Sune was supported by Air Liquide Medical Systems S.A., France.
References
Andreas W. and Delorme A., 2013. BVA im-port/export EEGLAB plugin. Matlab tool available at URL https://sourceforge.net/ projects/bva-io/
Bianchi A. L., Denavit-Saubi´e M. and Champagnat J., 1995. Central control of breathing in mam-mals: neuronal circuitry, membrane properties, and neurotransmitters. Physiol. Rev. 75(1), 1-45.
doi:10.1152/physrev.1995.75.1.1
Colebatch J. G., Adams L., Murphy K., Martin A. J., Lammertsma A. A., Tochon-Danguy H. J., Clark J. C., Friston K. J. and Guz A., 1991. Re-gional cerebral blood flow during volitional breath-ing in man. J. Physiol. 443, 91-103. doi:10.1113/ jphysiol.1991.sp018824
Debener S., Kranczioch C. and Gutberlet I., 2009. EEG Quality: Origin and Reduction of the EEG Cardiac-Related Artefact, in: Mulert C., Lemieux L. (Eds) EEG - fMRI. Springer, Berlin, Heidelberg, pp 135-151. doi:10.1007/978-3-540-87919-0 8
Delorme A., Makeig S., 2004. EEGLAB: an open source toolbox for analysis of single-trial EEG dy-namics including independent component analysis. J. Neurosci. Meth. 134(1), 9-21. doi:10.1016/ j.jneumeth.2003.10.009.
Demski A. and Soria M. L., 2016. ecg-kit: a Mat-lab Toolbox for Cardiovascular Signal Processing. Journal of Open Research Software 4(1). doi: 10.5334/jors.86.
Dirlich G., Vogl L. Plaschke, M. and Strian F., 1997. Cardiac field effects on the EEG. Electroen. Clin. Neurophysiol. 102(4), 307-315.doi:10.1016/ S0013-4694(96)96506-2.
Dirlich G., Dietl T., Vogl L. and Strian F., 1998. To-pography and morphology of heart action-related EEG potentials. Electroen. Clin. Neuro./Evoked Potentials Section 108(3), 299-305. doi:10.1016/ S0168-5597(98)00003-3.
Dubois M., Chenivesse C., Raux M., Morales-Robles A., Nierat M.-C, Garcia G., Navarro-Sune X., Chavez M., Martinerie J. and Similowski T., 2016. Neurophysiological evidence for a cortical contri-bution to the wakefulness-related drive to breathe explaining hypocapnia-resistant ventilation in hu-mans. J. Neurosci. 36(41), 10673–10682. doi: 10.1523/JNEUROSCI.2376-16.2016
Durka P. J., Zygierewicz J., Klekowicz H., Ginter J. and Blinowska K. J., 2004. On the statisti-cal significance of event-related EEG desynchro-nization and synchrodesynchro-nization in the time-frequency plane. IEEE T. Bio-Med Eng. 51(7), 1167-1175.
doi:10.1109/TBME.2004.827341.
Grandchamp R. and Delorme A., 2011. Single-trial normalization for event-related spectral decompo-sition reduces sensitivity to noisy trials. Front. Psy-chol. 2, 236. doi:10.3389/fpsyg.2011.00236. Gray M. A., Taggart P., Sutton P. M., Groves D.,
Holdright D. R., Bradbury D., Brull D. and Critch-ley H. D., 2007. A cortical potential reflecting car-diac function. P. Natl. Acad. Sci. USA 104(16), 6818-6823. doi:10.1073/pnas.0609509104. Hudson A. L., Navarro-Sune X., Martinerie J.,
Pouget P., Raux M., Chavez M., Similowski T., 2016. Electroencephalographic detection of respiratory-related cortical activity in humans: from event-related approaches to continuous con-nectivity evaluation. J Neurophysiol., 115(4):2214-23. doi:10.1152/jn.01058.2015.
Ichimaru Y. and Moody GB., 1999. Development of the polysomnographic database on CD-ROM. Psychiatry and Clinical Neurosciences, 53:175-177.
doi:10.13026/C23K5S.
Makeig S., 1993. Auditory event-related dynamics of the EEG spectrum and effects of exposure to tones. Electroen. Clin. Neuro. 86(4), 283-293.doi: 10.1016/0013-4694(93)90110-H.
Mallat S. G., 1998. A wavelet tour of signal pro-cessing. Academic Press, San Diego. ISBN: 9780124666054.
Maris E. and Oostenveld R., 2007. Nonparamet-ric statistical testing of EEG- and MEG-data. J. Neurosci. Methods, 164, 177-190. doi:10.1016/ j.jneumeth.2007.03.024.
Montoya P., Schandry R. and M¨uller A., 1993. Heart-beat evoked potentials (HEP): topography and in-fluence of cardiac awareness and focus of atten-tion. Electroen. Clin., Neurophysiol./Evoked
Po-tentials Section 88(3), 163-172. doi:10.1016/ 0168-5597(93)90001-6.
Mørup M., Hansen L. K. and Arnfred S. M., 2007. ERPWAVELAB: A toolbox for multi-channel anal-ysis of time frequency transformed event related potentials. J. Neurosci. Meth. 161(2), 361-368
doi:10.1016/j.jneumeth.2006.11.008.
Navarro X., Por´ee F., Beuch´ee A., Carrault G., 2015. Artifact rejection and cycle detection in imma-ture breathing: Application to the early detec-tion of neonatal sepsis. Biomedical Signal Pro-cessing and Control 16, 9-16. doi:10.1016/ j.bspc.2014.10.007.
Navarro-Sune X., Hudson A.L., De Vico Fallani F., Martinerie J., Witon A., Pouget P., Raux M., Similowski T., Chavez M., 2017. Rieman-nian Geometry Applied to Detection of Res-piratory States From EEG Signals: The Ba-sis for a Brain-Ventilator Interface. IEEE Trans Biomed Eng. 64(5): 1138-1148. doi:10.1109/ TBME.2016.2592820.
Oostenveld R., Fries P., Maris E. and Schoffelen J.-M., 2010. FieldTrip: Open Source Software for Advanced Analysis of MEG, EEG, and In-vasive Electrophysiological Data. Comput. Intel. Neurosc. 2011, article ID 156869. doi:10.1155/ 2011/156869.
Pan J. and Tompkins W. J., 1985. A real-time QRS detection algorithm. IEEE T. Bio-Med. Eng. 32(3), 230-236. doi:10.1109/TBME.1985.325532.
Perakakis P., Luque-Casado A., Ciria L. F., Ivanov P. Ch. and Sanabria D., 2017. Neural responses to heartbeats of physically trained and sedentary young adults. Preprint on bioRxiv 156802. doi: 10.1101/156802
Perakakis P. and Ciria L., 2018. HEPLAB: Mat-lab scripts for heartbeat-evoked potential analysis. Code available on Zenodo platform. URL https: //zenodo.org/record/1164232
Ramsay S. C., Adams L., Murphy K., Corfield D. R., Grootoonk S., Bailey D. L., Frackowiak R. S.
and Guz A., 1993. Regional cerebral blood flow during volitional expiration in man: a comparison with volitional inspiration. J. Physiol. 461, 85-101.
doi:10.1113/jphysiol.1993.sp019503
Raux M., 2007. Electroencephalographic evidence for pre-motor cortex activation during inspiratory loading in humans. J. Physiol. 578(2), 569-578.
doi:10.1113/jphysiol.2006.120246.
Schandry R. and Montoya P., 1996. Event-related brain potentials and the processing of cardiac activity. Biol. Psychol., Interoception and behav-ior Section 42(1-2), 75-85. Special issue: In-teroception and behavior. doi:10.1016/0301-0511(95)05147-3.
Schiff S. J., Aldroubi A., Unser M. and Sato S., 1994. Fast wavelet transformation of EEG. Elec-troen. Clin. Neuro. 91(6), 442-455. doi:10.1016/ 0013-4694(94)90165-1.
Sedghamiz H., 2014. Matlab Implementation of Pan Tompkins ECG QRS detector. Code available at the File Exchange site of MathWorks.
URL https://fr.mathworks.com/
matlabcentral/fileexchange/45840- complete-pan-tompkins-implementation-ecg-qrs-detector
Shen M. J. and Zipes D. P., 2014. Role of the auto-nomic nervous system in modulating cardiac ar-rhythmias. Circ. Res. 114(6), 1004-1021. doi: 10.1161/CIRCRESAHA.113.302549.
Snisarenko A. A., 1978. The cardiac rhythm dur-ing wakdur-ing and the various periods of sleep. Hum. Physiol. 4(1), 79-83.
Straus C., 2005. Comment est contrˆol´ee la fonction des muscles respiratoires? Rev. Mal. Respir. 22(1), 19-28. doi:10.1016/S0761-8425(05)85459-2. Tallon-Baudry C. and O. Bertrand O., 1999.
Oscil-latory gamma activity in humans and its role in object representation. Trends Cogn. Sci. 3(4), 151– 162. doi:10.1016/S1364-6613(99)01299-1.
Torrence C. and Compo G. P., 1998. A Prac-tical Guide to Wavelet Analysis. B. Am. Me-teorol. Soc. 79(1), 61-78. doi:10.1175/1520-0477(1998)079<0061:APGTWA>2.0.CO;2.
Urig¨uen J. A. and Garcia-Zapirain B., 2015. EEG ar-tifact removal–State-of-the-art and guidelines. J. Neural Eng. 12(3), 031001. doi:10.1088/1741-2560/12/3/031001.
van Vugt M., Sederberg P. B., Kahana M. J., 2007. Comparison of spectral analysis meth-ods for characterizing brain oscillations. J. Neu-rosci. Meth. 162(1-2), 49-63. doi:10.1016/ j.jneumeth.2006.12.004.
Vicente J., Johannesen L., Galeotti L. and Strauss D. G., 2013. ECGlab: User friendly ECG/VCG analysis tool for research environments. Computing in Cardiology Conference (CinC), 775-778. ISSN: 2325-8861.