HAL Id: inserm-00267736
https://www.hal.inserm.fr/inserm-00267736
Submitted on 5 Jul 2010
HAL is a multi-disciplinary open access
archive for the deposit and dissemination of sci-entific research documents, whether they are pub-lished or not. The documents may come from teaching and research institutions in France or abroad, or from public or private research centers.
L’archive ouverte pluridisciplinaire HAL, est destinée au dépôt et à la diffusion de documents scientifiques de niveau recherche, publiés ou non, émanant des établissements d’enseignement et de recherche français ou étrangers, des laboratoires publics ou privés.
Recurrence of Tamoxifen-Treated Primary Breast
Cancer.
Maïa Chanrion, Vincent Negre, Hélène Fontaine, Nicolas Salvetat, Frédéric
Bibeau, Gaëtan Mac Grogan, Louis Mauriac, Dionyssios Katsaros, Franck
Molina, Charles Theillet, et al.
To cite this version:
Maïa Chanrion, Vincent Negre, Hélène Fontaine, Nicolas Salvetat, Frédéric Bibeau, et al.. A Gene Expression Signature that Can Predict the Recurrence of Tamoxifen-Treated Primary Breast Can-cer.. Clinical Cancer Research, American Association for Cancer Research, 2008, 14 (6), pp.1744-52. �10.1158/1078-0432.CCR-07-1833�. �inserm-00267736�
A gene expression signature that can predict the recurrence of
tamoxifen-treated primary breast cancer.
Maïa Chanrion1, Vincent Negre1, Hélène Fontaine1, Nicolas Salvetat2, Frédéric Bibeau1, Gaëtan Mac Grogan3, Louis Mauriac3, Dionyssios Katsaros4, Franck Molina2, Charles Theillet1 and Jean-Marie Darbon1
1U868 INSERM, Tumoral Identity and Plasticity, Cancer Research Center of Montpellier, Université Montpellier 1, CRLC Val d’Aurelle-Paul Lamarque, Montpellier, France; 2Department of Informatics, UMR5160 CNRS, Montpellier, France; 3
Department of Pathology, Institut Bergonié, Bordeaux, France; 4Department of Obstetrics and Gynecology, University of Turin, Italy.
Journal section: Prognostic and Predictive Factors Type of manuscript : Research article
Running title : Gene expression profiling in breast cancer
Key words : gene expression profiling, classifier, tamoxifen, breast cancer
This work was supported by INSERM, GEFLUC Montpellier-Languedoc-Roussillon and the Canceropole Grand-Sud-Ouest, France.
Requests for reprints : Jean-Marie Darbon, INSERM U868, CRCM, CRLC Val d’Aurelle-Paul Lamarque, F-34298 Montpellier cedex 5, France. Fax : 33 467 613 787 E-mail : jmdarbon@valdorel.fnclcc.fr
Abstract
Purpose
Identification of a molecular signature predicting the relapse of tamoxifen-treated primary breast cancers should help the therapeutical management of ER-positive cancers.
Experimental Design
A series of 132 primary tumors from patients who received adjuvant tamoxifen were analysed for expression profiles at the whole genome level by 70-mer oligonucleotide microarrays. A supervised analysis was performed to identify an expression signature.
Results
We defined a 36-gene signature that classified correctly 78% of patients with relapse and 80% of relapse-free patients (79% accuracy). Using 23 independent tumors, we confirmed the accuracy of the signature (78%), whose relevance was further demonstrated by using published microarray data from 60 tamoxifen-treated patients (63% accuracy).
Univariate analysis using the validation set of 83 tumors demonstrated that the 36-gene classifier was more efficient to predict disease-free survival than the traditional histo-pathological prognostic factors and as effective as the Nottingham Prognostic Index or the “Adjuvant!“ software. Multivariate analysis demonstrated that the molecular signature was the only independent prognostic factor. Comparison with several already published signatures demonstated that the 36-gene signature was among the best to classify tumors from both training and validation sets. Kaplan-Meier analyses emphasized its prognostic power both on the whole cohort of patients and on a subgroup with an intermediate risk of recurrence as defined by the St Gallen criteria.
Conclusion
This study identifies a molecular signature specifying a subgroup of patients who do not gain benefits from tamoxifen treatment. These patients may therefore be eligible for alternative endocrine therapies and/or chemotherapy.
Introduction
Breast cancer is the most common female cancer in the Western World and the leading cause of death by cancer among women. Although the mortality rate is now stabilized or decreasing, breast cancer incidence is still on the rise through all European countries [1].
About two thirds of breast cancers are hormone (estrogen)-dependent as they are positive for estrogen receptor (ER) and/or progesterone receptor (PR). Estrogen being a major activator of proliferation in these tumors, its receptor and downsteam signaling are excellent targets for the hormonal therapy in patients with ER+ (and/or PR+) breast cancers. Over the past three decades, the anti-estrogen tamoxifen, which prevents the binding of estrogen to its receptor, has been the golden standard for the endocrine treatment of all stages of these cancers. In particular, large-scale randomized trials have shown that, in early stage ER+ breast cancers, a 5-year course of tamoxifen, started immediately after surgery, reduces recurrence by 51% and mortality by 28% [2].
However, success of tamoxifen therapy is limited by intrinsic or acquired tumor resistance. Approximately 40% of patients with ER+ breast cancers will not respond to tamoxifen. This is mostly due to the fact that this selective estrogen receptor modulator is not a pure anti-estrogen and, indeed, shows some agonist activity. The balance between agonist and antagonist properties differs among cell types and seems to depend on several molecular events that can influence ER signaling. These include the level of co-activators and co-repressors and the impact of cross-signaling in growth factor transduction pathways [3].
Recently, third-generation aromatase inhibitors (AIs) have been shown to be more effective than tamoxifen to treat both advanced and early hormone-sensitive breast cancers in menopausal women [4]. However, the absolute reduction in relapse-free survival for adjuvant AIs over tamoxifen is modest and the issue of long-term adverse effects in particular in bone, remains to be addressed. Moreover, AIs are also prone to develop resistance, although different mechanisms may be responsible for that.
As a consequence, the ability to accurately predict the response to tamoxifen should facilitate the choice of the best endocrine treatment and improve the management of primary ER+ breast cancers. Attempts to identify individual predictive markers failed to do that, so far. Recent publications on large-scale analysis of gene expression in
breast cancers have underscored the considerable potential of DNA array technology. Hierarchical clustering of gene expression patterns has been successfully used to identify subtypes of breast tumors that exhibit distinct clinical behaviors [5-8] Supervised classifications of gene expression profiles have been performed to identify poor prognostic signatures, predictive of recurrence in primary breast cancers [9-11]. Such analysis has been used to identify genes which can help to discriminate between responders and non-responders to chemotherapy agents in breast cancer [12, 13]. Similar approaches have been tentatively used to define gene expression signatures that are predictive of recurrence in breast cancer patients treated with tamoxifen [14-16]. However, the study by Jansen et al. concerned metastatic breast cancers (i.e. the response to a recurrent disease) while that of Ma et al. reported a two-gene signature whose performance has been debated [17-19]. Both studies used a limited cohort of tumors as a training set (46 and 60 tumors, respectively). Finally, the study by Paik et al. defined a recurrence score predictor for lymph node-negative breast cancer [15] which also predicted the magnitude of chemotherapy benefit [20]. However, this classifier was constructed from 250 candidate genes that were previously selected from the published literature. Finally, several studies have also reported molecular prognostic signatures able to classify ER+ breast cancer whatever the patient treatment [21-25].
In order to identify a gene expression signature that might predict recurrence of tamoxifen-treated primary breast cancers, we performed a genome-wide microarray analysis of ER+ and/or PR+ primary breast tumors from 132 patients, who had been treated with adjuvant tamoxifen. This analysis led to the identification of a 36-gene molecular signature that is highly predictive of clinical outcome.
Patients and methods
Patients and Treatment
132 primary breast carcinomas were analysed in this study as a training set and 23 extra tumors as a validation set (Supplemental Table S1). These carcinomas were obtained from patients who had undergone initial surgery between 1989 and 2001 at the Cancer Research Center of Val d’Aurelle in Montpellier, the Bergonié Institute in Bordeaux or the Department of Obstetrics and Gynecology of Turin. For the 155 patients, the median follow-up time was 65.9 months.
Fresh tissues were formalin-fixed and paraffin-embedded immediately after surgical removal. The remaining of each tumor was snap-frozen in liquid nitrogen and stored at – 80° C. Frozen sections were stained with Haematoxylin and Eosin to select samples with at least 50% of tumor cells. ER and PR status were determined by using a radio-ligand binding assay or by immuno-histochemistry. All, but 8 tissue specimens, were ER+, and 6 out of the 8 ER- tumors were PR+.
None of the patients did receive neo-adjuvant systemic therapy. All patients were treated with tamoxifen (20 mg daily) for 5 years after surgery. 121 patients received also adjuvant radiotherapy. Recurrence was observed in 52 patients (48 distant metastases and 4 local recurrences) with median relapse time of 37.1 months. Tumors from those patients were defined as R tumors (R for relapse), whereas tumors from patients who showed no recurrence were defined as RF tumors (RF for relapse-free).
RNA Isolation, Amplification and Labeling
Frozen breast samples (40 mg) were homogenized using the FastPrep System from Q-Biogene (MP Biomedicals, Illkirch, France). Total RNA was extracted and cleaned up from the lysate with use of the Qiagen RNeasy Mini Kit. The RNA purity and integrity was controlled by way of the Bioanalyser 2100 (Agilent Technologies, CA, USA).
Gene expression profiling was performed using 70-mer oligonucleotide microarrays. The 22,680 oligonucleotide probes (Oligo Set 2.1 from Qiagen-Operon), which represent 21,329 human specific genes, were spotted on Aminolink chips at the Genopole Montpellier-LR [26].
For each sample, 2 µg of total RNA was reverse-transcribed and amplified by using the RNA amplification kit from Ambion, TX, USA. Fifteen µg of amplified RNA were labelled by direct chemical coupling to the Cy5 NHS ester (Amersham Biosciences, NJ, USA). Labelled RNAs were purified, fragmented and used as probes to hybridize microarrays. One-color design has been shown to be as performant as two-color design and it allowed easier normalization between samples [27].
Microarray Gene Expression Analysis
Fluorescent images of hybridized microarrays were obtained with Axon 4000B scanner (Molecular Devices, CA, USA) and analyzed using Genepix 6.0. The mean of replicated spots was calculated for each gene by using the Acuity 4.0 software.
Gene expression signals were first normalized between arrays to the same median expression level (by dividing the intensity measurement for each gene on a given array by the median intensity of all genes across the array). Before analysis, a filter procedure eliminated non-informative genes on the basis of being significantly measured (i.e., expression level higher than two-fold the mean expression of the negative control spots in at least 40% of the samples). Then, we selected the 5,415 genes whose expression varied by at least three-fold from the median value in at least 1% of the samples. Expression data were then log-2 transformed.
The Significance Analysis of Microarrays (SAM) [28] was used to identify genes whose expression level best discriminated patients without (relapse-free, RF) and with relapse (R). This analysis was performed on the 132 tumors of the training set (86 RF and 46 R). A thousand permutations were generated to estimate the False Discovery Rate (FDR) value. Differences were considered as significant, when the FDR was less than 5% with a minimum 1.51 fold-change and when the SAM score was greater than (or equal to) ±2.52.
A classifier that can predict recurrence under tamoxifen treatment was constructed by using the Prediction Analysis of Microarrays (PAM) [29] on the training set. A resampling approach was used, as described in van’t Veer et al. [30]. As shown on Figure S1 (Supplementary data), the training set was splitted into 2 parts, a learning set (85 patients) and a test set (47 patients). The learning set was used to construct the classifier, while the test set was used to estimate its performance. The split procedure was repeated 100 times. For each learning set, a minimal molecular signature was estimated by a leave-one-out cross-validation and its performance was estimated by the average proportion of misclassification for each associated test set. As the composition of the learning set changes in each iteration, the 100 minimal signatures obtained were obviously not identical. The final predictive signature corresponded to the most frequently selected genes (see results).
To confirm the molecular signature obtained by PAM, we used another classifier, the K-Nearest Neighbor (KNN) [31] with the same resampling of the training set.
A hierarchical pairwise average-linkage clustering [32] was performed on the basis of the expression of the signature genes with median centered gene expression values and Pearson correlation as similarity metric.
We classified the training set tumors according to the five subgroups defined by Sorlie et al. [7] on the basis of the highest correlation to the respective centroid as indicated in Supplementary Methods.
To evaluate the performance of the consensus predictive signature, we used 23 independent tumors (17 RF and 6 R) as an external validation set as well as gene expression data from the study of Ma et al. [14]. These data were obtained, like in our study, on 70-mer oligonucleotide microarrays and concerned 60 tamoxifen-treated patients (32 RF and 28 R). 41 patients (Supplemental Table S2) belonged to the intermediate-risk group according to the St Gallen criteria [33]. Raw data were downloaded from GEO (http://www.ncbi.nlm.nih.gov/geo, accession number GSE1378). The Cy5 intensities were selected, normalized by median centering and log-2 transformed.
To compare the performance of the 36-gene signature with those of intrinsic subtype [7], 70-gene profile [9], wound-response [11], two-gene ratio [34], GGI [22] and MPI [24], we evaluated the prognostic value of each expression-based model as indicated in Supplementary Methods, on both the training set (132 tumors) and a pooled validation set (83 tumors including the 23 tumors from our microarray study and the 60 tumors from the Ma’s study).
Statistical analyses
Specificity, sensitivity and accuracy of the classifier as well as positive and negative predictive values were calculated as follows:
Sensitivity=A/(A+C); Specificity=D/(B+D); Accuracy=(A+D)/(A+B+C+D) Positive Predictive Value=A/(A+B); Negative Predictive Value=D/(C+D)
Univariate and multivariate analyses were performed both on the training and the validation sets. All the input parameters (tumor grade, ER and PR status, tumor size, patient age, lymph node status, Nottingham prognostic index, Adjuvant! software and predictive classifier) were converted to a binary format (see below). Parameters found
Relapse-free patients Patients with relapse Relapse-free predicted A = True Positive B = False Positive Relapse predicted C = False Negative D = True Negative
to be significant in univariate analysis were selected to perform the multivariate analysis by logistical regression.
NPI score was caculated as follows: tumor size (cm)
*
0.2 + grade + lymph-node stage (negative nodes=1; 1 to 3 positive nodes=2; ≥4 positive nodes=3), with 3.4 as threshold. Values for the Aduvant! (http://www.adjuvantonline.com/index.jsp) were calculated for 10-year mortality with 0.2 as threshold.Results
Identification of the differentially expressed genes
Patients were classified in two groups according to the occurrence of relapse (R) or its absence (relapse-free, RF) within the 5 years of tamoxifen treatment. To identify which genes were differentially expressed in R tumors versus RF, we used a SAM analysis of the 5,415 filtered genes (see Methods). Three hundred and one genes showed significant differences in their expression levels between R and RF tumors, with a false discovery rate below 5%. Then, the 48 most discriminating genes were selected on the basis of their fold-change and SAM score values (Supplemental Table S3). Among those genes, 17 were overexpressed (positive SAM score) and 31 underexpressed (negative SAM score) in tumors from patients with relapse.
Determination of a 36-gene predictive signature
To define a minimal expression signature, which could be used as a molecular classifier to predict recurrence of tamoxifen-treated patients, gene expression data were analyzed using a PAM algorithm. We used the 5,415 filtered genes instead of the 301 SAM selected genes as it has been demonstrated that building a classifier after selecting differentially expressed genes induced an overfitting bias [35]. To determine the consensus molecular signature, we tested different signature lengths according to the level of gene occurrence in the 100 different minimal signatures. The error rate for R tumors decreased from 41% to 26% when the gene number was increased from 26 to 36 genes and remained steady from 36 to 71 genes (data not shown; for the 71-gene list, see Supplemental Table S4). Since contracted signatures are favored for predictive tests in clinical practice, we selected the 36 genes, which were present in more than 60% of the 100 PAM iterative signatures, as the optimal molecular signature (Table 1). This 36-gene signature classified the training set tumors with 80%
sensitivity, 78% specificity and 79% accuracy. The positive and negative predictive values of relapse were 87% and 68%, respectively.
Among the 36 signature genes, 26 belonged to the SAM selection of 48 genes (Table 1), the remaining 10 genes coming out in the overall 301-gene list (not shown). A similar overlap between SAM and PAM analyses of expression data has been recently reported [36].
To confirm the reliability of this signature, we used a KNN classifier. As for the PAM, a minimal predictive signature was defined for each iteration. The optimal consensus signature was obtained with 52 genes that were present in more than 47% of the 100 KNN iterative signatures (Supplemental Table S4). According to this 52-gene signature, the training set was classified with 83% sensitivity, 74% specificity and 80% accuracy. Interestingly, 29 genes were common with those of the 36-gene PAM signature (Table 1), thus, underlining the robustness of the 36-gene predictive signature.
We then performed hierarchical clustering of the 132 tumors of the training set based on the 36-genes signature. As shown in Figure 1, the resulting dendrogram showed two main clusters: the R cluster of tumors from patients with relapse (34 of the 46 R tumors) and the RF cluster of tumors from relapse-free patients (71 of the 86 RF tumors). In conclusion, there was a strong agreement between the tumor classification obtained through the PAM classifier and the hierarchical clustering of the tumors through the predictive 36-gene set.
We have classified the 132 tumors according to the previously reported molecular subtypes. Forty-two tumors of the 132 tumors from the training set coud not be classified in any subtype. Interestingly, 46 of the 58 tumors (79%) which were classified as luminal A were found in the relapse-free branch of the dendrogram and 22 of the 31 tumors (71%) which were classified as luminal B were found in the relapse branch.
Validation of the 36-gene predictive signature
The 36-gene predictive signature, as defined by the PAM analysis, was validated by an external set of 23 patients (6 R and 17 RF) that were enrolled independently. Fourteen of the 17 RF (82% sensitivity) and 4 of the 6 R patients (67% specificity) were correctly classified with a 78% accuracy.
To confirm the performance of our classifier with a larger validation cohort, we used gene expression data obtained by Ma et al. on tamoxifen-treated patients [14]. We chose this data set as it was obtained on a 70-mer oligonucleotide microarray close to the one we used. We mapped our 36-genes signature on the Ma dataset by using Hugo gene symbols. Thirty-five out of the 36 signature-genes were available in this study (BC015719 was missing). The omission of this gene did not affect prediction of clinical outcome that was evaluated on our training set. The 60 independent tumors from the Ma cohort were classified with a 63% accuracy (69% sensitivity, 57% specificity), confirming the relevance of our classifier.
Correlations to the clinical outcome
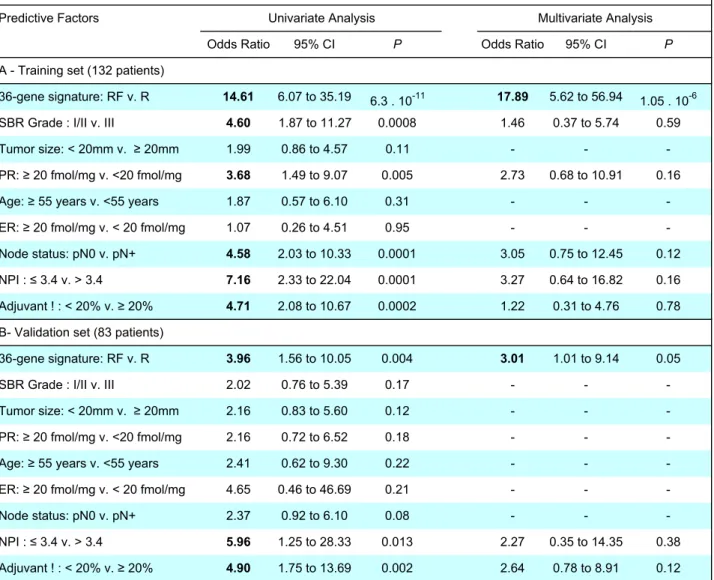
Univariate analysis of standard clinical prognostic factors (including the NPI and the Adjuvant! classifiers) and predictive 36-gene signature in terms of disease-free survival was performed both on the training and validation sets. When the training set (132 patients) was used, the SBR grade, PR level, lymph node status, NPI, Adjuvant! and the 36-gene signature were significantly associated to shortened disease-free survival (Table 2A). Nevertheless, the predictive signature appeared to be the strongest predictive factor with 2 to 4-times higher odds ratios compared to other prognostic factors or indices. When performed on the validation set (83 patients), only the 36-gene signature and the NPI and Adjuvant! classifiers were found to be significant with almost similar odds ratios (Table 2B).
However, multivariate analysis that was performed both on the training and validation sets by using the parameters found to be significant in the univariate analysis, demonstrated that the 36-gene signature was the only independent prognostic factor (Table 2A and 2B).
Theses analyses confirmed that the molecular signature that we have identified was more efficient than the usual histo-pathological parameters to predict the clinical outcome of tamoxifen-treated breast cancers.
As shown on Figure 2, Kaplan-Meier analysis emphasized the prognostic power of the 36-gene signature both on the 83 patients from the validation set and on a subgroup of 60 out of these 83 patients who exhibited an intermediate risk of recurrence according to the St Gallen criteria (Supplemental Table S1 and Table S2). This finding demonstrates that the 36-gene signature may be useful to discriminate patients of
good and poor prognosis in this intermediate-risk group of patients to define the best therapeutical approach.
Comparison of the 36-gene signature with already published signatures
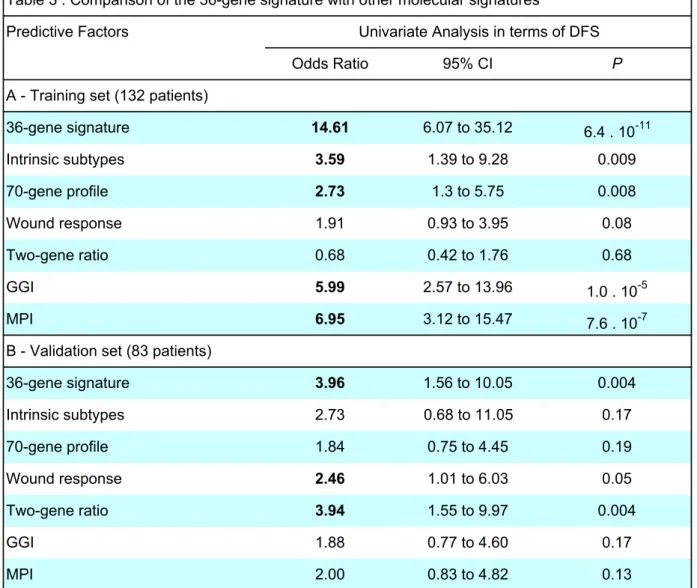
We have compared the performance of the present 36-gene signature with those of 6 gene-expression-based models that have been described for breast cancer, namely, intrinsic subtype, 70-gene profile, wound-response, two-gene ratio, gene expression grade index (GGI) and molecular prognostic index (MPI).
As shown on Table 3A, univariate analysis in terms of disease-free survival that was performed on the training set (132 tumors) demonstrated that 5 out of the 7 evaluated signatures classified correctly the tumors, the 36-gene, GGI and MPI signatures being the most efficient. Similar analyis performed on the validation set (83 tumors) confirmed the performance of the 36-gene signature that was as efficient as the two-gene ratio to classify tumors (Table 3B).
Functional analysis of the predictive signature
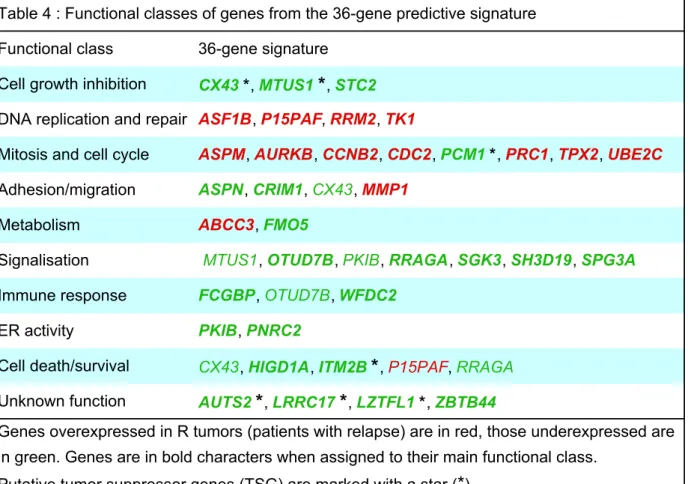
With the exception of 1 EST and 4 genes with unknown function, all of the 36 genes appeared relevant to cancer (Table 1). Indeed, the functional annotation showed that they were involved in the control of mitosis, cell cycle and cell proliferation, DNA replication and repair, cell signalisation, adhesion/migration, cell death/survival, ER transcriptional activity, immune response or metabolism.
Among these 36 genes, 23 were underexpressed and 13 were overexpressed in tumors from patients with recurrent disease in agreement with their putative function in oncogenesis. As shown in Table 4, four of the underexpressed genes were involved in cellular adhesion or invasion, 3 could be implicated in immune response or inflammation and 2 others were putative negative regulators of ER. Moreover, 7 genes have been reported as candidate tumor suppressor genes (TSG), namely, AUTS2,
GJA1/CX43, MTUS1/ATIP1, PCM1, ITM2B, LRRC17/P37NB, LZTFL1.
Among the upregulated genes, 7 were involved in the control of mitosis and cell cycle, 4 have been implicated in DNA replication and/or DNA repair and one gene, MMP1, has been demonstrated to be a key promoter of cellular invasion.
Interestingly, CX43 and ITM2B which have been proposed to have a pro-apoptotic function were down-regulated in tumors from recurrent patients while p15(PAF), which has been reported as a anti-apoptotic factor, was up-regulated in these tumors. Also,
CX43, FMO5 and PCM1 have been reported as members of an apoptotic gene
module whose overexpression specified low-grade ER+ breast tumors from patients with a better survival outcome [37]. All of them were found down-regulated in tumors from patients with relapse in this study.
Discussion
The main problem encountered in gene expression profiling studies is the relatively small overlap between independently reported molecular signatures. Noteworthy, the present 36-gene signature includes 11 genes (30%) that are members of a proliferation cluster present in several previously pulished classifiers. This major proliferation signature has been shown to specify poor-prognosis subsets of ER+ breast cancer [15, 21-25]. It includes AURKB, CCNB2, CDC2, PRC1, RRM2, TPX2 and UBE2C genes [22, 23], which are present in our signature, along with
BIRC5/survivin, KI-67, MYBL2, STK6/15, and CCNB1, belonging to the Paik’s 21-gene
classifier [15]. Several members of this proliferation gene cluster are also found in the van’t Veer’s 231-gene poor prognostic signature [9], namely, BIRC5, CCNB2, PRC1,
RRM2 and STK6/15. Another gene, TK1, is found to be a member of this cluster both
in this and distinct studies [9, 21]. ASF1B [38], ASPM [22, 38] and p15(PAF) [24, 39] have been also reported in proliferation gene clusters correlated to cancer aggressiveness [22, 38].
Interestingly, similarity between these distinct gene signatures may further concern members of the same functional family or different partners of the same pathway(s). For example, CCNB2 and AURKB (STK12) may be substituted by CCNB1 and
AURKA (STK6/15), respectively. Moreover, AURKB interacts with survivin [40] and
TPX2 targets AURKA to the mitotic spindle [41].
Although the presence of such a proliferation cluster seems to be a hallmark of several prognostic signatures, the 11 members of this cluster from our 36-gene signature did not exhibit a prognostic power by itself (data not shown). This later finding demonstrates that the ER-related genes of the present signature could be essential to confer its prognostic power.
Indeed, our 36-gene signature included at least 18 genes (50%) that were related to estrogens either as ER targets or ER regulators. Six genes, namely CRIM1, CX43,
FMO5, P37NB/LRRC17, STC2 and WFDC2 have been shown to be induced by
estrogens and the expression of these genes has been correlated with ER+ status [42-44]. Interestingly, STC2 or FMO5 expression was associated with good prognosis in ER and/or PR+ breast cancer patients, who were treated with adjuvant hormone therapy [43, 44]. Conversely, TK1 overexpression, shown to occur in ER negative breast tumors [45] and in our cohort of R tumors, has been reported to be a marker of poor clinical outcome of tamoxifen therapy [46]. ABCC3 has been shown to be E2-repressed [47] and was overexpressed in tumors from patients with recurrence. Eight other genes of the 36-gene signature (i.e., AURKB/STK12, CCNB2, CDC2, MMP1,
PRC1, RRM2, TPX2 and UBE2C) have been reported to discriminate ER+ from ER-
breast cancers [8, 23, 42]. Finally, 2 other genes, PNRC2 and PKIB, are possibly involved in the regulation of the ER activity. PNRC2 is mostly known to be a co-activator of nuclear receptors, including ER, and it has also been suggested to antagonize the growth factor-mediated MAP kinase activation of ER [48]. On the other hand, down-regulation of PKIB, a protein kinase A (PKA) inhibitor, might be associated with tamoxifen resistance. Indeed, such an association has been reported for PKAR1α, another PKA negative regulator whose down-regulation favored the phosphorylation of ER, converting tamoxifen from an ER antagonist into a growth stimulator [49]. Also, OTUD7B encodes a deubiquinating enzyme that has been demonstrated as a negative regulator of NFkappaΒ, a prognostic marker associated to tamoxifen resistance [50].
In our study as in that by Paik et al. [15], the classifiers were able to predict the clinical outcome of tamoxifen-treated breast cancers and thus they could be considered as general prognostic classifiers. Whether our 36-gene signature may further specify responsiveness to tamoxifen remains to be investigated. However, the presence of several estrogen-related genes in this signature suggests that it could be the case. In any case, this molecular signature allows to discriminate a subset of patients who do not gain benefits from tamoxifen treatment. Those patients might be potential candidates for alternative endocrine therapies and/or chemotherapy. As a main finding, we demonstrate the prognostic power of our signature on a subgroup of patients who exhibited an intermediate-risk of relapse according to the St Gallen criteria. In other words, the 36-gene signature can be helpfull in tailoring the therapeutical decision in this particular patient subset.
Despite their value, expression signatures, which have been obtained by studying retrospective cohorts, need to be confirmed by prospective studies.
In summary, our findings demonstrate the utility of large-scale gene expression profiling to define a molecular signature that can predict the recurrence of tamoxifen-treated primary breast cancer more efficiently than the usual clinical and histo-pathological prognostic factors. Moreover, our data bring new insights on putative master genes involved in cancer progression and resistance to endocrine therapy.
Legends to Figures
Figure 1 : Hierarchical clustering analysis of the 132 tumors from the training set using the 36-gene predictive signature.
The 132 tumors from 86 relapse-free (RF) and 46 patients with relapse (R), as indicated on the top of the figure, were divided into two main clusters, corresponding to the two branches of the dendrogram: the R and RF clusters. The 36 genes from the predictive signature are indicated on the right.
Figure 2 : Kaplan-Meier survival curves for time to recurrence according to the 36-gene classifier.
Kaplan-Meier disease-free survival curves based on the 36-gene signature : A, for the cohort of 83 patients from the validation set; B, for the 60 out of these 83 tumors who belong to the St Gallen intermediate-risk group. The p-values were calculated by using the log-rank test.
References
1. Botha JL, Bray F, Sankila R et al. Breast cancer incidence and mortality trends in 16 European countries. Eur J Cancer 2003; 39:1718-1729.
2. EBCTCG. Tamoxifen for early breast cancer: an overview of the randomised trials. Early Breast Cancer Trialists' Collaborative Group. Lancet 1998; 351:1451-1467.
3. Ali S, Coombes RC. Endocrine-responsive breast cancer and strategies for combating resistance. Nat Rev Cancer 2002; 2:101-112.
4. Johnston SR, Dowsett M. Aromatase inhibitors for breast cancer: lessons from the laboratory. Nat Rev Cancer 2003; 3:821-831.
5. Perou CM, Sorlie T, Eisen MB et al. Molecular portraits of human breast tumours. Nature 2000; 406:747-752.
6. Sorlie T, Perou CM, Tibshirani R et al. Gene expression patterns of breast carcinomas distinguish tumor subclasses with clinical implications. Proc Natl Acad Sci U S A 2001; 98:10869-10874.
7. Sorlie T, Tibshirani R, Parker J et al. Repeated observation of breast tumor subtypes in independent gene expression data sets. Proc Natl Acad Sci U S A 2003; 100:8418-8423.
8. Sotiriou C, Neo SY, McShane LM et al. Breast cancer classification and prognosis based on gene expression profiles from a population-based study. Proc Natl Acad Sci U S A 2003; 100:10393-10398.
9. van 't Veer LJ, Dai H, van de Vijver MJ et al. Gene expression profiling predicts clinical outcome of breast cancer. Nature 2002; 415:530-536.
10. Wang Y, Klijn JG, Zhang Y et al. Gene-expression profiles to predict distant metastasis of lymph-node-negative primary breast cancer. Lancet 2005; 365:671-679.
11. Chang HY, Nuyten DS, Sneddon JB et al. Robustness, scalability, and integration of a wound-response gene expression signature in predicting breast cancer survival. Proc Natl Acad Sci U S A 2005; 102:3738-3743.
12. Chang JC, Wooten EC, Tsimelzon A et al. Gene expression profiling for the prediction of therapeutic response to docetaxel in patients with breast cancer. Lancet 2003; 362:362-369.
13. Ayers M, Symmans WF, Stec J et al. Gene expression profiles predict complete pathologic response to neoadjuvant paclitaxel and fluorouracil, doxorubicin, and cyclophosphamide chemotherapy in breast cancer. J Clin Oncol 2004; 22:2284-2293.
14. Ma XJ, Wang Z, Ryan PD et al. A two-gene expression ratio predicts clinical outcome in breast cancer patients treated with tamoxifen. Cancer Cell 2004; 5:607-616.
15. Paik S, Shak S, Tang G et al. A multigene assay to predict recurrence of tamoxifen-treated, node-negative breast cancer. N Engl J Med 2004; 351:2817-2826.
16. Jansen MP, Foekens JA, van Staveren IL et al. Molecular classification of tamoxifen-resistant breast carcinomas by gene expression profiling. J Clin Oncol 2005; 23:732-740.
17. Fan C, Oh DS, Wessels L et al. Concordance among gene-expression-based predictors for breast cancer. N Engl J Med 2006; 355:560-569.
18. Goetz MP, Suman VJ, Ingle JN et al. A two-gene expression ratio of homeobox 13 and interleukin-17B receptor for prediction of recurrence and survival in women receiving adjuvant tamoxifen. Clin Cancer Res 2006; 12:2080-2087. 19. Reid JF, Lusa L, De Cecco L et al. Limits of predictive models using microarray
data for breast cancer clinical treatment outcome. J Natl Cancer Inst 2005; 97:927-930.
20. Paik S, Tang G, Shak S et al. Gene expression and benefit of chemotherapy in women with node-negative, estrogen receptor-positive breast cancer. J Clin Oncol 2006; 24:3726-3734.
21. Dai H, van't Veer L, Lamb J et al. A cell proliferation signature is a marker of extremely poor outcome in a subpopulation of breast cancer patients. Cancer Res 2005; 65:4059-4066.
22. Sotiriou C, Wirapati P, Loi S et al. Gene expression profiling in breast cancer: understanding the molecular basis of histologic grade to improve prognosis. J Natl Cancer Inst 2006; 98:262-272.
23. Oh DS, Troester MA, Usary J et al. Estrogen-regulated genes predict survival in hormone receptor-positive breast cancers. J Clin Oncol 2006; 24:1656-1664.
24. Teschendorff AE, Naderi A, Barbosa-Morais NL et al. A consensus prognostic gene expression classifier for ER positive breast cancer. Genome Biol 2006; 7:R101.
25. Loi S, Haibe-Kains B, Desmedt C et al. Definition of clinically distinct molecular subtypes in estrogen receptor-positive breast carcinomas through genomic grade. J Clin Oncol 2007; 25:1239-1246.
26. Desagher S, Severac D, Lipkin A et al. Genes regulated in neurons undergoing transcription-dependent apoptosis belong to signaling pathways rather than the apoptotic machinery. J Biol Chem 2005; 280:5693-5702.
27. Patterson TA, Lobenhofer EK, Fulmer-Smentek SB et al. Performance comparison of one-color and two-color platforms within the MicroArray Quality Control (MAQC) project. Nat Biotechnol 2006; 24:1140-1150.
28. Tusher VG, Tibshirani R, Chu G. Significance analysis of microarrays applied to the ionizing radiation response. Proc Natl Acad Sci U S A 2001; 98:5116-5121. 29. Tibshirani R, Hastie T, Narasimhan B et al. Diagnosis of multiple cancer types
by shrunken centroids of gene expression. Proc Natl Acad Sci U S A 2002; 99:6567-6572.
30. Wessels LF, Reinders MJ, Hart AA et al. A protocol for building and evaluating predictors of disease state based on microarray data. Bioinformatics 2005; 21:3755-3762.
31. Pomeroy SL, Tamayo P, Gaasenbeek M et al. Prediction of central nervous system embryonal tumour outcome based on gene expression. Nature 2002; 415:436-442.
32. Eisen MB, Spellman PT, Brown PO et al. Cluster analysis and display of genome-wide expression patterns. Proc Natl Acad Sci U S A 1998; 95:14863-14868.
33. Goldhirsch A, Glick JH, Gelber RD et al. Meeting highlights: international expert consensus on the primary therapy of early breast cancer 2005. Ann Oncol 2005; 16:1569-1583.
34. Ma XJ, Hilsenbeck SG, Wang W et al. The HOXB13:IL17BR expression index is a prognostic factor in early-stage breast cancer. J Clin Oncol 2006; 24:4611-4619.
35. Simon R, Radmacher MD, Dobbin K et al. Pitfalls in the use of DNA microarray data for diagnostic and prognostic classification. J Natl Cancer Inst 2003; 95:14-18.
36. Smid M, Wang Y, Klijn JG et al. Genes associated with breast cancer metastatic to bone. J Clin Oncol 2006; 24:2261-2267.
37. Yu K, Ganesan K, Miller LD et al. A modular analysis of breast cancer reveals a novel low-grade molecular signature in estrogen receptor-positive tumors. Clin Cancer Res 2006; 12:3288-3296.
38. Rosty C, Sheffer M, Tsafrir D et al. Identification of a proliferation gene cluster associated with HPV E6/E7 expression level and viral DNA load in invasive cervical carcinoma. Oncogene 2005; 24:7094-7104.
39. Rhodes DR, Yu J, Shanker K et al. Large-scale meta-analysis of cancer microarray data identifies common transcriptional profiles of neoplastic transformation and progression. Proc Natl Acad Sci U S A 2004; 101:9309-9314.
40. Bolton MA, Lan W, Powers SE et al. Aurora B kinase exists in a complex with survivin and INCENP and its kinase activity is stimulated by survivin binding and phosphorylation. Mol Biol Cell 2002; 13:3064-3077.
41. Brunet S, Sardon T, Zimmerman T et al. Characterization of the TPX2 domains involved in microtubule nucleation and spindle assembly in Xenopus egg extracts. Mol Biol Cell 2004; 15:5318-5328.
42. Abba MC, Hu Y, Sun H et al. Gene expression signature of estrogen receptor alpha status in breast cancer. BMC Genomics 2005; 6:37.
43. Bieche I, Girault I, Urbain E et al. Relationship between intratumoral expression of genes coding for xenobiotic-metabolizing enzymes and benefit from adjuvant tamoxifen in estrogen receptor alpha-positive postmenopausal breast carcinoma. Breast Cancer Res 2004; 6:R252-263.
44. Yamamura J, Miyoshi Y, Tamaki Y et al. mRNA expression level of estrogen-inducible gene, alpha 1-antichymotrypsin, is a predictor of early tumor recurrence in patients with invasive breast cancers. Cancer Sci 2004; 95:887-892.
45. O'Neill KL, Hoper M, Odling-Smee GW. Can thymidine kinase levels in breast tumors predict disease recurrence? J Natl Cancer Inst 1992; 84:1825-1828.
46. Foekens JA, Romain S, Look MP et al. Thymidine kinase and thymidylate synthase in advanced breast cancer: response to tamoxifen and chemotherapy. Cancer Res 2001; 61:1421-1425.
47. Vendrell JA, Magnino F, Danis E et al. Estrogen regulation in human breast cancer cells of new downstream gene targets involved in estrogen metabolism, cell proliferation and cell transformation. J Mol Endocrinol 2004; 32:397-414. 48. Zhou D, Chen B, Ye JJ et al. A novel crosstalk mechanism between nuclear
receptor-mediated and growth factor/Ras-mediated pathways through PNRC-Grb2 interaction. Oncogene 2004; 23:5394-5404.
49. Michalides R, Griekspoor A, Balkenende A et al. Tamoxifen resistance by a conformational arrest of the estrogen receptor alpha after PKA activation in breast cancer. Cancer Cell 2004; 5:597-605.
50. Zhou Y, Eppenberger-Castori S, Eppenberger U et al. The NFkappaB pathway and endocrine-resistant breast cancer. Endocr Relat Cancer 2005; 12 Suppl 1:S37-46.
Acknowledgements
We would like to acknowledge Laurent Journot, Dany Séverac and Cindy Aknin of the transcriptome platform facilities at the Genopole of Montpellier-LR. We also thank Thomas Filleron for his fruitful advices about statistical analysis and Dr Stéphane Culine for his help in collecting patient follow-up.
MC was a recipient of a fellowship from the Ligue contre le Cancer-Comité Hérault and VN was a recipient of a fellowship from INSERM.
Accession
number Gene Name PAM Occur SAM score (R/RF) Fold- Change (R/RF)
Gene Title Functional pathway
NM_017761 PNRC2* 0.98 -3.67 0.60 Proline-rich nuclear receptor coactivator 2 ER activity regulation
AK027663 STC2* 0.98 -3.36 0.43 Stanniocalcin 2 Cell growth
NM_014736 KIAA0101/p15(PAF)* 0.97 3.46 1.69 PCNA-associated factor DNA repair; Anti-apoptosis NM_000165 GJA1/CX43* 0.96 -3.04 0.45 Gap junction protein, alpha 1, 43kDa (connexin
43)
Cell growth; Adhesion; Apoptosis
BC015719 OTUD7B* 0.94 -3.03 0.60 OTU domain containing 7B Signalisation; Inflammation AK023933 ZBTB44* 0.92 -2.70 0.69 Zinc finger and BTB domain-containing protein 44 Unknown function NM_018154 ASF1B* 0.89 3.29 1.67 ASF1 anti-silencing function 1 homolog B (S. cerevisiae) DNA repair
AL137566 - 0.89 -2.87 0.54 -
-AF085233 SGK3/SGKL* 0.89 -2.52 0.51 Serum/glucocorticoid regulated kinase 3 Signalisation NM_002421 MMP1 0.88 2.79 2.27 Matrix metalloproteinase 1 Invasion
NM_004701 CCNB2* 0.88 2.78 1.43 Cyclin B2 Mitosis; Cell cycle
NM_006103 WFDC2/HE4 0.87 -3.07 0.45 WAP four-disulfide core domain 2; Epididymal
secretory protein E4 Immune response NM_012112 TPX2* 0.84 3.04 1.54 Microtubule-associated homolog (Xenopus laevis) Mitosis; Cell cycle NM_001034 RRM2* 0.84 2.81 1.69 Ribonucleotide reductase M2 polypeptide DNA repair NM_017680 ASPN/SLRR1C 0.83 -2.46 0.46 Asporin; Small leucine-rich repeat class 1 Adhesion NM_006197 PCM1* 0.82 -3.04 0.56 Pericentriolar material 1 Cell growth; Mitosis NM_007019 UBE2C/UBCH10* 0.82 2.85 1.49 E2 ubiquitin-conjugating enzyme Mitosis; Cell cycle NM_004217 AURKB/STK12* 0.80 3.07 1.52 Aurora B kinase Mitosis; Cell cycle NM_001461 FMO5* 0.78 -2.52 0.57 Flavin containing monooxygenase 5 Metabolism
AF326917 AUTS2* 0.77 -2.70 0.57 Autism susceptibility candidate 2 Unknown function NM_014056 HIGD1A/HIG1* 0.76 -2.97 0.49 HIG1 domain family, member 1A;
Hypoxia-inducible gene 1 Anti-apoptosis NM_003981 PRC1* 0.74 3.04 1.56 Protein regulator of cytokinesis 1 Mitosis; Cell cycle
AK001379 ASPM* 0.73 2.98 1.61 Abnormal spindle-like microcephaly-associated
protein Mitosis; Cell cycle
AB033114 MTUS1/ATIP1* 0.72 -2.78 0.63 Mitochondrial tumor suppressor 1; Angiotensin II
receptor-interacting protein Cell growth; Signalisation AL133047 SH3D19* 0.72 -2.90 0.65 SH3 domain protein D19 Signalisation
NM_006570 RRAGA* 0.72 -3.37 0.63 Ras-related GTP-binding A Signalisation NM_032471 PKIB 0.70 -2.57 0.47 Protein kinase A inhibitor beta ER activity regulation;
Signalisation NM_016441 CRIM1* 0.68 -2.34 0.65 Cysteine-rich motor neuron 1; Cysteine rich
transmembrane BMP regulator 1 Adhesion AF444143 SPG3A/ATL1* 0.68 -2.83 0.55 Atlastin-1; Spastic paraplegia 3A; GTP-binding
protein 3
Signalisation; Vesicle trafficking
NM_021999 ITM2B/BRI2* 0.67 -2.98 0.60 Integral membrane protein 2B; Transmembrane
protein BRI Apoptosis
NM_020038 ABCC3/MRP3 0.65 2.72 2.04 ATP-binding cassette, sub-family C (CFTR/MRP) member Multidrug resistance
NM_005824 LRRC17/P37NB* 0.65 -2.30 0.60 Leucine rich repeat containing 17 Unknown function NM_020347 LZTFL1* 0.64 -2.71 0.69 Leucine zipper transcription factor-like 1 Unknown function NM_003890 FCGBP 0.64 -2.45 0.53 Fc fragment IgG binding protein Immune response
NM_003258 TK1* 0.63 2.43 1.33 Thymidine kinase 1 DNA replication
NM_001786 CDC2/CDK1* 0.63 2.43 1.32 Cell division cycle 2, G1 to S and G2 to M; Cyclin-dependent kinase 1 Mitosis; Cell cycle Genes present in more than 60% of the 100 PAM iterative signatures are listed and the respective occurrence values (PAM Occur) are indicated. SAM scores and Fold-changes defined upon SAM analysis are indicated (R, patients with relapse; RF, relapse-free patients). Genes with a
Table 2 : Univariate and Multivariate Analysis of 36-gene Signature and Usual Pronostic Factors in Relation to DFS Predictive Factors
Odds Ratio 95% CI P Odds Ratio 95% CI P
A - Training set (132 patients)
36-gene signature: RF v. R 14.61 6.07 to 35.19 6.3 . 10-11 17.89 5.62 to 56.94
1.05 . 10-6
SBR Grade : I/II v. III 4.60 1.87 to 11.27 0.0008 1.46 0.37 to 5.74 0.59
Tumor size: < 20mm v. ! 20mm 1.99 0.86 to 4.57 0.11 - -
-PR: ! 20 fmol/mg v. <20 fmol/mg 3.68 1.49 to 9.07 0.005 2.73 0.68 to 10.91 0.16
Age: ! 55 years v. <55 years 1.87 0.57 to 6.10 0.31 - -
-ER: ! 20 fmol/mg v. < 20 fmol/mg 1.07 0.26 to 4.51 0.95 - -
-Node status: pN0 v. pN+ 4.58 2.03 to 10.33 0.0001 3.05 0.75 to 12.45 0.12
NPI : " 3.4 v. > 3.4 7.16 2.33 to 22.04 0.0001 3.27 0.64 to 16.82 0.16
Adjuvant ! : < 20% v. ! 20% 4.71 2.08 to 10.67 0.0002 1.22 0.31 to 4.76 0.78
B- Validation set (83 patients)
36-gene signature: RF v. R 3.96 1.56 to 10.05 0.004 3.01 1.01 to 9.14 0.05
SBR Grade : I/II v. III 2.02 0.76 to 5.39 0.17 - -
-Tumor size: < 20mm v. ! 20mm 2.16 0.83 to 5.60 0.12 - -
-PR: ! 20 fmol/mg v. <20 fmol/mg 2.16 0.72 to 6.52 0.18 - -
-Age: ! 55 years v. <55 years 2.41 0.62 to 9.30 0.22 - -
-ER: ! 20 fmol/mg v. < 20 fmol/mg 4.65 0.46 to 46.69 0.21 - -
-Node status: pN0 v. pN+ 2.37 0.92 to 6.10 0.08 - -
-NPI : " 3.4 v. > 3.4 5.96 1.25 to 28.33 0.013 2.27 0.35 to 14.35 0.38
Adjuvant ! : < 20% v. ! 20% 4.90 1.75 to 13.69 0.002 2.64 0.78 to 8.91 0.12
DFS, disease-free survival; RF, relapse-free; R, relapse; PR, progesterone receptor; ER, estrogen receptor; NPI, Nottingham prognostic index ; v., versus ; P, p value. Univariate and multivariate analyses were performed by logistic regression. Multivariate analysis was performed using the parameters found to be significant in univariate analysis.
Univariate Analysis Multivariate Analysis
Table 3 : Comparison of the 36-gene signature with other molecular signatures Predictive Factors
Odds Ratio 95% CI P
A - Training set (132 patients)
36-gene signature 14.61 6.07 to 35.12 6.4 . 10-11 Intrinsic subtypes 3.59 1.39 to 9.28 0.009 70-gene profile 2.73 1.3 to 5.75 0.008 Wound response 1.91 0.93 to 3.95 0.08 Two-gene ratio 0.68 0.42 to 1.76 0.68 GGI 5.99 2.57 to 13.96 1.0 . 10-5 MPI 6.95 3.12 to 15.47 7.6 . 10-7
B - Validation set (83 patients)
36-gene signature 3.96 1.56 to 10.05 0.004 Intrinsic subtypes 2.73 0.68 to 11.05 0.17 70-gene profile 1.84 0.75 to 4.45 0.19 Wound response 2.46 1.01 to 6.03 0.05 Two-gene ratio 3.94 1.55 to 9.97 0.004 GGI 1.88 0.77 to 4.60 0.17 MPI 2.00 0.83 to 4.82 0.13
Univariate analysis was performed using logistic regression (RF v. R); DFS, disease-free survival; RF, relapse-free patients; R, patients with relapse.
Univariate Analysis in terms of DFS
Table 4 : Functional classes of genes from the 36-gene predictive signature
Functional class 36-gene signature
Cell growth inhibition CX43 *, MTUS1 *, STC2
DNA replication and repair ASF1B, P15PAF, RRM2, TK1
Mitosis and cell cycle ASPM, AURKB, CCNB2, CDC2,PCM1 *, PRC1, TPX2, UBE2C
Adhesion/migration ASPN, CRIM1, CX43,MMP1
Metabolism ABCC3, FMO5
Signalisation MTUS1, OTUD7B, PKIB, RRAGA, SGK3, SH3D19, SPG3A
Immune response FCGBP, OTUD7B, WFDC2
ER activity PKIB, PNRC2
Cell death/survival CX43, HIGD1A, ITM2B *, P15PAF,RRAGA
Unknown function AUTS2 *, LRRC17 *, LZTFL1 *, ZBTB44
Genes overexpressed in R tumors (patients with relapse) are in red, those underexpressed are in green. Genes are in bold characters when assigned to their main functional class.
Putative tumor suppressor genes (TSG) are marked with a star (*).