HAL Id: hal-00327820
https://hal.archives-ouvertes.fr/hal-00327820
Preprint submitted on 27 Mar 2003HAL is a multi-disciplinary open access
archive for the deposit and dissemination of sci-entific research documents, whether they are pub-lished or not. The documents may come from teaching and research institutions in France or abroad, or from public or private research centers.
L’archive ouverte pluridisciplinaire HAL, est destinée au dépôt et à la diffusion de documents scientifiques de niveau recherche, publiés ou non, émanant des établissements d’enseignement et de recherche français ou étrangers, des laboratoires publics ou privés.
The Mt Cimone, Italy, free tropospheric campaign:
principal characteristics of the gaseous and aerosol
composition from European pollution, Mediterranean
influences and during African dust events
Yves Balkanski, S. E. Bauer, R. van Dingenen, P. Bonasoni, M Schulz, H.
Fischer, G. P. Gobbi, M. Hanke, D. Hauglustaine, J. P. Putaud, et al.
To cite this version:
Yves Balkanski, S. E. Bauer, R. van Dingenen, P. Bonasoni, M Schulz, et al.. The Mt Cimone, Italy, free tropospheric campaign: principal characteristics of the gaseous and aerosol composition from European pollution, Mediterranean influences and during African dust events. 2003. �hal-00327820�
ACPD
3, 1753–1776, 2003
The Mt Cimone, Italy, campaign: gaseous and aerosol composition Y. Balkanski et al. Title Page Abstract Introduction Conclusions References Tables Figures J I J I Back Close
Full Screen / Esc
Print Version Interactive Discussion
c
EGU 2003 Atmos. Chem. Phys. Discuss., 3, 1753–1776, 2003
www.atmos-chem-phys.org/acpd/3/1753/ c
European Geosciences Union 2003
Atmospheric Chemistry and Physics Discussions
The Mt Cimone, Italy, free tropospheric
campaign: principal characteristics of the
gaseous and aerosol composition from
European pollution, Mediterranean
influences and during African dust events
Y. Balkanski1, S. E. Bauer1, R. van Dingenen2, P. Bonasoni3, M. Schulz1,
H. Fischer4, G. P. Gobbi5, M. Hanke6, D. Hauglustaine1, J. P. Putaud2, A. Stohl7, and F. Raes2
1
Laboratoire des Sciences du Climat et de l’Environnement, 91190 Gif-sur-Yvette Cedex, France
2
Joint Research Center, 21020 Ispra, Italy
3
CNR ISAC, via Gobetti, 40129 Bologna, Italy
4
Max Planck Institute for Chemistry, POB 3060, 55020 Mainz, Germany
5
CNR, Via Fosso del Cavaliere, 00133 Rome, Italy
6
Max Planck Institute for Nuclear Physics, POB 103980, 69029 Heidelberg, Germany
7
Technical University of Munich, 85354 Freising-Weihenstephan, Germany
Received: 18 December 2002 – Accepted: 14 March 2003 – Published: 27 March 2003 Correspondence to: Y. Balkanski (balkansk@lsce.saclay.cea.fr)
ACPD
3, 1753–1776, 2003
The Mt Cimone, Italy, campaign: gaseous and aerosol composition Y. Balkanski et al. Title Page Abstract Introduction Conclusions References Tables Figures J I J I Back Close
Full Screen / Esc
Print Version Interactive Discussion
c
EGU 2003
Abstract
A 5 weeks experiment (1 June to 5 July 2000) took place at a mountain site, Mt Ci-mone (44◦110N, 10◦420E, 2165 m a.s.l.), that is representative of Southern Europe background conditions. During this field campaign, a comprehensive characterisation of trace gases and radicals, involved in the production and destruction of O3, as well
5
as of chemical, physical and optical properties of the aerosol was done. Atmospheric gases and aerosols were measured continuously over the 5 weeks period, in order to characterize their background concentrations in the free troposphere and their respec-tive differences in air containing dust aerosols advected from Africa. Due to its location and elevation, Mt Cimone gets free tropospheric air both from the Mediterranean and
10
from the Po Valley, which makes it an invaluable place to study gas/aerosol interactions. A global chemical model coupled to a GCM was used to simulate based upon ECMWF reanalysis the ozone over the region during the period of the field study. The heterogeneous reactions of O3, N2O5, HNO3 and NO3 were accounted for. We esti-mate that during the field campaign, the effect of heterogeous reactions was to reduce
15
by 8 to 10% the ozone concentration at MTC in cases when air had passed over the Mediterranean Sea. When air was coming from the Atlantic or continental Europe, the reduction of ozone is still 4%. This reduction is mostly due to the large uptake of HNO3 and is the the topic of ongoing work to assess how it affects the global cycle of O3and the global nitrogen budget.
20
1. Introduction
Dust provides surfaces for the gases to condense or be absorbed on. Numerous au-thors have reported observations of low ozone/high dust occurrences (Prospero et al., 1995; Dentener et al., 1996; Bonasoni et al., 1998; de Reus et al., 2000). Bonasoni et al. (1998) report concurrent measurements of dust and ozone at the Mt Cimone site
25
ACPD
3, 1753–1776, 2003
The Mt Cimone, Italy, campaign: gaseous and aerosol composition Y. Balkanski et al. Title Page Abstract Introduction Conclusions References Tables Figures J I J I Back Close
Full Screen / Esc
Print Version Interactive Discussion
c
EGU 2003 by the colorimetric Munsell soil-colour chart analysis. In 14 out of 20 events when dust
reached the site in appreciable amounts, concurrent ozone measurements revealed ozone decreases when the dust-loaded air reached the site. In 3 of the remaining 6 cases, no significant O3 variation was detected, and in the other 3 cases ozone in-creased. De Reus et al. (2000) analysed simultaneous airborne observations of dust
5
aerosol and ozone acquired on 8 July over the North Atlantic as part of the ACE 2 experiment. The dust layer span from 2.5 to 5.5 km altitude and O3 concentrations were measured as consistently lower in the dust layer compared to the altitudes above 5.5 km. The authors, using a box model which includes non methane hydrocarbon chemistry, estimated a corresponding O3 loss of 4 ppbV per day. Although a
reac-10
tion involving metal ions has been proposed to be responsible for the loss in ozone, the chemical reactions responsible for a possible ozone reduction remain to be identified in the laboratory. Observational data of NO−3 and nss-Ca2+ indicate that high concentra-tion of nitrate can be associated with calcium (Hirai et al. 1991; Prospero et al., 1995; Fig. 2a in Dentener et al., 1996). During events of significant dust transport across the
15
tropical Atlantic region, nitrate was found on the coarse mode of dust particles, sug-gesting its formation from nitrogen species on the dust particles (Prospero et al., 1995; Horai et al., 1993). In addition, Putaud et al. (this issue) show that nitrate is found on the coarse fraction of the aerosol and its formation is limited by ammonia availability. Fewer studies have tried to quantify the proportion of dust grains actually coated by
20
nitrate or sulfate. Parungo et al. (1995) used transmission electron microscopy and report that 40% of the particles captured over the China Sea region in the Asian out-flow were covered by sulphate. Despite these reports, measurements are too limited to determine whether reactions involving SO2, H2O2, N2O5, HNO3 and O3 are taking place on the dust. This lack of observational evidence and of a mechanism to describe
25
this gas/aerosol interactions motivated the pursuit of the MINATROC project, funded by the European Commission. Its goal is to document through laboratory, field and modelling work the heterogeneous processes occurring on dust. Two field campaigns are part of the project, of which the first one took place at Mt Cimone from 1 June to 5
ACPD
3, 1753–1776, 2003
The Mt Cimone, Italy, campaign: gaseous and aerosol composition Y. Balkanski et al. Title Page Abstract Introduction Conclusions References Tables Figures J I J I Back Close
Full Screen / Esc
Print Version Interactive Discussion
c
EGU 2003 July 2000. Its aim was to fully characterize the gas as well as the aerosol species with
a complete set of measurements in order to identify heterogeneous reactions on dust. Additionally, optical characterisations of the aerosols encountered during the campaign were made. The campaign was set up to bring together simultaneous gas and aerosol measurements in conditions when air devoid or laden with mineral dust reaches
South-5
ern Europe. These contrasted situations should allow for a quantification of the role of mineral dust in tropospheric chemistry.
Dry deposition of O3 on bare soil and sand suggests that uptake on dust is possi-ble. Measurements of the accommodation coefficient of ozone on dust confirm this (Hanisch and Crowley, 2002a). Further evidence gathered in laboratory studies shows
10
that HNO3 uptake by dust surfaces is very efficient (Hanisch and Crowley, 2001a; Hanisch et al., 2001b). The uptake of SO2 on CaCO3 has also been measured us-ing a low pressure Teflon coated reactor (Adams et al., 2002).
These studies raise the following questions: Why are O3 concentrations low in the presence of dust? Is it due to air advected from O3-poor regions, or, are these low
con-15
centrations of O3 on dust due to heterogeneous reactions directly on the surface, to decreased photochemical production in the presence of dust clouds or limited O3 pro-duction due to low NOx availability? This paper attempts to answer the first question: are the ozone concentrations low due to advection from O3-poor regions before reach-ing Mt Cimone? A companion paper will address the role of heterogeneous reactions
20
on ozone concentrations over the Mediterranean and Southern Europe.
In Sect. 1, we first review the measurements made in the course of the campaign. In Sect. 2, we distinguish the different influences at the site and propose a classification of the different air parcels encountered at the Mt Cimone station. The discussion in Sect. 3 is based on ozone concentrations simulated either by accounting for
homo-25
geneous chemistry alone either with heterogeneous reactions included. Finally, the ozone concentrations are analysed from the point of view of the region over which the air parcel spent the most recent days of 5-day back trajectories.
ACPD
3, 1753–1776, 2003
The Mt Cimone, Italy, campaign: gaseous and aerosol composition Y. Balkanski et al. Title Page Abstract Introduction Conclusions References Tables Figures J I J I Back Close
Full Screen / Esc
Print Version Interactive Discussion
c
EGU 2003
2. Description of the gas, aerosol and meteorological measurements made at Mt Cimone, Italy
Mt Cimone (44◦110N, 10◦420E) is a Global Atmospheric Watch site (GAW), where background air pollution is monitored. The station is located on the highest peak of the Northern Apennine chain at 2165 m a.s.l.. It is surrounded by a free horizon with
5
the Mediterranean Basin on the South and Southwest side and overlooks the Po Valley on the North and Northeast side. Surface O3, CO2 and particulate matter are rou-tinely monitored at the site, respectively since 1979 and 1991. In most conditions, air sampled at Mt Cimone is representative of free tropospheric air, but daytime sum-mer measurements are affected by upslope winds, which occasionally deliver polluted
10
air from the Po Valley to the site. During the campaign from 1 June to 5 July 2000, in-situ physical, chemical and radiative properties of the Mediterranean “free” tropo-sphere were analyzed both during and without Saharan dust intrusions. The campaign at Monte Cimone (MTC), originally planned to last 4 weeks was extended by a 5th week since no significant dust event had been observed during the first four weeks, but
15
the meteorological forecast was favorable for the 5th week. The elevation of the site (2165 m a.s.l.) provided an opportunity rarely taken before to study the remote tropo-sphere over periods of several weeks. The diurnal variations of NOy, NOx, O3, ROx, CO, formaldehyde and VOCs unraveled that O3was produced in this environment with little local pollution (see Fischer et al., 2002; Hanke et al., 2002). Table 1 indicates the
20
instruments deployed and the measurements made during the campaign. The aerosol physical and chemical properties were identified through the following measurements (van Dingenen et al.; Putaud et al.; Gobbi et al., this issue):
– Number size distributions from Differential Mobility Analyzer (6–600 nm). – Number distributions from Optical Particle Counter (0.3–10 µm).
25
– Total number, surface area, volume concentration derived from DMA and OPC
ACPD
3, 1753–1776, 2003
The Mt Cimone, Italy, campaign: gaseous and aerosol composition Y. Balkanski et al. Title Page Abstract Introduction Conclusions References Tables Figures J I J I Back Close
Full Screen / Esc
Print Version Interactive Discussion
c
EGU 2003
– High time resolution ionic composition in fine fraction (< 1 µm).
– Aerosol chemistry from impactor samples (of which OC/EC analysed at JRC). – Aerosol absorption coefficient and equivalent black carbon concentration. – Aerosol hygroscopicity at 90% RH.
– Refractory aerosol size distributions.
5
The chemical composition of the aerosol was analysed by measuring on-line con-centrations of the main ions (Na+, NH+4, K+, Mg2+, Ca2+, Cl−, NO−3, SO2−4 ) present in the submicron aerosol fraction. Sampling was done with 15 min time intervals using a wet aerosol denuder steam jet aerosol collector combination. The detection limits for the setup is better than 0.1 µg m−3. For most of the campaign time, just NH+4, NO−3, and
10
SO2−4 were detected with significant concentrations (see Putaud et al., this issue). The displacement of NO−3 from the submicronic mode in the absence of dust, to the super micronic mode in the presence of dust is indicative of an efficient uptake of HNO3 on the dust surface. By opposition, Putaud et al., report could not detect any interaction with SO2during the dust episode.
15
3. Identification of dust events and ozone concentrations during the campaign
Gobbi et al. (this issue) report profiles of aerosol extintion, depolarisation, surface area and volume retrieved by the LIDAR during the MTC campaign. Furthermore, the authors attempted a closure analysis on the same quantities using aerosol size distri-butions observed by the DMA and OPC instruments . During the 1–30 June period,
20
no significant dust event was observed at the elevation of the site although the LIDAR evidenced 5 instances indicated in Fig. 1 when dust layers appeared aloft. Therefore, a large part of this data can be considered representative of continental background conditions. In only 1 case out of 5, from 2–4 July 2000, did the dust layers extend
ACPD
3, 1753–1776, 2003
The Mt Cimone, Italy, campaign: gaseous and aerosol composition Y. Balkanski et al. Title Page Abstract Introduction Conclusions References Tables Figures J I J I Back Close
Full Screen / Esc
Print Version Interactive Discussion
c
EGU 2003 down to the altitude of the Mt Cimone Observatory. This allowed for a full chemical
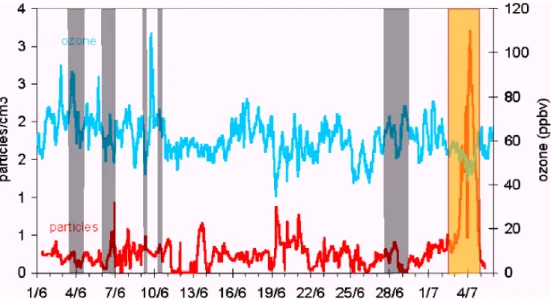
characterization of the air mass. The arrival of the dust cloud at the site was clearly indicated by the OPC data where a significant increase in coarse aerosol number and volume was observed (Fig. 1). Although this last dust event was not particularly strong, a maximum of 3.2 particles/cm3 (size > 1 mm) and a simultaneous O3 decrease was
5
detected during the dust transport episode. A marked influence of Saharan dust on the HNO3concentration could be registered (Hanke et al., 2002) during the dust intrusion of 3–4 July: at the onset of the dust event in the early morning of 3 July, the HNO3 concentration started to decrease continuously and reached its minimum in the early morning of the next day. After a short period of passing clouds and slight rain around
10
noon of 4 July, HNO3recovered again. In contrast, SO2does not show such a clear in-fluence of dust. Both aerosol scattering and absorption coefficients are not significantly altered during the dust event. These parameters are dominated by the sub-micrometer aerosol (continental background) which is mixed with the dust.
3.1. The LMDZ-INCA model
15
LMDZ-INCA is composed of a chemical model (INCA: Interactions with Chemistry and Aerosols) which is embedded into a General Circulation Model (GCM) developed by the Laboratoire de Mtorologie Dynamique. INCA treats the emissions, photochemical transformations and deposition of chemical tracers interactively in the GCM. We used a reasonably high resolution for a global model, 160×98 (2.25× 1.84◦ in respectively
20
longitude and latitude) with 19 σ-p hybrid vertical levels. The model is run in a nudged mode by relaxing the wind components to the corresponding ECMWF analysis. In this way the meteorological fields of the model are consistent with the actual meteorological conditions at the time of the sampling. The chemistry version used is based upon the implementation of a methane oxidation scheme to calculate interactively tropospheric
25
ozone and OH. Emissions and chemistry of CH4, CO, and NOx are included. Typ-ically this version includes 43 tracers and roughly 100 photochemical reactions and several aerosol types including dust are included with a spectral scheme to represent
ACPD
3, 1753–1776, 2003
The Mt Cimone, Italy, campaign: gaseous and aerosol composition Y. Balkanski et al. Title Page Abstract Introduction Conclusions References Tables Figures J I J I Back Close
Full Screen / Esc
Print Version Interactive Discussion
c
EGU 2003 size distribution. Different aerosol components are included in the model, in
partic-ular, seasalt, dust, sulfate and carbonaceous aerosols are explicitly resolved and we account for their solubility. The heterogeneous reactions of O3, N2O5, HNO3and NO3 on dust were included. The accomodation coefficient for these reactions were cho-sen based upon laboratory studies that were performed within the MINATROC project
5
(Hanisch and Crowley, 2001a; 2001b; 2002a and 2002b), respectively 1.e-5, 0.02 to 3.e-3 depending on relative humidity, 0.1 and 3.e-3. Note that the reaction of NO3on dust has not been measured in the laboratory to our knowledge.
3.2. Summertime ozone features simulated over the region
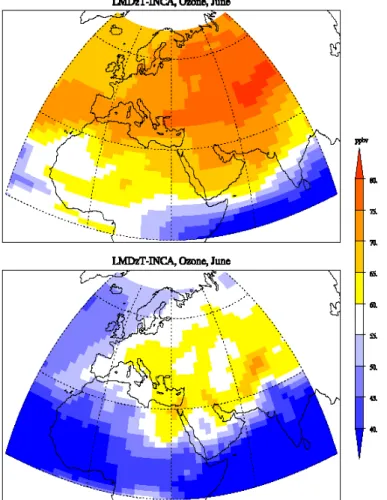
The features of the ozone distribution are dominated in June by a maximum over
Cen-10
tral Europe that extends to the Middle East region. Monthly mean ozone concentrations at the elevation of MTC (780 mb) show a maximum over the region that covers the Mid-dle East and parts of Central Europe (Fig. 2). The strong summertime O3 maximum over the Middle East region has been first documented by Li et al. (2001). Three sites, Tel-Aviv, Dubai and Teheran, showed a pronounced maximum ozone concentration in
15
the free troposphere. Simulated vertical profiles of ozone agreed well with measure-ments from the MOZAIC program aboard commercial aircraft (Marenco et al., 1998; Stohl et al., 2001). The maximum was attributed to a complex coupling between dy-namical and chemical processes. During summer, ozone produced over the region experiences large scale subsidence which participates in the observed maximum. The
20
position of this summertime maximum is best defined in the model at 400 mb (upper panel of Fig. 2 and Fig. 1 of Li et al., 2001). Other contributions to this feature of the ozone distribution were identified by Li et al. (2001) by switching off the main sources of O3 precursors. Model results showed that sources from Europe and North Amer-ica supply 4 to 12 ppbv of 400 hPa O3 in the northern part of the Middle East region
25
whereas Asian sources contribute to more than 8 ppbV of ozone over its southern part. This ozone maximum is also simulated with the LMDZ-INCA model. In both months, June and July, O3precursors produced over Western and Central Europe create
rela-ACPD
3, 1753–1776, 2003
The Mt Cimone, Italy, campaign: gaseous and aerosol composition Y. Balkanski et al. Title Page Abstract Introduction Conclusions References Tables Figures J I J I Back Close
Full Screen / Esc
Print Version Interactive Discussion
c
EGU 2003 tively strong North-South and East-West gradients across the Mediterranean Sea (see
Fig. 2, lower panel). Over the African continent, the East-West ozone concentration gradient reflects the circulation of air from the South of the ozone maximum located over the Middle East to the African region. In addition, ozone precursors from Europe are transported over the Eastern Mediterranean region.
5
Air mass back trajectories arriving at the site were analysed to study whether changes in gas/aerosol concentrations and composition were attributable to the emissions over a wide geographical region. These trajectories were computed using the FLEXTRA model (Stohl et al., 1995). Following the study of Bonasoni et al. (2000) for Mt Cimone, six regions were identified as having different signatures (see Fig. 3). These regions
10
are: North-West Europe (NW-EUR), Atlantic-West Europe (ATL/W-EUR), Eastern Eu-rope (E-EUR), the Mediterranean region (MED), Africa (AFR) and Arctic (ARC). Back trajectories were assigned to one of these regions based upon where the air parcel spent most of its time before its arrival at MTC (Fig. 3). Hence a trajectory is chosen to be from a given sector based upon air mass characteristics of the region during its
15
transit to the receptor site, as in the study of Pochanart et al. (2001) who showed that gases and aerosol properties strongly depend on the number of days a parcel spends over a given source region.
4. Discussion of the ozone concentrations at Mt Cimone
The ozone field shown on Fig. 2 (bottom panel) for June indicates that the main
gradi-20
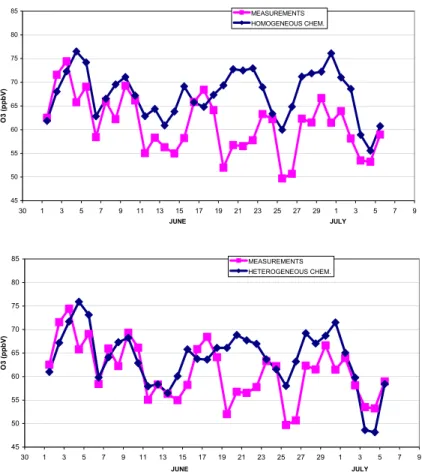
ents for ozone across the Mediterranean Region are a North-South and an East-West gradient. The ozone time series at MTC during the period 1 June–5 July 2000 is pre-sented in Fig. 4 together with the concentrations simulated by the LMDZ-INCA model with the assumption of homogeneous chemistry alone (top panel) and the heteroge-neous reactions listed above included (bottom panel). The whole period can be divided
25
ACPD
3, 1753–1776, 2003
The Mt Cimone, Italy, campaign: gaseous and aerosol composition Y. Balkanski et al. Title Page Abstract Introduction Conclusions References Tables Figures J I J I Back Close
Full Screen / Esc
Print Version Interactive Discussion
c
EGU 2003
– 1–5 June is characterised by high ozone concentrations (62 to 75 ppbV) with back
trajectories coming from W-EUR, NW-EUR and on 5 June from E-EUR.
– The next period spans 10 days from 6–15 June and is dominated by influences
coming from the MED region with boundary layer air arriving at the site as indi-cated by the number of Aitken nuclei.
5
– A period of 3 days (16–18 June) follows, when air coming from NW-EUR and
E-EUR brings about high ozone concentrations (64 to 68 ppbV). For all three pe-riods presented so far, simulated ozone concentrations agree very well with the measured ones and the heterogeneous reactions are not important.
– The next and longest period spans from 19–30 June. Very low ozone
concen-10
trations occur in 2 instances: on 19 June and for 2 consecutive days, 25 and 26 June. On the first instance air coming from the Arctic brings about low ozone concentration, this situation is not reproduced by the model. On 25–26 June, the air is advected from the boundary layer over W-EUR with remarquably low concentrations (50-51 ppbV) which is captured by the simulation.
15
– Finally, the last period (1–5 July) which includes the dust episode recorded at
Mt Cimone, is characterised by air masses coming from the Mediterranean and African regions. This is when the influence of the heterogeneous reactions is most clear. The model reproduces well both the decline and the recovery in ozone concentrations and overpredicts slightly the dip in daily mean concentrations that
20
accompany the dust on 3 and 4 July (Fig. 4).
To find out whether the low ozone concentrations that are observed together with dust events are attributable to the photochemical regime over the regions of dust produc-tion rather than to heterogeneous processes on the surface of dust, we examined ozone concentrations along the computed back trajectories arriving at MTC. We used
25
5 days back trajectories that were computed every 3 h. At each grid box location along the back trajectory, daily mean ozone concentrations simulated by LMDZ-INCA were
ACPD
3, 1753–1776, 2003
The Mt Cimone, Italy, campaign: gaseous and aerosol composition Y. Balkanski et al. Title Page Abstract Introduction Conclusions References Tables Figures J I J I Back Close
Full Screen / Esc
Print Version Interactive Discussion
c
EGU 2003 recorded. Figure 5 presents the O3 concentrations at the time of arrival and for each
of the 5 days preceding the arrival at MTC in the case ran with homogeneous chem-istry. The influence of the origin of the air masses on ozone concentrations can be grouped into two categories. For air masses originating from NW-EUR, W-EUR and E-EUR the averaged ozone concentration measured at MTC over the period is 60 ppbV
5
(resp. from 61 to 67 ppbV in the model). In the 24-h before the arrival of the air mass at MTC the averaged simulated ozone concentrations only differ by 1 to 5 ppbV (Ta-ble 2). The concentrations averaged over 24-h periods from day 2 to 5 of along the back trajectories are indicated in Table 2. Air masses originating either the MED and AFR regions arrive at MTC with lower ozone concentrations than from any european
10
sector. Measured averaged ozone concentrations are 57 and 56 ppbV, respectively for Mediterranean and Africa sectors. The simulated ozone concentrations for the same regions are 61 and 57 ppbV, respectively (Table 2). The comparison of the concentra-tions between the simulation with homogeneous reacconcentra-tions and heterogeneous reac-tions permits to quantify the effect of these reactions (Table 2). For air coming from
15
the MED and AFR regions, the ozone concentrations at MTC, indicative of free tropo-spheric air, are reduced respectively by 5 and 6 ppbV (respectively 8 and 10%) due to heterogeneous chemistry. The uptkake of HNO3 onto mineral dust is important since a change in NOy will influence both O3 and NOx concentrations. The measurements of uptake coefficients of HNO3 on CaCO3 and mineral dust using a Knudsen reactor
20
have lead to large differences: Underwood et al. (2001) reported a γ of approximately 10−5, whereas Hanisch et al. (2001b) measured an accomodation coefficient of 10−1. Working with an aerosol flow reactor that allows to mimick better the flow of HNO3than in the case of the Knudsen reactor, (Hanisch and Crowley, 2002) using genuine Saha-ran dust found an accomodation of 0.1 equal to the one deduced from their Knudsen
25
reactor experiments. This very fast uptake of HNO3on dust is consistent with the very steep decrease in concentration that Hanke et al. report in this issue.
ACPD
3, 1753–1776, 2003
The Mt Cimone, Italy, campaign: gaseous and aerosol composition Y. Balkanski et al. Title Page Abstract Introduction Conclusions References Tables Figures J I J I Back Close
Full Screen / Esc
Print Version Interactive Discussion
c
EGU 2003
5. Conclusions
In conclusion, an unprecedented, high quality data set has been obtained for the period 1 June–5 July 2000, characteristic of both continental background conditions as well as a moderate dust episode. A comprehensive dataset on aerosol as well as gas phase properties is available for process studies as well as for model validation.
5
A global chemical model coupled to a GCM was used to simulate based upon ECMWF reanalysis the ozone over the region during the period of the field study. The ozone concentrations over Southern Europe and the Mediterranean region are dominated over the summer by a maximum over Central Europe and the Middle East region.
10
Daily mean ozone concentrations at Mt Cimone are 4 ppbV lower when air is ad-vected from the Mediterranean Basin or Africa rather than when air was adad-vected from Europe.
The effect of heterogeneous chemistry estimated using accomodation coefficient re-ported by the latest laboratory studies is to reduce by 8 to 10% the ozone
concentra-15
tion at MTC in cases when air had passed over the Mediterranean Sea. When air was coming from the Atlantic or continental Europe, the reduction of ozone is still 4%. This reduction which is partly due to the large uptake of HNO3, is the the topic of ongoing work to assess its effect on O3and NOxon the global scale.
Acknowledgements. This work was supported by the European Commission (DG XII) in the
20
frame of the project EVK2-CT-1999-00003 MINATROC.
References
Adams, J. R. and Cox, P: Griffiths and D. Stewart, Reactive uptake of gases on mineral aerosols, in Proceedings of the 27th General Assembly of the European Geophysical So-ciety, 21–26 April 2002, Nice, France, Geophysical Research Abstract, 4, 2002.
ACPD
3, 1753–1776, 2003
The Mt Cimone, Italy, campaign: gaseous and aerosol composition Y. Balkanski et al. Title Page Abstract Introduction Conclusions References Tables Figures J I J I Back Close
Full Screen / Esc
Print Version Interactive Discussion
c
EGU 2003 Bauer S., Balkanski, Y., Schulz, M., Hauglustaine D., and Dentener, F.: Heterogeneous
chem-istry on mineral dust aerosol surfaces: Influence on the global tropospheric ozone chemchem-istry, to be submitted to J. Geophys. Res., 2003.
Bonasoni P., Bonaf ´e, U., Colombo, T., Santaguida, R., Lenaz, R., and Tesi, G.: Effect of dust transport on trace gases concentration, in: XVIII Quade. Ozone Symp., l’Aquila, Italy, 12–21
5
September 1996, Bojkov, Visconti (Eds.), 323–326, 1998.
Bonasoni P., Stohl , A., Cristoganelli, P., Calzolari, F., and Colombo, T.: Bakground ozone vriations at Mt Cimone Station, Atmospheric Environment, 34, 5183–5189, 2000.
Bonasoni, P., Cristofanelli, P., Calzolari, F., Bonaf ´e, U., Evangelisti, F., Van Dingenen, R., Colombo, T., and Balkanski, Y.: Aerosol and ozone correlation during the dust transport
10
episodes of the summer-autumn 2000 period, this issue.
Dentener F. J., Carmichael, G. R., Zhang, Y., Lelieveld, J., and Crutzen, P. J.: Role of mineral dust as a reactive surface in the global troposphere, J. Geophys. Res., 101, 22 869–22 889, 1996.
de Reus, M., Dentener, F., Thomas, A., Borrmann, S., Str ¨om, J., and Lelieveld, J.: Airborne
15
observations of dust aerosol over the North Atlantic Ocean during ACE2: Indications for heterogeneous ozone destruction, J. Geohpys. Res., 105, D12, 15 263–15 275, 2000. Fischer, H., Kormann, R., Kl ¨upfel, T., Gurk, Ch., K ¨onigstedt, R., Parchatka, U., M ¨uhle, J., Rhee,
T. S., Brenninkmeijer, C. A. M., Bonasoni, P., and Stohl, A.: Ozone production and trace gas correlations during the June 2000 MINATROC intensive measurement campaign at Mt.
20
Cimone, Atmos. Chem. Phys. Discuss., 2, 1509–1543, 2002.
Gobbi, G. P., Barnaba, F., Van Dingenen, R., Putaud, J. P., Mircea, M., and M. C. Facchini: Lidar and in situ observations of continental and saharan aerosol: closure analysis of particles optical and physical properties, this issue.
Gobbi, G. P., Barnaba, F., Giorgi R., and Santacasa, A.: Altitude-resolved properties of a
Sa-25
haran dust event over the Mediterranean, Atmospheric Environment, 34, 5119–5127, 2000. Hanisch, F. and Crowley, J. N.: Heterogeneous reactivity of gaseous nitric acid on Al2O3,
CaCO3, and atmospheric dust samples: A Knudsen cell study, J. Phys. Chem., 105, 3096– 3106, 2001a.
Hanisch, F. and Crowley, J. N.: The heterogeneous reactivity of gaseous nitric acid on authentic
30
mineral dust samples, and on individual mineral and clay mineral components, Phys. Chem. Phys., 3, 2474–2482, 2001b.
inves-ACPD
3, 1753–1776, 2003
The Mt Cimone, Italy, campaign: gaseous and aerosol composition Y. Balkanski et al. Title Page Abstract Introduction Conclusions References Tables Figures J I J I Back Close
Full Screen / Esc
Print Version Interactive Discussion
c
EGU 2003 tigation, Atmos. Chem. Phys. Discuss., 2, 1809–1845, 2002a.
Hanisch, F. and Crowley, J. N.: Heterogeneous reactivity of NO and HNO3 on mineral dust in the presence of ozone, submitted to Phys. Chem. Phys., 2002b.
Hanke M., Umann, B., Uecker, J., Arnold, F., and Bunz, H.: Atmospheric measurements of gas-phase HNO3and SO2using chemical ionization mass spectrometry during the minatroc
5
field campaign 2000 on Monte Cimone, Atmos. Chem. Phys. Discuss., 2, 2209–2258, 2002. Hirai E., Miyazaki, M., Chohji, T., Lee, M., Kitamura, M., and Yagamuchi, K.: Effect of Kosa aerosol on inorganic ion components in rainwater collected in cicum-pan-Japan-Sea area, Proceeding of the 2nd IUAOOA Regional conference on Air Pollution, Seoul, Korea, Korea Air Research Association, 27–34, 1991.
10
Horai, S., Minari, I., and Migita, Y.: Aerosols Composition In Kagoshima in the Annual Report of the Kagoshima Prefectural Institute, 9, 1993.
Li, Q., Jacob, D. J., Logan, J. A., Bey, I., Yantosca, R. M., Liu, H., Martin, R. V., Fiore, A. M., Field, B. D., and Duncan, B. N.: A trospospheric maximum ozone over the Middle East, Geophys. Res. Let., 28, 3235–3238, 2001.
15
Marenco, A., Thouret, V., N ´ed ´elec, P., et al.: Measurement of ozone and water vapor by Airbus in-servive aircraft: The MOZAIC airborne program, An overview, J. Geophys. Res., 103, 25 631–25 642, 1998.
Parungo, F., Kim, Y., Zhu, C.-J., et al.: Asian dust storms and their effects on radiation and climate, STC Rep. 2906, (available from Science and Technology Coporation, 101 Research
20
Drive, Hampon, VA. 23666, USA), 1995.
Pochanart, P., Akimoto, H., Maksyutov, S., and Staehelin, J.: Surface ozone at the Swiss Alpine site Arosa: the hemispheric background and the influence of large-scale anthropogenic emis-sions, Atmospheric Environment, 35, 5553–5566, 2001.
Prospero, J. M., Schmidtt, R., Cuevas, E., Savoie, D. L., Graustein, W. C., Turekian, K. K.,
Volz-25
Thomas, A., Dias, A., Oltmas, S. J., and Levy II, H.: Temporal variability of summer-time ozone and aerosols in the free troposphere over the eastern North Atlantic, Geoph. Res. Let., 22, 2925–2928, 1995.
Putaud J. P., van Dingenen, R., Dell’Acqua, A., Matta, E., Decesari, S., Facchini, M. C., and Fuzzi, S.: Size-segregated aerosol mass closure and chemical composition in Monte Cimone
30
(I) during Minatroc, this issue.
Stohl, A., Wotawa, G., Seibert, P., and Kromp-Kolb, H.: Interpolation errors in wind fields as a function of spatial and temporal resolution and their impact on different types of kinematic
ACPD
3, 1753–1776, 2003
The Mt Cimone, Italy, campaign: gaseous and aerosol composition Y. Balkanski et al. Title Page Abstract Introduction Conclusions References Tables Figures J I J I Back Close
Full Screen / Esc
Print Version Interactive Discussion
c
EGU 2003 trajectories, J. Appl. Meteorology, 34, 2149–2165, 1995.
Stohl, A., James, P., Forster, C., Spichtinger, N., Marenco, A., Thouret, V., and Smit, H. G. J.: An extension of Measurements of Ozone and Water Vapor by Airbus In-service Aircraft (MOZAIC) ozone climatologies using trajectory statistics, J. Geophys. Res., 106, 27 757– 27 768, 2001.
5
Underwood, G. M., Li, P., Al-Abadleh, H., and Grassian, V. H.: A Knudsen Cell Study of the Heterogeneous Reactivity of Nitric Acid on Oxide and Mineral Dust Particles, Journal of Physical Chemistry A, 105, 6609–6620, 2001.
Van Dingenen, R., Putaud, J.-P., and Raes, F.: Physical aerosol properties and their rela-tion to air mass origin at Monte Cimone (Italy) during the first MINATROC campaign, this
10
ACPD
3, 1753–1776, 2003
The Mt Cimone, Italy, campaign: gaseous and aerosol composition Y. Balkanski et al. Title Page Abstract Introduction Conclusions References Tables Figures J I J I Back Close
Full Screen / Esc
Print Version Interactive Discussion
c
EGU 2003
Table 1. Overview of instrumentation and methods deployed during the Monte Cimone
cam-paign (to be continued on next pages)
Parameter Instrument/method Partner
Gas phase chemistry
HO2andPRO2 ROXMAS MPIK Heidelberg
SO2and HNO3 CIMS MPIK Heidelberg
SO2and HNO3 Wet annular denuder+ IC JRC Ispra
O3 UV absorption CNR-ISAO, MPIK Heidelberg
CO2 ULTRAMAT-5E Siemens NDIR CNR-ISAO+AM CAMM
NO2, HCHO, H2O(∗)2 TDLAS MPI Mainz
NO(∗) Chemiluminescence detector (CLD) MPI Mainz
NOy(∗) Catalytic converter+ CLD MPI Mainz
CO GC+ FID MPI Mainz, CNR-ISAO
ROx peroxy radical chemical amplifier MPI Mainz NMVOC(#) Canister sampling+ off-line analysis MPI Mainz J(O1D)(∗) up-and downward radiation flux in the UV-B range MPI Mainz
(∗)
Not available during the dust event.
(#)
Ethane, ethene, propane, propene, iso-butane, butane, acetylene, trans-2-butene, 1-butene, iso-butene, cis-2-butene, 2-methylbutane, pentane, propine, 1,3-butadiene, trans-2-pentene, cis-2-pentene, cyclohexane, 2-methylpentane, 3-methylpentane, hexane, isoprene, heptane, benzene, toluene, sulfur hexafluoride, carbon dioxide, methane, nitrous oxide.
ACPD
3, 1753–1776, 2003
The Mt Cimone, Italy, campaign: gaseous and aerosol composition Y. Balkanski et al. Title Page Abstract Introduction Conclusions References Tables Figures J I J I Back Close
Full Screen / Esc
Print Version Interactive Discussion
c
EGU 2003
Table 1. Continued.
Parameter Instrument/method Partner
Aerosol chemistry
Water soluble inorganic+ water 5 stage impactor, double substrate. CNR-ISAO soluble organic content+ EC + Analysis with IC, Total Organic Carbon
gravimetric mass (12 h time resolution) analyzer, speciation of WSOC by HNMR
Major ions Steam jet aerosol collector+ IC on-line JRC Ispra (15 min time resolution) (fine/coarse fraction), artefact-free
Major ions Fine/coarse fraction on whatman filter, JRC Ispra (12 h time resolution) IC off-line
Total organic carbon and EC Fine/coarse fraction on quartz filter JRC Ispra (12 h time resolution) + evolved gas analysis
Elemental composition/ High-volume samples (PM10) on JRC Ispra+ CNRS Paris mineralogy (12 h time resolution) whatman, analysis by WHICH TECHNIQUE
Aerosol physical properties
Number concentration >15 nm Condensation nuclei Counter JRC Ispra+ CNR-ISAO Number size distribution (6–600 nm) Differential Mobility Analyzer (DMA) JRC Ispra
(5 min time resolution)
Number size distribution (300 nm Optical particle Counter (OPC) JRC Ispra –10 µm) (1 min time resolution)
Aerosol volatility (6–600 nm) DMA+ thermodenuder at 300◦C JRC Ispra (5 min time resolution)
Aerosol hygroscopicity Humidity Tandem DMA JRC Ispra
ACPD
3, 1753–1776, 2003
The Mt Cimone, Italy, campaign: gaseous and aerosol composition Y. Balkanski et al. Title Page Abstract Introduction Conclusions References Tables Figures J I J I Back Close
Full Screen / Esc
Print Version Interactive Discussion
c
EGU 2003
Table 1. Continued.
Parameter Instrument/method Partner
Aerosol optical properties
In-situ scatter coefficient White light nephelometer CNRS Paris In-situ light absorption coefficient Aethalometer JRC Ispra Vertical profile of backscatter VELIS LIDAR CNR-IFA Roma ratio and depolarisation ratio (profile
includes measurement station altitude)
Aerosol optical depth multi-band sunphotometers (CIMEL) CNR-IFA Roma
Meteorological parameters
T, RH, Pressure, wind direction CNR-ISAO
and wind speed
10-days back trajectories analysis FLEXTRA model CNR-ISAO
Forecasts and analysis
Meteorological BOLAM model, ISAO
METEOSAT IR, VIS, WV maps Facilities at the Monte 6 days 3D-back trajectories HYSPLIT model, NOAA ARL Cimone station provided Dust load, surface DREAM model, Uni. Malta by CNR-ISAO through
concentration forecasts URL connection.
Dust optical depth NAAPS model, NRL Monterey
ACPD
3, 1753–1776, 2003
The Mt Cimone, Italy, campaign: gaseous and aerosol composition Y. Balkanski et al. Title Page Abstract Introduction Conclusions References Tables Figures J I J I Back Close
Full Screen / Esc
Print Version Interactive Discussion
c
EGU 2003
Table 2. Ozone concentrations (ppbV) along air masses coming from the different wind sectors
defined in the text. For columns 5 trough 9, the concentrations in parenthesis for the run with homogeneous chemistry only and numbers without parenthesis are for the simulation including heterogeneous reactions with O3, N2O5, HNO3and NO3
REGION # trajectories % of all trajectories
Measured daily O3 (ppbV) at Mt Cimone Simulated daily ozone at Mt Cimone Simulated ozone averaged for 24 h before its arrival at Mt Cimone Idem but between 24 and 48 h before air mass arrives at Mt Cimone Idem but between 48 and 72 h before air mass arrives at Mt Cimone Idem but between 72 and 96 h before air mass arrives at the station Idem but between 96 and 120 h before air mass arrives at the station NW-EUR 34 13 60 65 (68) 62 (65) 51 (54) 49 (52) 49 (51) 50 (52) W-EUR 61 24 60 66 (69) 61 (64) 54 (58) 54 (57) 54 (57) 56 (58) E-EUR 39 15 60 68 (71) 67 (70) 62 (66) 60 (65) 62 (66) 61 (65) MED 88 34 56 61 (66) 59 (64) 56 (61) 57 (60) 57 (61) 58 (62) AFR 26 10 57 57 (63) 56 (62) 53 (59) 54 (58) 54 (59) 55 (61) No Class 11 4 64 71 (73) 67 (70) 59 (62) 54 (58) 51 (53) 65 (57) All Cases 259 100 59 64 (68) 61 (65) 56 (60) 56 (59) 56 (59) 57 (60) 1771
ACPD
3, 1753–1776, 2003
The Mt Cimone, Italy, campaign: gaseous and aerosol composition Y. Balkanski et al. Title Page Abstract Introduction Conclusions References Tables Figures J I J I Back Close
Full Screen / Esc
Print Version Interactive Discussion
c
EGU 2003
Figure 1. Number concentration of aerosol particles with diameter >1 µm and surface ozone concentration for the period June 1 - July 5 2000 at Mt Cimone, Italy. The periods when dust layers were detected by the LIDAR are indicated by the shaded grey and yellow. The yellow shading indicates the only period when both significant dust amounts were measured by the optical particle counter at the Observatory and dust layers were detected by the LIDAR. Dust layers were identified through the measure of the depolarization ratio (indicative of the asymmetry of the particle).
Fig. 1. Number concentration of aerosol particles with diameter > 1 µm and surface ozone
con-centration for the period 1 June–5 July 2000 at Mt Cimone, Italy. The periods when dust layers were detected by the LIDAR are indicated by the shaded grey and yellow. The yellow shading indicates the only period when both significant dust amounts were measured by the optical particle counter at the Observatory and dust layers were detected by the LIDAR. Dust layers were identified through the measure of the depolarization ratio (indicative of the asymmetry of the particle).
ACPD
3, 1753–1776, 2003
The Mt Cimone, Italy, campaign: gaseous and aerosol composition Y. Balkanski et al. Title Page Abstract Introduction Conclusions References Tables Figures J I J I Back Close
Full Screen / Esc
Print Version Interactive Discussion
c
EGU 2003
Figure 2. June monthly mean ozone concentrations in ppbV at 400mb (Upper panel) and 780 mb (lower panel) simulated by the LMDZ-INCA model.
Fig. 2. June monthly mean ozone concentrations in ppbV at 400mb (Upper panel) and 780 mb
ACPD
3, 1753–1776, 2003
The Mt Cimone, Italy, campaign: gaseous and aerosol composition Y. Balkanski et al. Title Page Abstract Introduction Conclusions References Tables Figures J I J I Back Close
Full Screen / Esc
Print Version Interactive Discussion c EGU 2003 30 35 40 45 50 55 60 -25 -15 -5 5 15 25
Figure 3. Average position of the air mass associated to each trajectory. The coordinates of these points were obtained using a weight factor averaged along the trajectory. The weight factor is 1 at the time of arrival at MTC, and decays with 4%/backward per hour along the trajectory. This yields weight factors of 0.38, 0.14 and 0.05 respectively for 1, 2 and 3 days backward. By plotting these average positions on a map, one gets an idea of the "zone" contributing to the air mass properties before arriving at MTC.
ARC NW-EUR W-EUR E-EUR MED AFR
Fig. 3. Average position of the air mass associated to each trajectory. The coordinates of these
points were obtained using a weight factor averaged along the trajectory. The weight factor is 1 at the time of arrival at MTC, and decays with 4%/backward per hour along the trajectory. This yields weight factors of 0.38, 0.14 and 0.05, respectively for 1, 2 and 3 days backward. By plotting these average positions on a map, one gets an idea of the “zone” contributing to the air mass properties before arriving at MTC.
ACPD
3, 1753–1776, 2003
The Mt Cimone, Italy, campaign: gaseous and aerosol composition Y. Balkanski et al. Title Page Abstract Introduction Conclusions References Tables Figures J I J I Back Close
Full Screen / Esc
Print Version Interactive Discussion
c
EGU 2003
Figure 4. Time series of daily mean ozone concentrations at Mt Cimone. The squares represent the measured concentrations (ppbV) while the diamonds are the ozone concentrations simulated by the LMDZ-INCA model. Ozone measurements were taken by Paolo Bonasoni from CNR-ISAC, Bologna.
45 50 55 60 65 70 75 80 85 30 1 3 5 7 9 11 13 15 17 19 21 23 25 27 29 1 3 5 7 9 JUNE JULY O3 ( ppbV) MEASUREMENTS HOMOGENEOUS CHEM. 45 50 55 60 65 70 75 80 85 30 1 3 5 7 9 11 13 15 17 19 21 23 25 27 29 1 3 5 7 9 JUNE JULY O3 ( ppbV) MEASUREMENTS HETEROGENEOUS CHEM.
Fig. 4. Time series of daily mean ozone concentrations at Mt Cimone. The squares
repre-sent the measured concentrations (ppbV) while the diamonds are the ozone concentrations simulated by the LMDZ-INCA model. Ozone measurements were taken by P. Bonasoni from CNR-ISAC, Bologna.
ACPD
3, 1753–1776, 2003
The Mt Cimone, Italy, campaign: gaseous and aerosol composition Y. Balkanski et al. Title Page Abstract Introduction Conclusions References Tables Figures J I J I Back Close
Full Screen / Esc
Print Version Interactive Discussion
c
EGU 2003
Figure 5. : Simulated mean ozone concentrations along the back trajectories arriving at Mt Cimone respectively, 12, 36, 60, 84 and 108 hours prior to the arrival time at the site. The concentrations are reported for the case when heterogeneous reactions are accounted for in the model.
45,0 50,0 55,0 60,0 65,0 70,0 75,0 0 1 2 3 4 5
Days prior to reaching Mt Cimone
O3, ppbv
E-EUR NW-EUR
W-EUR MED
AFR
Fig. 5. Simulated mean ozone concentrations along the back trajectories arriving at Mt Cimone,