HAL Id: hal-00736646
https://hal.archives-ouvertes.fr/hal-00736646
Submitted on 7 May 2015
HAL is a multi-disciplinary open access
archive for the deposit and dissemination of
sci-entific research documents, whether they are
pub-lished or not. The documents may come from
teaching and research institutions in France or
abroad, or from public or private research centers.
L’archive ouverte pluridisciplinaire HAL, est
destinée au dépôt et à la diffusion de documents
scientifiques de niveau recherche, publiés ou non,
émanant des établissements d’enseignement et de
recherche français ou étrangers, des laboratoires
publics ou privés.
Validation of IASI ozone profiles, using balloon sounding
data
Andy Delcloo, Daniel Hurtmans, Pierre-François Coheur, Cathy Clerbaux
To cite this version:
Andy Delcloo, Daniel Hurtmans, Pierre-François Coheur, Cathy Clerbaux. Validation of IASI ozone
profiles, using balloon sounding data. 2011 EUMETSAT Meteorological Satellite Conference, Sep
2011, Oslo, Norway. �hal-00736646�
VALIDATION OF IASI OZONE PROFILES USING BALLOON
SOUNDING DATA
Andy Delcloo1, Daniel Hurtmans3, P-F Coheur3, C. Clerbaux2,3
1
Royal Meteorological Institute of Belgium, Ringlaan 3, B-1180 Ukkel, Belgium 2
UPMC Univ. Paris 6, CNRS/INSU, LATMOS-IPSL, France, 3
Spectroscopie de l'Atmosphère, Service de Chimie Quantique et Photophysique, Université Libre de Bruxelles, Brussels, Belgium
Abstract
Here we present a validation study of IASI vertical ozone profiles. This has been done using balloon ozone sonde data, which have a vertical resolution of about 100 m and measures ozone from the surface up to an altitude of about 30 km.
IASI vertical ozone profiles are given as partial ozone columns [in DU per layer] between varying pressure levels. To validate the satellite derived ozone layers with the balloon ozone sounding data we integrate the ozone measured by the balloon ozone soundings between the corresponding IASI pressure levels.
We take into account the IASI averaging kernels in our analysis in order to smooth the ozone sonde data towards the resolution of the satellite data.
INTRODUCTION
Global monitoring of ozone is essential as it plays an important role in the chemical processes occurring in the atmosphere and has a major impact on the climate. Tropospheric and stratospheric ozone are highly variable in both space and time and thus in order to correctly quantify its effect on stratospheric chemistry, air quality and radiative forcing it is necessary to develop accurate global measurements.
The IASI instrument launched onboard the METOP-A platform in October 2006 is a nadir looking Fourier transform spectrometer that probes the Earths atmosphere in the thermal infrared spectral range, with a spectral resolution of 0.5 cm-1 (apodized) (Clerbaux et al., 2009). The ozone profiles were generated using the FORLI retrieval code developed at ULB. The retrieval products includes profiles and total columns along with corresponding error covariance and averaging kernel matrices. Some preliminary validation is reported in Scannel et. al, 2011 and Dufour et. al, 2011.
IASI monitors the atmospheric composition at any location two times per day, and measures many of the chemical components which play a key role in the climate system and pollution issues. The METOP satellite platform also carries the GOME 2 UV vis instrument, mainly devoted to ozone monitoring.
Here we present a validation of IASI vertical ozone profiles. The IASI averaging kernels are taken into account in our analysis in order to smooth the ozone sonde data towards the resolution of the satellite data.
DATASET DESCRIPTION
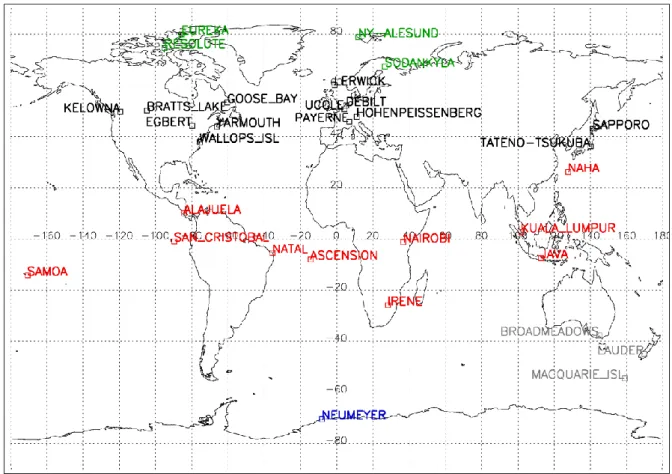
IASI ozone data used in this validation paper is from the beginning of January 2009 up to the end of December 2009. IASI ozone data was made available by ULB/LATMOS at pre-selected sites. These sites correspond to sites where ozone soundings are performed on a regular basis. In order to have a more global view on the performance of the ozone profile product, we used 25 stations, introducing the SHADOZ-network (Thompson et al., 2003a, Thompson et al., 2003b,
http://croc.gsfc.nasa.gov/shadoz/) for the tropical stations. For the other stations, data was made available by the World Ozone and Ultraviolet Data Center (WOUDC). (http://www.woudc.org) and the NILU’s Atmospheric Database for Interactive Retrieval (NADIR) at Norsk Institutt for Luftforskning (NILU) (http://www.nilu.no/nadir/).
Latitude belts from North to South:
1. Polar stations North: green (67N – 90 N)
2. Mid-Latitude stations North: black (30 N – 67 N) 3. Tropical stations: Red (30 N – 30 S)
4. Mid-Latitude stations South: grey (30 S – 70 S) 5. Polar stations South: orange (70 S – 90 S)
METHODOLOGY
Co-location criteria
The selection criteria, taken into account are two fold:
The geographic distance between the IASI pixel center and the sounding station location is taken into account and the criterion is fixed at a distance of 100 KM.
The time difference between the pixel sensing time and the sounding launch time is the second criterion and is fixed at ten hours of time difference. Each sounding that is correlated with a IASI overpass is generally correlated with several IASI pixels if the orbit falls within the 100 km circle around the sounding station. This means that a single ozone profile is compared to more than one IASI measurement.
Ozone sounding pre-processing
IASI ozone profiles are given as partial ozone columns on varying pressure levels (40 levels between surface and 40 km). Ozone partial columns are expressed in Dobson Units.
Ozone sondes measure the ozone concentration along the ascent with a much higher vertical resolution (100 m) than IASI, until 30 km.
The integration requires interpolation, as IASI levels never match exactly ozone sonde layers. This interpolation causes negligible errors given the high vertical resolution of ozone sonde profiles.
The validation of the IASI profiles is calculated by using the averaging kernels (AVK) of the IASI profile. The motivation to apply the AVK is to “smooth” the ozone soundings towards the resolution of the satellite, to look at the IASI profiles with “the eyes” from the satellite. Equation (1) shows how the kernels have been applied.
Xavk_sonde= Xapriori + A (Xraw sonde – Xapriori) + є (1)
Where A represents the averaging kernel, Xavk_sonde is the retrieved ozone sonde profile, Xsonde is the ozone sonde profile and Xapriori is the apriori profile.
VALIDATION RESULTS
A global ozone profile validation study will be performed, considering 37 ozone sonde stations. In Table 1, a selection of three stations is mentioned together with the number of collocations during four years of data for the IASI satellite overpass.
Table 1. Overview of the number of coincidences at different ozone sonde stations
Station Lat. Lon. nr of coincidences
Ukkel 50.8 4.35 3680
Broadmeadows -37.69 144.95 634
Wallops Island 37.84 -75.48 889
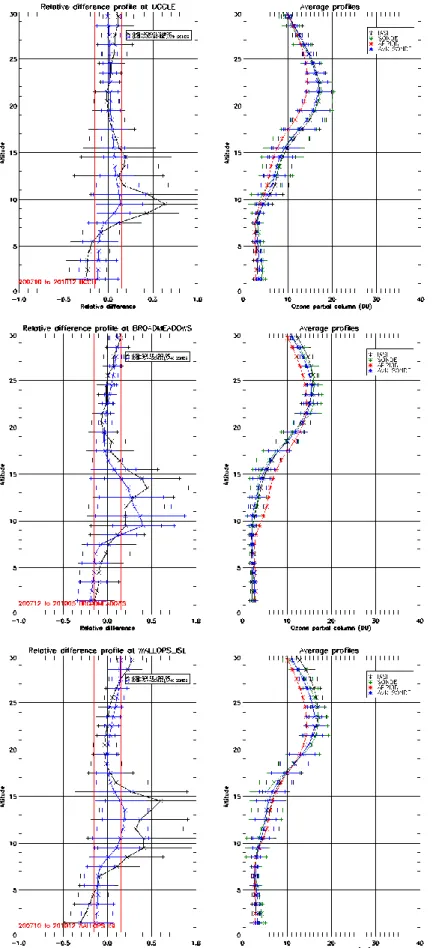
Figure 2 shows the relative difference profiles between IASI and ozone sondes (black) and smoothed ozone sondes (blue) for the stations, mentioned in Table 1 for the time period 01/2007-12/2010 and the averaged ozone profiles.
Figure 2:Relative difference profiles (left) between IASI profiles and ozone sondes (black) and smoothed ozone sondes (blue) and averaged ozone profiles (right) for different stations under consideration for the time period 2007-2010
INFORMATION CONTENT
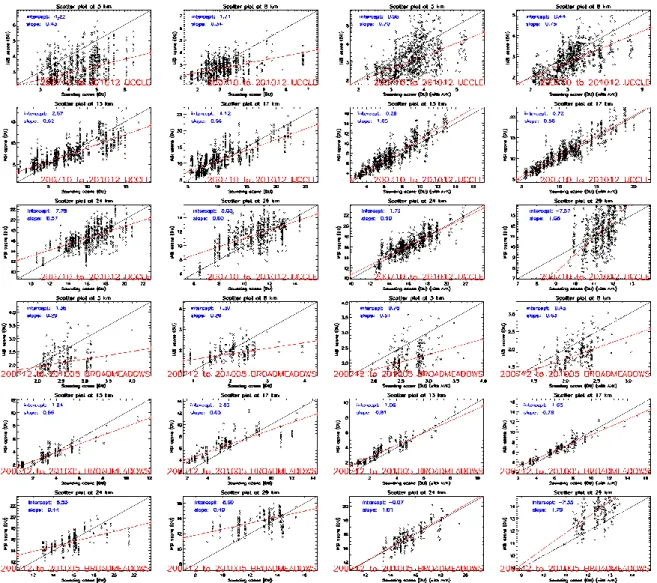
The regression lines in the scatter plots (Fig. 3) show that IASI loses sensitivity in the stratosphere (range 25-30 km) and in the lowest layers of the troposphere. In between, the profile is well retrieved as can be derived from the error bars in Fig. 2. In the UTLS zone, the IASI profiles show a significant overestimation.
Figure 3: Scatter plot at 6 different altitude levels for the stations of Ukkel and Broadmeadows. (left: IASI <-> ozone sonde,right: IASI <-> smoothed ozone sonde)
SEASONAL BEHAVIOUR
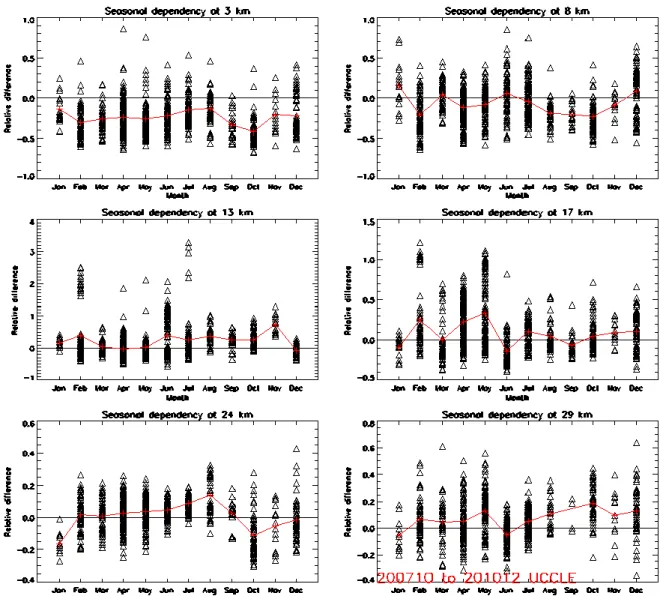
Figure 4 elucidates that in general there is only in the lowest troposphere a tendency to underestimate the ozone concentrations. In absolute values, the difference in the lower troposphere is within 2 DU corresponding to 30 % in relative difference.
Figure 4: Seasonal behavior at 6 different altitude levels for the station of Ukkel.
CONCLUSIONS
In the upper stratosphere (range 25 - 30 km), IASI systematically overestimates the ozone concentrations by 10-20%.
In the UTLS region, ozone concentrations are generally low, show a large natural variability and a strong dependency on the tropopause altitude so that the differences observed between IASI and ozone sondes could be attributed in part to real ozone differences and to the fact that small numbers are compared.
In the troposphere, mean relative difference profiles show that IASI has a tendency to underestimate the ozone concentrations measured by the ozone sondes. Nevertheless, the differences are within 2 DU.
Compared with GOME-2 results (Delcloo and Kins, 2009), it can be concluded that both profile retrievals are complementary; GOME-2 performs better in the lower stratosphere while IASI performs best in the free troposphere. A synergy between both algorithms is therefore advisable.
ACKNOWLEDGEMENT
Part of this work is funded by EUMETSAT through the O3M-SAF Continuous Development and Operation Project (CDOP), and by ProDEx.
The ozone sonde data was made available by WOUDC (http://www.woudc.org), the SHADOZ network (http://croc.gsfc.nasa.gov/shadoz/) and the NILU’s Atmospheric Database for Interactive Retrieval
(NADIR) at Norsk Institutt for Luftforskning (NILU) (http://www.nilu.no/nadir/).
REFERENCES
Boynard A., C. Clerbaux, P.-F. Coheur, D. Hurtmans, S. Turquety, M. George, J. Hadji-Lazaro, C. Keim, and J. Mayer-Arnek, Measurements of total and tropospheric ozone from the IASI instrument: comparison with satellite and ozone sonde observations, Atmos. Chem. Phys., 9, 6255-6271, 2009. Clerbaux C., A. Boynard, L. Clarisse, M. George, J. Hadji-Lazaro, H. Herbin, D. Hurtmans, M. Pommier, A. Razavi, S. Turquety, C. Wespes, and P.-F. Coheur, Monitoring of atmospheric composition using the thermal infrared IASI/MetOp sounder, Atmos. Chem. Phys., 9, 6041-6054, 2009.
G. Dufour, M. Eremenko, A. Griesfeller, B. Barret, E. LeFlochmo¨en,C. Clerbaux, J. Hadji-Lazaro, P.-F. Coheur, and D. Hurtmans, Validation of three different scientific ozone products retrieved from IASI spectra using ozonesondes. Atmos. Meas. Tech. Discuss., 4, 54255479, 2011.
C. Scannell, D. Hurtmans, A. Boynard, J. Hadji-Lazaro, M. George, A. Delcloo, O. Tuinder, P.-F. Coheur, and C. Clerbaux, A review of the ozone hole from 2008 to 2010 as observed by IASI, Atmos. Meas. Tech. Discuss., 4, 47174752, 2011.
Pommier, A. Razavi, S. Turquety, C. Wespes, and P.-F. Coheur, Monitoring of atmospheric composition using the thermal infrared IASI/MetOp sounder, Atmos. Chem. Phys., 9, 6041-6054, 2009.
Thompson, A.M., J.C. Witte, R.D. McPeters, S.J. Oltmans, F.J. Schmidlin, J.A. Logan, M.Fujiwara, V.W.J.H. Kirchhoff, F. Posny, G.J.R. Coetzee, B. Hoegger, S. Kawakami, T. Ogawa, B.J. Johnson, H. Vömel and G. Labow, Southern Hemisphere Additional Ozone sondes (SHADOZ) 1998-2000 Tropical ozone climatology 1. Comparison with Total Ozone Mapping Spectrometer (TOMS) and ground-based measurements, J. Geophys. Res., Vol. 108 No. D2, 8238, doi: 10.1029/2001JD000967, 30 January 2003.
Thompson, A.M., J.C. Witte, S.J. Oltmans, F.J. Schmidlin, J.A. Logan, M. Fujiwara, V.W.J.H. Kirchhoff, F. Posny, G.J.R. Coetzee, B. Hoegger, S. Kawakami, T. Ogawa, J.P.F. Fortuin, and H.M. Kelder, Southern Hemisphere Additional Ozone sondes (SHADOZ) 1998-2000 Tropical ozone climatology 2. Tropospheric variability and the zonal wave-one, J. Geophys. Res., Vol. 108 No. D2,8241, doi: 10.1029/2002JD002241, 31 January 2003.