Publisher’s version / Version de l'éditeur:
Vous avez des questions? Nous pouvons vous aider. Pour communiquer directement avec un auteur, consultez la
première page de la revue dans laquelle son article a été publié afin de trouver ses coordonnées. Si vous n’arrivez pas à les repérer, communiquez avec nous à PublicationsArchive-ArchivesPublications@nrc-cnrc.gc.ca.
Questions? Contact the NRC Publications Archive team at
PublicationsArchive-ArchivesPublications@nrc-cnrc.gc.ca. If you wish to email the authors directly, please see the first page of the publication for their contact information.
https://publications-cnrc.canada.ca/fra/droits
L’accès à ce site Web et l’utilisation de son contenu sont assujettis aux conditions présentées dans le site LISEZ CES CONDITIONS ATTENTIVEMENT AVANT D’UTILISER CE SITE WEB.
Research Paper (National Research Council of Canada. Division of Building
Research), 1973
READ THESE TERMS AND CONDITIONS CAREFULLY BEFORE USING THIS WEBSITE.
https://nrc-publications.canada.ca/eng/copyright
NRC Publications Archive Record / Notice des Archives des publications du CNRC :
https://nrc-publications.canada.ca/eng/view/object/?id=ab14843f-f10c-46d0-a0f2-5d8d87af3b3e
https://publications-cnrc.canada.ca/fra/voir/objet/?id=ab14843f-f10c-46d0-a0f2-5d8d87af3b3e
NRC Publications Archive
Archives des publications du CNRC
This publication could be one of several versions: author’s original, accepted manuscript or the publisher’s version. / La version de cette publication peut être l’une des suivantes : la version prépublication de l’auteur, la version acceptée du manuscrit ou la version de l’éditeur.
For the publisher’s version, please access the DOI link below./ Pour consulter la version de l’éditeur, utilisez le lien DOI ci-dessous.
https://doi.org/10.4224/40000460
Access and use of this website and the material on it are subject to the Terms and Conditions set forth at
Air leakage measurements of the exterior walls of tall buildings
Shaw, C. Y.; Sander, D. M.; Tamura, G. T.
Ser
TH1
N21r2
no.
601
c.
2
BLDG
NATIONAL RESEARCH COUNCIL OF CANADA
CONSEIL NATIONAL DE RECHERCHES D U CANADA
+f
T ~ ~ , D
ppa
bJ-
Alr Leakage Measurements of the Exterlor
Walls of Tall Bulldlngs
by
C.Y. Shaw, D.M. Sander and G.T. Tamura
Reprinted from ASH RAE Transactions
Vol. 79, Part 2, 1973 p. 40-48
By permission of the American Society of Heating, Refrigerating and Air-conditioning Engineers, Inc.
Research Paper No. 601 of the
Division of Building Research
EVALUATION DES FUITES D'AIR DANS LES MURS EXTERIEURS D'EDI FICES ELEVES
Le present expos6 decrit une methode expkrimentale, concue dans le but de determiner les caracteristiques de fuite d'air des
murs exterieurs d'un edifice. Cette mkthode consiste a mettre
I'kdifice sous pression au moyen du systime d'alimentation en air
et i mesurer les debits de I'air provenant de I'exterieur e t les
differentielles de pression qui en resultent l e long des murs.
L'Btude des resultats obtenus permet d'ktablir un coefficient e t
un exposant de 1'6coulement d'air pour les murs extkrieurs.
L'application de cette mkthode aux debits d'air e t aux dif-
fkrentilles de pression obtenus d'un modile informatique simu-
lant un edifice permet de verifier le procede e t de constater que
No. 2280
C.Y. SHAW
Associate Member ASHRAE
D.M. SANDER
Associate Member ASHRAE
G.T. TAMURA
Member ASHRAE
AIR LEAKAGE MEASUREMENTS OF THE
EXTERIOR WALLS OF TALL BUILDINGS
A K leakage i n t o and o u t of a building occurs mainly through cracks formed a t t h e mating surfaces of t h e various exterior wall components. It contributes t o the heating, cooling, a n d moisture loads of a building a n d is therefore of interest t o t h e designer for calculating t h e energy require- m e n t s o f air conditioning systems. Also, air movement inside a building resulting from air leakage through t h e exterior walls n o t only spreads o d o r s b u t , in t h e event o f fire, contributes t o the spread of smoke a n d toxic gases.1 T h e design of buildings and air handling systems t o prevent undesirable air movement requires knowledge of t h e air leakage characteristics of exterior walls as well as those of various interior separations.
T h e conventional m e t h o d s of estimating t h e rate of air
infiltration are described in Chapter 25 of t h e ASHRAE
Handbook of F ~ n d a m e n t a l s . ~ T h e y are t h e air change and t h e crack methods, b o t h of which depend t o a great e x t e n t o n t h e judgment and t h e experience of t h e designer. Air leakage d a t a for windows, doors, a n d simple frame and
brick walls are given in Ref. 2; these d a t a are based o n
laboratory studies. T h e r e is n o information o n t h e air leakage characteristics of contemporary wall constructions such as curtain walls and spandrel panels with fixed glazing. It is difficult, therefore, for a designer t o make a reliable estimate o f t h e infiltration heat loss and gain, which con-
tinue t o be t h e ~ , i o s t uncertain component of t h e calculated
total heating and cooling loads.
C.Y. Shaw is Asst Research Officer, and D.M. Sander and G.T. Tamura are Research Officers, all with National Research Council, O t t a w , Canah. This paper was prepared for presentation at the ASHRAE Spring Conference, Minneapolis MN, May 3-5, 1973.
Air tightness of exterior walls depends n o t only o n the wall design a n d materials used, but also o n t h e workman- ship and condition of various joints after weathering, b o t h of which are difficult t o duplicate in t h e laboratory. Only a relatively small section of a n exterior wall can b e tested in t h e laboratory, consequently a more realistic indication of the air tightness values of exterior walls would be obtained from tests performed o n whole buildings. A test method was developed, therefore, t o measure t h e air leakage charac- teristics of the exterior walls of existing buildings; f o u r tall buildings in the Ottawa area were selected f o r this study. This paper describes t h e test m e t h o d used a n d presents t h e results of air tightness measurements obtained for these buildings.
APPROACH
T h e air leakage characteristics of a building enclosure as a whole can be obtained by pressurizing the building with the supply air system and recording t h e supply air flow rate and t h e resultant pressure differentials across the enclosure. T o obtain t h e air leakage characteristics of t h e typical wall area, however, it is necessary t o isolate it f r o m t h e non- typical wall areas such as those of t h e mechanical, ground and basement floors. This could be accomplished by sealing all leakage openings o t h e r than the exterior walls b u t , because of t h e number, size, a n d location of openings involved, this m e t h o d of isolation is impractical for most buildings. An alternative method was developed, therefore, t o determine t h e air leakage characteristics of a typical wall area.
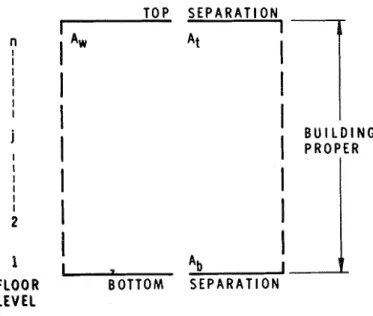
Consider t h e idealized building enclosure shown in Fig. 1. T h e enclosure consists of three parts: t h e part enclosed
T O P S E P A R A T I O N
I
l A W
AtI
1
B U I L D I N G'
1
P R O P E R -I
1
1
.
AbFLOOR
B O T T O M S E P A R A T I O NFig. I Mathematical model
by the typical wall area of floors 1 t o n; the top separation; and, the bottom separation. If outside air is introduced into the building proper, pressures inside are increased and hence, air flows o u t through the exterior walls and the bottom and top separations.
Under steady state conditions the total outside supply rate equals the .air leakage rate through exterior walls plus air leakage rate through bottom separation plus air leakage rate through top separation.
where
Q = the total fresh air supply rate X = flow exponent
A = flow coefficient
AP = pressure difference
p = a i r density
n = the total number of floors with typical wall con- struction
and subscript
w = exterior wall b = bottom separation t = top separation
The values.of Q, AP,, APb and AP, can be measured. By obtaining several sets of these measured values it is possible t o evaluate the coefficients A,, Ab and At and the exponents X,, Xb and Xt in Eq ( 1 ).
APPLICATION
So far only a simple model of a building has been consid- ered. The building proper, i.e., the part enclosed by the typical wall area, is usually connected t o the ground, base- ment, and top mechanical floors by a number of vertical
shafls, e.g., elevator, stair and service shafts, and air ducts. Because of these interconnections, the pressure differentials across the t o p and bottom separations must be defined carefully.
A typical building of about twenty-five stories is often
served by an air conditioning system located on the t o p mechanical floor. The return and exhaust ducts are usually connected directly t o the outside at the top. Elevator and service shafts may also have leakage openings connected directly t o the outside at the top. Air can flow, therefore, from the building proper directly t o the outside at the top through these shafts as well as into the mechanical floor and from there t o outside. The pressure differential across the top separation has been defined as the difference in pressure between the top t.ypica1 floor (the floor below the top mechanical floor) and the outside at mid-height of the top mechanical floor.
The basement and ground floor areas are usually served by an air conditioning system located in the basement, in which case no air ducts would connect the building proper t o these areas. The only inter-connections would be the stair wells, and the elevator and service shafts that termi- nate either at the ground or basement floors. There is no direct connection from the building proper t o the outside at the bottom. Therefore, the pressure differential across the bottom separation is defined as the difference in pres- sure between the first typical floor (the floor above the ground floor) and the average of the ground floor and basement pressures.
CALCULATION TECHNIQUE
Eq ( 1 ) is a nonlinear equation in six unknowns. These six unknowns can be estimated by a trial and error technique used in conjunction with the method of least squares. The calculation procedure is as follows:
1 Choose combinations of flow exponents with val- ues between 0.5 and 1 (as this is the range of accepted value^.)^,^
2 Use the method of least squares t o obtain the flow coefficients and calculate the standard error of estimate for each combination of the flow ex- ponents.
3 Select the values of the flow exponents and asso- ciated flow coefficients that give the lowest value of the standard error of estimate. These values are taken as the solution t o Eq (1).
The rate of air leakage through the exterior wall for a given pressure differential can then be estimated by the following equations:
- -
D
= the total exterior wall area per story in sq ftp = the air density in lb/cu ft
AP, = the pressure difference across the wall in in. of
water
where, O U T S l DE
Q,
= the total wall air leakage rate in cfm A I R S U P P L YEq (1) shows that the division of the total air leakage rate into three components depends upon the values of pressure differentials across each separation. If those values are the same, the rate of air leakage through the exterior wall cannot be separated from the air leakage through the top and bottom. One way t o ensure that they will be different is t o conduct the tests when the outside tempera- ture is lower than the inside temperature, thus producing stack action which will result in pressure differentials across the walls that will vary from the bottom t o the top of the building. They can then be superimposed on those caused by the outside air supply into the building. Also, t o ensure that stable pressure readings are obtained, measurements should be made during calm wind conditions.
q, = the wall air leakage rate per unit area in cfm/sq E X H A U S T
ft R E T U R N A I R
VALIDATION OF THE METHOD
An ideal method of testing the accuracy of the proposed method would be t o apply it t o a building that has a known air leakage characteristic; this is not possible because air leakage characteristics are not known. A building with specified air leakage characteristics can, however, be simu-
lated by using a digital c o m p ~ t e r . ~ Simulated test data can
thus be obtained and the proposed method applied and verified.
ELEt!ATOR
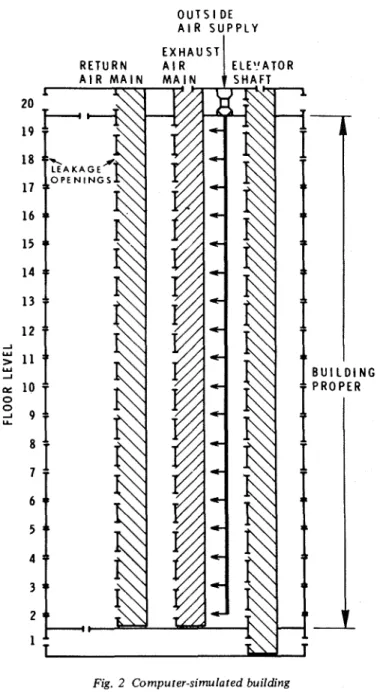
The model selected for test is that of a twenty-story building, shown in Fig. 2, which includes a basement and a top mechanical floor. It contains three vertical shafts repre- senting the return and exhaust air mains of the air handling system and an elevator shaft. Specific values of air leakage characteristics were used for the model and, with the aid of a digital computer, pressure differential and air leakage rate across each separation were computed.
Fig. 2 Computer-simulated building
Three conditions were considered:
Case1
The flow exponents for the exterior walls, floor and shafts were 0.5. Computations were carried o u t with fresh air supply rates of 0 t o 70,000 cfm in 10,000 cfm increments with an outside temp of 25F and an inside temp of 75F.
Case I I
Same conditions as Case I except that all leakage open- ings in the top separations were sealed off.
Case
I l l
Again, same conditions as Case I except that the flow exponent for the exterior walls was 0.66.
The proposed method permits selection of the com- bination of flow exponents and their associated flow co- efficients that give the best estimate of the overall leakage characteristics of the building enclosure as a whole. The minimum standard errors of estimates were found t o be 146, 696 and 164 cfm for Cases I, I1 and 111, respectively, indicating that the selected combination of flow exponents gave a close estimate of the specified overall leakage charac- teristics.
Flow exponents and coefficients of the exterior walls obtained from the proposed method were found t o give a
20
- 2 0 - 1 0 0 10 20 30 4 0 50 60 70
% S P E C I F I E D x 1 0 - 3 * c F M
Fig. 3a Calculated exterior wall air leakage rate vs specified exte- rior wall air leakage rate
I - 1100 100 900
5
800 U w C2
700-
C vl w Y 0 600 a 0 e e Y 500 e < a 2 400 vl 300 200 Inn I I I I 1 I 0-
x w W A L L X wFig. 3b Standard error o f estimate vs flow exponent for wall
-
-//
/O --
/"
-/"
-yg
-p"
a 0-
-
CASE I CASE II-
0-
CASE Ill - Ti-
75 F To-
25°F A< - I I I I I IFig. 3c Calculated exterior wall air leakage rate vs specified exte- rior wall air leakage rate for various standard errors o f estimate
good estimate of t h e air leakage characteristics of t h e ex- terior walls. The calculated wall air leakage rates were plotted against t h e specified wall air leakage rates as shown in Fig. 3a. T h e results show t h a t t h e calculated wall air
leakage rates lie within f 10% of t h e specified wall air
leakage rates.
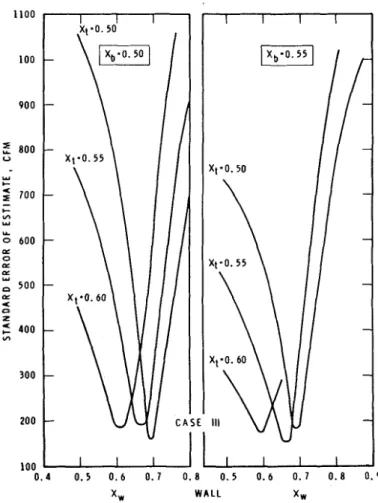
Because t h e standard error of estimate is related t o t h e overall air leakage rates, t h e minimum standard error of estimate may not necessarily give t h e best indication of t h e wall air leakage rate. T o investigate this, wall e x p o n e n t s were plotted against t h e standard error of estimate for different combinations of e x p o n e n t s f o r t h e b o t t o m a n d t o p separations. A graph for Case 111 is shown in Fig. 3 b , with flow e x p o n e n t s in t h e t o p separation of 0.5, 0.55 a n d 0.60 a n d in t h e b o t t o m separation of 0.5 a n d 0.55. T h e graph indicates that, with fixed values of flow e x p o n e n t s for t h e b o t t o m a n d t o p separations, t h e standard error of estimates for different combinations of flow e x p o n e n t s shown in Fig. 3a varies f r o m 164 t o 21 5 c f m , with variation in t h e exterior wall flow e x p o n e n t of from 0.6 t o 0.7. T h e minimum standard error o f estimate is obtained with flow e x p o n e n t o f 0.50 for t h e b o t t o m separation, 0.50 for t h e t o p separation a n d 0 . 7 0 for t h e exterior wall. T h e assigned
DESCRIPTIONS OF TEST BUILDINOS B u i l d i n g A B u i l d i n g B B u i l d i n g C B u i l d i n g D H e i g h t 1 5 1 220 247 2 5 3 No. o f f l o o r s above g r o u n d ( e x c l u d i n g l o b b y and mech. f l o o r ) 9 1 3 20 20 F l o o r d i m e n s i o n s ( f t ) 166 x 210 88 x 140 1 2 6 x 146 75 x 9 3 T y p i c a l F l o o r h e i g h t ( f t ) 1 3 11 1 0 . 6 1 0 . 5 Volume above g r o u n d ( c u f t ) 5 , 0 9 5 , 0 0 0 2 , 4 5 9 , 0 0 0 4 , 5 0 9 , 0 0 0 1,704.000 O u t s i d e w a l l a r e a e r t y p i c a l f l o o r ( f t 4 ) 9 , 7 7 6 5 , 0 1 6 5 , 7 5 7 3.920 T y p i c a l window s i z e ( f t ) 8 . 5 x 7 . 9 3.8 x 6.9 2.6 x 6 . 5 4 . 7 K 4 . 5 No. o f windows p e r t y p i c a l f l o o r 5 6 6 4 104 4 4 Roof a r e a / n e t o u t s i d e w a l l a r e a . 6 1 . 2 5 . 2 3 .12 T o t a l o u t s l d e w a l l a r e a above g r o u n d l e v e l ( i n c l u d i n g a r e a o f t h e e x t e r i o r w a l l s o f t h e t o p mech. f l o o r ) 112.700 M a l l c o n s t r u c t i o n F i x e d d o u b l e O p e n a b l e d o u b l e F i x e d d o u b l e P i x e d d o u b l e g l a z l n g i n g l a z l n e i n g l a z i n g g l a z i n g aluminum aluminum ( n o r m a l l v 5-in. PEAC p a n e l P r e c a s t c o n c r e t e P r e c a s t c o n c r e t e ( 1 ) W a l l 8 - i n . T i l e p a n e l b a c k e d p a n e l 2 - i n . Hollow s t e e l 2 - i n . R i g i d w i t h 2 - i n . r i g i d A i r s p a c e p a n e l i n s u l a t i o n i n s u l a t i o n 1 - i n . R i g i d A i r s p a c e w i t h v a p o u r l n e u l a t i o n R i g i d i n e u l a t i o n b a r r i e r 1 / 2 - i n . Cement 2 0 - i n . C o n c r e t e . -. - - - . A i r s p a c e 6 - i n . T i l e 3/4-in. P l a a t e r r e n d e r i n g 6 - i n . Block w a l l ( 2 ) C o r n e r s 3 / 4 - i n . P l a s t e r 4 - i n . P a c e b r i c k 2 - i n . R i g i d i n s u l a t i o n 1 2 - i n . Poured c o n c r e t e
The exterior wall air leakage rates calculated with flow 1 All auxiliary air handling systems were shut down.
exponents and their associated flow coefficients corre- 2 All fans of t h e return and exhaust systems were
sponding t o t h e minimum standard error of estimates given shut down.
in Fig. 3 b are plotted against t h e specified air leakage rates 3 T o obtain uniform pressurization in t h e building
in Fig. 3c. T h e graph shows t h a t the flow exponent a n d proper, stair doors were kept o p e n except for
associated flow coefficient corresponding t o t h e minimum those o n the basement, ground and mechanical
standard error of estimate of 1 6 4 cfm does n o t give t h e best floors.
estimate of t h e specified wall leakage rates. The best esti-
-
mate is obtained with standard error of estimate of 215 cfm. Although t h e flow exponents corresponding t o t h e minimum standard error of estimate d o not necessarily give the best estimate o f t h e wall air leakage rates, a s shown in Fig. 3a and 3c, they d o give an adequate estimate. Also, where t h e wall leakage characteristics are n o t known, a s in t h e case of real buildings, the use of minimum standard error of estimate serves a s a criterion for t h e selection of t h e flow exponents and coefficients.
FIELD MEASUREMENTS
Air leakage characteristics of t h e exterior walls of four tall
buildings designated as Buildings A, B, C and D (Figs. 4 , 5,
6 and 7) were determined using t h e proposed method.
These buildings all have a full basement below grade and a
mechanical floor a t the top. Descriptions of the building are
given in Table I. Pressure differentials across t h e exterior
walls and b o t t o m and t o p separations were measured for
various rates of fresh air supplied under t h e following - .
Fig. 5 Building B Fig. 6 Building C
4 Main entrance doors a n d elevator a n d stair d o o r s
a t t h e basement, ground floors, and t h e t o p me- chanical floors were kept closed during t h e test.
5
T o minimize the effect of wind pressures o n t h ebuildings all tests were conducted during relatively calm conditions.
6 All tests were conducted when t h e outside temper-
a t u r e was a t least 2 0 F below t h e inside temp.
7 All tests were conducted during unoccupied
periods.
INSTRUMENTATION
Fresh air supply rates were measured using total pressure averaging tubes5 a n d their associated static pressure taps installed in t h e main supply air d u c t s a t positions a s far away from t h e duct bends a s practicable. Based o n labora- t o r y tests,5 t h e accuracy of this flow rate measuring device
was found t o be better t h a n
+6.5%
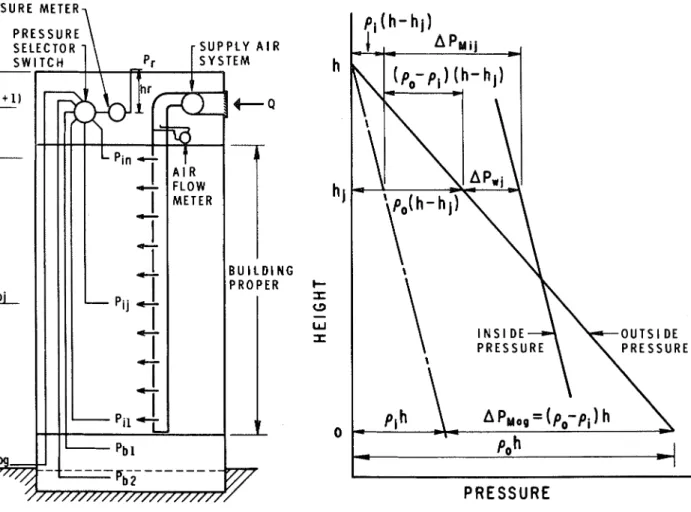
of t h e actual flow ratefor air velocities of from 6 0 0 t o 1 4 0 0 fpm. Pressure differ- entials were measured with a pressure recording instrument located o n t h e t o p mechanical floor. O n e side of t h e m e t e r was connected t o t h e roof t o p pressure t a p which sewed a s a reference pressure; t h e o t h e r side of t h e meter was con- nected t o a pressure selector switch. F r o m t h e pressure selector switch, 311 6 in. plastic t u b e s were installed vertical- ly in a stair shaft terminating a t various floor spaces a n d also t o t h e outside a t ground level. T h e sensitivity o f t h e
pressure transducer is 0.002 in. of water. T h e schematic diagram of t h e installation is shown in Fig. 8a.
Pressure differences across t h e various separations can be calculated f r o m t h e pressure meter readings as follows:
(a) Pressure difference across t h e exterior wall a t t h e jth
level (Fig. 8 b ) Ap . = p.. - p .
WI 9 01
= APMij - (h - h j ) w o -pi)
= ApMij - [h - Pi) - hj (Po -Pi)]
= APMij - [ m ~ o g - hj (Po - Pi)]
= APMij - APMog (h - hj) /h
where
Pi, PO = inside and outside gauge pressures
APMb APMo = meter readings associated with Pi and Po respectively.
APMO, = meter reading associated with outside
pressure a t t h e ground level.
h and h j = vertical distances a s shown in Figs. 8 a , 8b.
(c) Pressure difference across t h e t o p separation.
Apt = Pin - Po (n+ 1 ) = A p ~ i n - m ~ o n + (Po + Pi) H v h e r e
H = t h e distance between t h e centers of t h e nth
and the mechanical floors ( n + l t h ) floor. Subscripts
1, n = first and t o p typical floors,
bl and b 2 = the ground floor and basement,
M = meter reading.
SESULTS AND DISCUSIONS
T h e flow coefficients and flow exponents t h a t describe t h e sir leakage characteristics of t h e various separations were obtained f o r t h e f o u r buildings and are given in Table 11. Also given in this Table are values of t h e standard error of estimate t h a t indicate that t h e measured and estimated overall air leakage rates are in good agreement. This does not imply t h a t t h e same degree of accuracy in the estimates of t h e exterior wall air leakage rates was obtained. It has been shown, however, t h a t t h e proposed method estimates t h e wall air leakage rate t o within + l o % for t h e computer- simulated building. It would be expected, therefore, t h a t if t h e standard error of estimate is small, reasonable accuracy of t h e estimate of wall leakage characteristics would be obtained.
T h e total air leakage rates f o r t h e test buildings are
given in Fig. 9. T h e total air leakage rates are expressed in Fig. 7 Building D
TABLE I1
FLOW COEFFICIENTS AND EXPONENTS
Test Buildings A B C D Building proper XW Bottom aeparation Ab xb Top separation A Xt Total outside wall area
from ground to the roof levels (aq ft) (Dl)
Exterior wall area per typical floor (sq ft) (n)
Standard error o f estimate (crm)
8900 for 130000 0<0<100010
Over-all a i r leakage rate (cfm/sq f t )
Governing Equations
Wall a i r leakage rate , - ~ A , I ~ A P I ~
(cfm/sq f t ) 3920 1130 for 47500 O<O<47WU
Standard error of estimate E
-
{
x
(a -d -a C . I N L . I ~ P I I P I O of -PI.. -3 IPRESSURE METER,
Fig. 8a Arrangemen t o f test equipmen t
cfm/sq f t o f outside wall area above ground level and include t h e area o f t h e exterior walls of t h e t o p mechanical floor. T h e air leakage rates for t h e test buildings ranged from 0.5 t o 1.1 cfm/sq f t of outside wall area a t pressure difference of 0.3 in. of water.
Fig. 9 shows t h a t t h e overall air leakage rate of Build- ing A is considerably higher than t h a t of t h e o t h e r build- ings. This building differs from t h e other buildings in t h a t it has t w o conveyor shafts with large openings t o each floor which serve as an additional interconnection between t h e building proper and t h e basement as well as t h e mechanical floor. Also, there is a large tunnel t o a nearby building from t h e basement. It is t o be expected t h a t these interconnec- tions contributed t o the high value of overall leakage rate f o r this building.
T h e measurements o f overall leakage characteristics f o r three tall bhildings including Building B were reported in
1 9 6 7 by Tamura and W i l ~ o n . ~ T h e overall air leakage rates
of these buildings varied f r o m 0.5 t o 0 . 8 cfmlsq f t of outside wall area a t 0.3 in. o f water and are within t h e range of those given in Fig. 9. This figure also shows t h e overall air leakage characteristics of Building B obtained prior t o 1967. During t h e t i m e between t h e t w o tests, a n a t t e m p t was made t o improve t h e exterior wall tightness of Building B by sealing t h e cracks a n d openings i n t h e cor- ners, behind t h e induction units a n d o t h e r locations. This
P R E S S U R E
Fig. 8b Pressure difference across an exterior wall partly explains t h e lower value of air leakage rate for t h e recent test
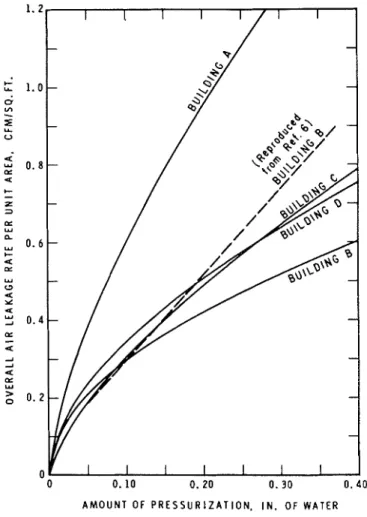
T h e air leakage characteristics of t h e exterior wall of t h e f o u r test buildings are given in Fig. 1 0 in terms of cfmlsq ft of t h e total typical wall area. The exterior wall air leakage rates of these buildings varied from 0.25 t o 0.48 cfmlsq f t a t a pressure difference of 0 . 3 in. of water. The exterior wall air leakage rates of t h e four buildings were f o u n d t o be from 3 0 t o 55% of t h e overall air leakage rates. T h e air leakage characteristics of a 13 in. unplastered brick
wall given in Ref. 2 is also plotted in Fig. 10. It appears that
t h e exterior walls of t h e test buildings have about t h e same permeability t o air as an unplastered brick wall.
It is difficult t o identify all t h e leakage openings in t h e exterior wall of a building f r o m either inspection of t h e wall construction o r t h e architectural drawings. Also, air tightness of a wall section depends o n t h e quality of work- manship as much as o n t h e wall design and is therefore difficult t o predict. T h e test results presented in this paper give some indication of t h e wall air leakage characteristics t h a t can be expected for modern high-rise buildings.
SUMMARY
A test m e t h o d was developed t o determine t h e air leakage characteristics of t h e exterior walls of a building. T h e
A M O U N T O F P R E S S U R I Z A T I O N . I N . O F WATER Fig. 9 Overall air leakage rate per unit area vs building pressrw-
ization
validity of t h e m e t h o d was checked using a computer-simu- lated building with specified air leakage characteristics. Good agreement was obtained between t h e calculated a n d specified wall air leakage rates. Using this m e t h o d t h e exterior wall air leakage characteristics o f t h e f o u r test buildings were obtained. T h e test results indicate t h a t t h e exterior walls of these buildings allow relatively high air leakage, their air leakage characteristics being similar t o those obtained from laboratory tests of a 1 3 in. unplastered brick wall.
ACKNOWLEDGEMENTS
T h e a u t h o r s are indebted t o t h e Department of Public Works and Carleton University for cooperation in making this study possible; also t o t h e operating personnel of t h e f o u r test buildings for their assistance during t h e tests. T h e a u t h o r s also wish t o acknowledge t h e assistance of R.G. Evans in t h e field t e s t s a n d in t h e processing of t h e test data.
0 0 . 1 0 0. 20 0. 30 0 . 4 0
A M O U N T O F P R E S S U R I Z A T I O N . I N . O F WATER Fig. 10 Exterior wall air leakage rate per unit area vs building
pressurization
This paper is a contribution from t h e Division of Build- ing Research, National Research Council of Canada, a n d is published with t h e approval of t h e Director of t h e Division.
REFERENCES
1. Tamura, G.T., Computer Analysis of Smoke Movement in Tall Buildings, ASHRAE TRANSACTIONS, Vol. 75, 1969. 2. ASHRAE Handbook of Fundamentals, Chapter 25,1967. 3. Sasaki, J.R., and A.G. Wilson, Air Leakage Values for Residen-
tial Windows, ASHRAE TRANSACTIONS, Vol. 7 1 , I I , 1965. 4. Tamura, G.T., and A.G. Wilson, Building Pressures Caused by Chimney Action and Mechanical Ventilation, ASHRAE TRANSACTIONS, Vol. 73,II, 1967.
5. Ma, W.Y.L., The Averaging Pressure Tubes Flowmeter for the Measurement of the Rate of Airflow in Ventilating Ducts and for the Balancing of Airflow Circuits in Ventilating Systems, of Inst of Heating and Ventilating Engrs, Feb. 1967.
6. Tamura, G.T. and A.G. Wilson, Pressure Differences Caused by Chimney Effect in Three High Buildings, ASHRAE T R A N S ACTIONS, Vol. 73,II, 1967.
This publication is being distributed by the Division of Building Research of the National Research Coun- cil of Canada. I t should not be reproduced in whole or in part without permission of the original pub- lisher. The Division would be glad to be of assistance in obtaining such permission.
Publications of the Division may be obtained by mailing the appropriate remittance (a Bank, Express, or Post Office Money Order, or a cheque, made payable t o the Receiver General of Canada, credit NRC) t o the National Research Council of Canada, Ottawa. K I A OR6. Stamps are not acceptable. A list of all publications of the Division i s available and may be obtained from the Publications Section, Division of Building Research, National Research Council of Canada, Ottawa. K I A 0R6.