Competition and Price Dispersion in the U.S. Airline Industry
The MIT Faculty has made this article openly available.
Please share
how this access benefits you. Your story matters.
Citation
Borenstein, Severin, and Rose, Nancy L. “Competition and Price
Dispersion in the U.S. Airline Industry.” Journal of Political Economy
102, 4 (August 1994): 653–683 © 1994 University of Chicago
As Published
https://doi.org/10.1086/261950
Publisher
University of Chicago Press
Version
Final published version
Citable link
http://hdl.handle.net/1721.1/113198
Terms of Use
Article is made available in accordance with the publisher's
policy and may be subject to US copyright law. Please refer to the
publisher's site for terms of use.
Competition and Price Dispersion in the U.S. Airline Industry
STOR
Severin Borenstein; Nancy
L.Rose
The Journal of Political Economy, Vol. 102, No.4 (Aug., 1994),653-683.
Stable URL:http://links.jstor.org/sici?sici=0022-3808%28199408%29102%3A4%3C653%3ACAPDIT%3E2.0.CO%3B2-C
Your use of the JSTOR archive indicates your acceptance of JSTOR' s Terms and Conditions of Use, available at http://www.jstor.org/aboutiterms.html. JSTOR's Terms and Conditions of Use provides, in part, that unless you have obtained prior permission, you may not download an entire issue of a journal or multiple copies of articles, and you may use content in the JSTOR archive only for your personal, non-commercial use.
Each copy of any part of a JSTOR transmission must contain the same copyright notice that appears on the screen or printed page of such transmission.
The Journal of Political Economy is published by The University of Chicago Press. Please contact the publisher for further permissions regarding the use of this work. Publisher contact information may be obtained at
http://www .j stor .org/journals/ucpress .html.
The Journal of Political Economy ©1994 The University of Chicago Press
JSTOR and the JSTOR logo are trademarks of JSTOR, and are Registered in the U.S. Patent and Trademark Office. For more information on JSTOR contactjstor-info@umich.edu.
©2003 JSTOR
http://www .j stor.org/ Thu Sep 2507:51:402003
Competition and Price Dispersion in the
U.S. Airline Industry
Severin Borenstein
University of California, Davis and National Bureau of Economic Research
Nancy
L.
Rose
Massachusetts Institute of Technology and National Bureau of Economic Research
We study dispersion in the prices an airline charges to different passengers on the same route. This variation in fares is substantial: the expected absolute difference in fares between two passengers on a route is 36 percent of the airline's average ticket price. The pattern of observed price dispersion cannot easily be explained by cost differences alone. Dispersion increases on routes with more competition or lower flight density, consistent with discrimination based on customers' willingness to switch to alternative airlines or flights. We argue that the data support models of price discrimina-tion in monopolistically competitive markets.
I. Introduction
Dear Harvard Traveler:
We are pleased to offer this special fare to Harvard travelers. This fare is offered on a confidential basis.
This paper grew out of discussions of airline pricing behavior with Peter Reiss. It
has been improved by the comments and suggestions of numerous colleagues and seminar participants, including but not limited to Rob Feenstra, Jerry Hausman, Paul Joskow, Michael Katz, Jeffrey MacKie-Mason, James Poterba, Eric Rasmussen, Mark Roberts, Julio Rotemberg, Andrei Shleifer, Pablo Spiller, George Stigler, and Lawrence Summers. Marilyn Hoppe and Peter Otradovec of America West Airlines provided important doses of reality. We thank Linda Bui for data assistance and Lindsey Klecan, An-Jen Tai, and especially Janet Netz for excellent research assistance. Financial sup-port from the National Science Foundation (grants SES-871156, SES-8721457, and SES-9024147) and the Alfred P. Sloan Foundation is gratefully acknowledged. This work was completed while Rose was a fellow at the Center for Advanced Study in the Behavioral Sciences.
[journal of Political Economy, 1994, vol. 102, no. 4]
Any disclosure of this fare to your fellow travelers could jeopardize the continuation of this program. Your
coop-eration is appreciated. Valid on [major airline] only. [Note from travel agent printed on airline itinerary]
Explaining price differences among related products and among buy-ers of the same product is a popular pastime for economists. Is a restaurant's markup higher on wine than on food because wine pur-chase signals a low demand elasticity for the whole meal or because it indicates a customer who is more costly to serve? Are grocery prices higher in poor neighborhoods than in wealthy ones because the cost of doing business is higher in poor areas or because buyers there are less mobile and less able to switch stores? Until recently, explanations that implied price discrimination often were discounted in markets with easy entry and firms that earned normal returns in the long run (see, e.g., Lott and Roberts 1991). That response, however, has be-come less compelling with the presentation of numerous theoretical models in which price discrimination persists in markets with multiple firms, even where firms earn zero economic profits.l
This paper analyzes price dispersion in the U.s. airline industry with two objectives. First, we wish to quantify the extent of fare in-equality in the airline industry and to describe patterns of price dis-persion across markets.2 Second, we attempt to distinguish price
dis-persion due to discriminatory pricing from disdis-persion that results from variations in costs.3 To meet this objective, we examine the
de-gree to which dispersion is affected by population, product, and mar-ket characteristics that should influence the amount of variation due to price discrimination, while attempting to control for the dispersion due to costs. We are especially interested in measuring the effects of market structure and the firm's relative market position on observed price variation.
We find considerable dispersion in airline prices. The expected difference in prices paid by two passengers selected at random on a
1 See Katz (1984), Borenstein (1985), and Holmes (1989). For thorough treatments
of price discrimination in monopoly and competitive markets, see Tirole (1988) and Varian (1989). Recent empirical studies of price discrimination have begun to account for the effects of competition on the type and degree of discrimination (see Borenstein
1991b; Shepard 1991).
2 Throughout this study, we use the term "price dispersion" to refer to the variation
in prices charged to different passengers on the same airline and route.
3 Following Stigler (1987) and Varian (1989), we think of discriminatory prices as
differences in markups of price over cost; cost-based differences, such as peak-load pricing, hold markups constant.
COMPETITION AND PRICE DISPERSION
route is about 36 percent of the airline's mean ticket price on the route. Competitive routes exhibit more price dispersion, whereas in-creased market density and high concentrations of tourist traffic ap-pear to reduce price dispersion, consistent with models of monopolis-tically competitive price discrimination (Borenstein 1985; Holmes 1989).4 Variations in airport congestion are associated with increased dispersion, as would be expected from peak-load pricing.
While the evidence is suggestive of price discrimination, it is impor-tant to recognize that our analysis is not normative: Price discrimina-tion may increase or decrease social welfare. Furthermore, airline cost functions may imply that some degree of price discrimination (similar to Ramsey pricing) is necessary to enable carriers to break even.
We describe our measure of price dispersion and the variations in dispersion across carriers and markets in Section II. Section III dis-cusses possible sources of price dispersion, including both discrimina-tion-based and cost-based explanations. The empirical model and methods are described in Section IV. Results are presented in Section V, and their implications are explored in Section VI.
II. Summary Measures of Price Dispersion in the U.S. Airline Industry
The extent of actual price dispersion in the U.S. airline industry has not been previously measured, despite evidence of substantial variation in published fares and widespread recognition of the critical role of "yield management.,,5 To determine the magnitude of price dispersion and describe its distribution across markets, we first de-velop measures of price dispersion based on actual prices paid for air travel.
Our analysis is based on a 10 percent random sample of U.S. airline tickets used during the second quarter of 1986. We focus on direct coach class travel in the largest direct service U.S. domestic markets.6
Change-of-plane and first-class travel are excluded because they en-tail significantly different qualities of service than direct coach travel and controlling for their associated cost differences would be very
4 Some of these findings could also be consistent with specific models of peak-load pricing. We discuss this in detail below.
5 "Yield management" refers to the industry's dynamic allocation of discount seats so as to maximize revenue on each flight. See Belobaba (1987) for an extensive discus-sion of this practice.
6 Direct service means that a passenger does not change planes; i.e., it excludes change-of-plane service. The data do not allow us to distinguish between nonstop service and other direct service, i.e., travel with on-plane stops.
difficult. To enhance comparability across airlines, we restrict the analysis to the 11 major U.S. airlines in 1986. Appendix A details the construction of the data set.
Measuring Price Dispersion
Although it is tempting to discuss airline pricing in terms of discounts off the full coach fare, this distinction is not useful. According to the Air Transport Association, more than 90 percent of domestic passengers receive a discount off the coach fare, so the full coach fare on a route is not a useful starting point for examining the distri-bution of fares. Indeed, focusing on any single fare as a baseline is unlikely to be appropriate. At any point in time, a large U.S. carrier is likely to have 20 or more fares available on a given route. The modal fare on a route is more commonly near the median than among the top fares, and even the modal fare usually accounts for less than 30 percent of ticket sales.
We therefore measure price dispersion, or inequality, with a Gini coefficient (GINI) of fares paid.7 The Gini reflects fare inequality
across the entire range of fares paid. Multiplying the Gini coefficient by two gives the expected absolute difference in prices as a proportion of the mean price for two customers drawn at random from a popula-tion. A Gini coefficient of .10 therefore implies an expected absolute price difference of 20 percent of the mean fare.
Stylized Facts about Airline Price Dispersion
There is substantial dispersion in the prices that an airline charges different customers in the same market. The average Gini coefficient for our sample is .181, which corresponds to an expected absolute fare difference of 36 percent of the mean fare for two passengers selected at random on a given carrier and route. Differences in aver-age fares across carriers on a route are small relative to differences in prices across customers of each airline: on the 336 routes in our sample served by more than one major carrier, the ratio of within-carrier price variation to total (within and between) variation averages 97 percent.8
7 The results of our study are very similar when we instead measure dispersion by the coefficient of variation or the relative interquintile range of fares. All three mea-sures are highly correlated in our sample. Other empirical studies of price dispersion have used the variance or standard deviation of prices (Pratt, Wise, and Zeckhauser 1979; Dahlby and West 1986) or the ratio of highest to lowest prices (Pratt et al. 1979; Schwieterman 1985).
B This ratio averages 94 percent when all carriers, not just the 11 major carriers, are
COMPETITION AND PRICE DISPERSION
There is considerable variation in price dispersion across different carrier-routes. The Gini coefficient in our sample ranges from .018 (an expected price difference of 3.6 percent of mean fare) on East-ern's Boston-LaGuardia shuttle route to .416 (an expected price dif-ference of 83.2 percent of the mean) on Trans World Airlines' Phoe-nix-Las Vegas route.9 In the market with the tenth percentile Gini,
the bottom half of the passengers contribute 37 percent of total reve-nues, whereas in the market with the ninetieth percentile Gini, the bottom half of passengers contribute only 27 percent of total reve-nues; this contribution drops to 20 percent in the maximum Gini market.
Some patterns of dispersion are apparent from simple correlations in the data. First, price dispersion is inversely correlated with concen-tration on the route. The correlation between the Gini coefficient and the passenger Herfindahl index on the route is - .153. Second, the dispersion of fares for a carrier-route is larger when the average fare is itself large: the correlation coefficient between GINI and the average fare is .354.
This may suggest that airlines with more sophisticated yield man-agement techniques are able to raise average fares through more precise market segmentation. Yield management also is credited with allowing airlines to fill more seats on each flight without sacrificing revenues, an assertion that is consistent with the positive correlation of .130 between GINI and the carrier's average load factor on its nonstop flights on the route. Finally, for routes on which two or more major carriers compete, higher within-carrier price dispersion is asso-ciated with higher between-carrier dispersion of mean fares, with a correlation of .361 between the two coefficients of variation. This also may reflect differences in the effectiveness of yield management across carriers. When fare spreads are high, small differences in carri-ers' yield management abilities may translate into significant differ-ences in average fares. We discuss possible explanations of these cor-relations in the following section.
III. Sources of Airline Price Dispersion
The dispersion we observe in airline prices may arise both from varia-tions in the costs of serving different passengers and from discrimina-tory pricing. Disentangling these sources is difficult because product heterogeneities that may affect the airline's costs-for example, the time and day of the week on which travel occurs, ticketing restrictions, and the number of stops that a passenger must make-also may
vide a basis for self-selective discrimination. Indeed, self-selective price discrimination relies on product heterogeneity, since it is carried out by offering consumers a set of alternatives and allowing their choices to reveal information about their characteristics. Many restric-tions associated with discount tickets are intended to foster self-selection, separating business passengers from discretionary passen-gers (e.g., those traveling on vacation or to visit friends or relatives; see Elkins [1986]).
Data limitations combined with the nature of airline cost functions prevent us from testing for the presence of price discrimination by comparing the markup of price over marginal cost across tickets. Instead, we study the relationship between price dispersion and fac-tors that might indicate either price discrimination or cost variations. We therefore can distinguish competing explanations of price disper-sion only if we can identify variables that affect price disperdisper-sion solely through price discrimination or solely through cost variation, or if the expected signs of the variables depend on whether price discrimi-nation or cost differences drive the observed price variation. The remainder of this section describes, first, the patterns of price disper-sion predicted by a model of price discrimination in imperfectly com-petitive markets and, second, the patterns of dispersion likely to result from cost-based variation in prices.
Price Discrimination
Before we can generate predictions of the effects of specific variables on discrimination-induced price dispersion, we must describe the ex-pected operation of price discrimination in imperfectly competitive markets. In monopoly markets, price discrimination is limited only
by the diversity of the demand elasticities in the customer population and by the firm's ability to segment demand. In the standard textbook
model of perfect competition, price discrimination cannot be sus-tained. If one extrapolates from these polar cases, the degree of ob-served price discrimination would be expected to decrease as a mar-ket became less concentrated. Theoretical works by Borenstein (1985) and Holmes (1989) indicate, however, that price discrimination may increase as a market moves from monopoly to imperfect competition. To develop an intuition for this in an airline context, consider a route on which a single incumbent carrier charges "full fare" to busi-ness travelers (who are likely to have low demand elasticities for air travel and high brand allegiance) and a discount fare to discretionary travelers (who are likely to have higher demand elasticities for air travel and low brand allegiance). If entry by a new carrier induces the incumbent to lower both prices but to lower the discount price by
COMPETITION AND PRICE DISPERSION
relatively more, then price dispersion may increase as concentration declines in the market. Borenstein (1989) finds indirect evidence of this phenomenon, as lower-end fares appear to be more responsive to competition than higher-end fares.
Under imperfect competition, a firm's price to a specific customer group may depend on both the group's "industry" elasticity of de-mand (i.e., the dede-mand elasticity for the general product, such as air travel on a given route) and the group's cross-elasticity of demand among specific brands (e.g., flight times or airlines). In Borenstein's (1985) and Holmes's (1989) models, segmenting consumers on the basis of their cross-elasticity of demand among brands typically will produce greater price dispersion if the market is more competitive. We shall refer to discrimination based primarily on this type of seg-mentation as "competitive-type" discrimination. This is contrasted with "monopoly-type" discrimination, in which customers are sorted by their industry elasticities of demand. Monopoly-type discrimina-tion typically will generate greater price dispersion if the market is closer to monopoly.
Existing models of price discrimination in imperfectly competitive markets assume that each firm produces a single "brand" (corre-sponding to a flight in our application). This assumption is untenable in airline markets, where each firm typically offers a number of flights on a route. We therefore have modified Borenstein's (1985) model to investigate the implications of allowing for multibrand firms. Be-cause this does not generate simple closed-form solutions, we use simulation methods to derive comparative statics results. The model and simulation methods are described in Appendix B; we use the key predictions of the model to guide our discussion below. We group the factors likely to influence the amount of discriminatory price dis-persion in an airline market by market structure, consumer popula-tion attributes, and product characteristics.
Market Structure
The expected effect of market structure on price dispersion will de-pend on whether monopoly-type or competitive-type price discrimi-nation dominates. Our model suggests that price dispersion should increase with concentration if industry elasticities are the more preva-lent basis for segmentation (monopoly-type discrimination) and de-crease with concentration if heterogeneities in cross-elasticity are the more common source of discrimination (competitive-type discrimina-tion). Specifically, under monopoly-type discrimination, monopoly markets will exhibit the most price dispersion, followed by duopoly markets, followed by competitive markets. The ranking is exactly
660 JOURNAL OF POLITICAL ECONOMY
reversed under competitive-type discrimination. We measure mar-ket structure using both continuous measures of concentration (HERFINDAHL) and discrete structure variables (MONOPOLY, DUOPOLY, and COMPETITIVE).lo
Population Attributes
Price discrimination is likely to increase with the variance of attributes in the population that reflect buyers' industry elasticities or cross-elasticities among brands.l l These consumer characteristics are
usu-ally positively correlated; for example, business travelers seem to have lower industry demand elasticities than "tourist" travelers and to have higher time valuations, making them less willing to switch flights to get a lower fare and implying a lower cross-elasticity of demand across firms or flights. This suggests that under both types of price discrimi-nation, price dispersion will be lower in markets in which either busi-ness or tourist customers dominate the population than in markets in which both types of passengers are prevalent. Our control for variations in customer distribution is a proxy for the tourist/business mix on a route. This variable, TOURIST, does well in identifying high-tourism markets but is not very powerful in distinguishing among markets with low or moderate amounts of tourist traffic. We therefore expect price dispersion to decrease as TOURIST rises even though a more precise measure of the tourist/business mix might show a nonmonotonic effect.
Greater population density is likely to generate greater equilibrium product variety, as measured by flight frequency, which may affect both monopoly-type and competitive-type discrimination. More fre-quent service increases the convenience of traveling on the route and thus raises consumers' net reservation prices generally (i.e., lowers industry elasticities). The increased value of the product probably is greater for business travelers, who tend to place a higher value on their time. Under monopoly-type discrimination, improvements in service would then imply increased price dispersion.
A high density of flights on a route also decreases the time between competing flights, thereby increasing the substitutability across flights. Thus if heterogeneity in cross-elasticities is the basis for seg-mentation of demand (i.e., competitive-type discrimination), price dispersion is likely to decline as density increases, because the cost of
10 All variables are defined in App. A.
11 An exception to this can occur if the dispersion of some characteristic within the
population implies a higher price for a group that would pay a lower price in the absence of that dispersion, or vice versa.
COMPETITION AND PRICE DISPERSION 661
switching flights becomes a relatively smaller share of the total cost to consumers. Monopoly-type discrimination by multiple sellers may also become less effective as density of flights increases, because more buyers will get positive surplus from flights offered by different firms, thus making cross-elasticities the more effective basis for discrimina-tion. Simulations of our model suggest that increased flight density always decreases competitive-type discrimination. It decreases mo-nopoly-type discrimination in almost all cases in which there are mul-tiple firms.12 Monopoly-type discrimination by a monopoly seller, however, always increases with this change.
Market density is measured by the total number of flights on the route (FL TTOT). Its predicted effect is positive under monopoly-type discrimination practiced by a monopolist and negative under competitive-type discrimination. Under monopoly-type discrimina-tion with multiple firms, the effect of FL TTOT could be positive or negative. Because the predicted effect of market density differs with market structure, we interact FLTTOT with the monopoly, duopoly, and competitive dummy variables to allow different effects under each structure.
Price dispersion also may depend on firms' relative positions in the market. A carrier with a large share of the flights on a route may be less responsive to differences in cross-elasticities when setting its prices. For example, if an airline offers 10 of the 11 daily flights on a route, then a customer's willingness to switch from his most preferred departure time may have little effect on the carrier's pricing strategy, since the customer's second most preferred flight is likely to be with the same airline. The airline that offers only one of the 11 daily flights would be quite concerned with distinguishing which of its potential passengers can most easily switch flights, however. Indeed, in the model simulations, dispersion increases with market share under mo-nopoly-type discrimination and decreases with market share under competitive-type discrimination. 13
We consider both continuous (FLTSHARE) and discrete measures of market share. In the discrete case, market share is redundant for monopoly and symmetric duopolies. For asymmetric duopolies we include dummy variables for the large firm (LARGE-DUOP) and the
12 In the notation of App. B, flight density effects are modeled by equal proportional
decreases in the f.Lc of both groups (the equivalent of equal increases in the number of flights available to both groups). The exceptions for monopoly-type discrimination with multiple firms occur when the f.Lc are very high. So very few consumers get positive surplus from more than one brand, thus causing each brand to act like a local monopolist.
13 This is the case in which the customer groups are sufficiently different in their average strength of brand preference.
small firm(s) in the market (SMALL-DUOP). For competitive mar-kets, we interact the carrier's share of flights on a route with the dummy variable for competitive market structure (FL TSHARE-COMP).
Product Attributes
Differences between two markets in product attributes could induce differences in the level of price dispersion even if distributions of consumer types across the two markets were identical. This may occur when product attributes have different effects on the elasticities of different customers. In airline markets, frequent-flyer plans (FFPs) seem to be the attribute most likely to increase the variance in cus-tomer elasticities. These programs offer bonuses, usually free trips, after passengers have purchased specified amounts of air travel from the carrier. Typically these schemes are highly nonlinear, with an increasing marginal value of bonuses as total miles flown with the carner mcrease.
Frequent-flyer plans tend to reduce both industry and cross-elasticities by increasing the value of the total product delivered with a ticket (raising a customer's reservation price) and by giving a cus-tomer an incentive to concentrate his business with a single firm. These effects are likely to be stronger for business travelers than for discretionary travelers, since infrequent travelers are much less likely to be active FFP participants. Business travelers generally pay higher prices even in the absence of FFPs, so these programs probably raise the dispersion of prices charged by an airline.
Unfortunately, we have no data on FFP membership. We use as a proxy for the potential significance of FFPs a measure of the airline's dominance of traffic at the endpoint airports on a route. The plans are likely to be most attractive when an airline offers many flights from a customer's "home" airport, both because this offers opportu-nities for faster accumulation of mileage (and therefore more valu-able bonus trips) and because it offers broader choices of destinations for bonus travel.14 We try to capture this effect with ENDDOMO, a
measure of the carrier's share of all originating passengers at the endpoint airports on a route. As a proxy for FFP effectiveness, we
14 As Levine (1987) and Borenstein (1989) argue, the frequent traveler may tend to concentrate his business with the airline that he is most likely to fly on in the future, which will probably be one of the airlines that offer the most flights from his home airport. Borenstein (1991a) presents evidence that a carrier's airport dominance has a greater effect in attracting business travelers than leisure travelers, which he attrib-utes in part to FFPs.
COMPETITION AND PRICE DISPERSION
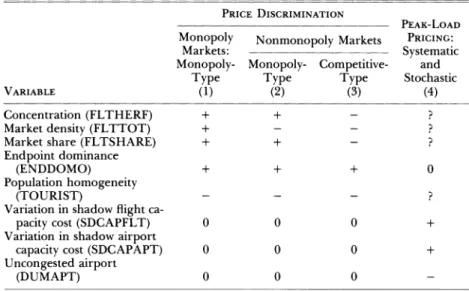
TABLE 1
PREDICTED COEFFICIENT SIGNS UNDER ALTERNATIVE MODELS OF PRICE DISPERSION
PRICE DISCRIMINATION
PEAK-LoAD Monopoly Nonmonopoly Markets PRICING:
Markets: Systematic Monopoly- Monopoly- Competitive- and
Type Type Type Stochastic
VARIABLE (1) (2) (3) (4)
Concentration (FL THERF) + +
Market density (FL TTOT) +
Market share (FL TSHARE) + +
Endpoint dominance
(ENDDOMO) + + + 0
Population homogeneity (TOURIST)
Variation in shadow flight
ca-pacity cost (SDCAPFL T) 0 0 0 +
Variation in shadow airport
capacity cost (SDCAP APT) 0 0 0 +
Uncongested airport
(DUMAPT) 0 0 0
expect ENDDOMO to be positively associated with price dispersion under either monopoly-type or competitive-type discrimination. 15
Table 1 summarizes the predicted signs of each variable discussed above under the alternative models of monopoly-type and competi-tive-type discrimination.
Cost-Based Sources of Price Dispersion
We consider two sources of cost variations across passengers that may generate significant variation in observed ticket prices in our data set. Both are types of peak-load or congestion pricing. "Systematic" peak-load pricing reflects variations in the expected shadow costs of capacity at the time a flight is scheduled. "Stochastic" peak-load pric-ing refers to demand uncertainty for individual flights that is resolved only after equipment scheduling decisions are made. This distinction proves useful because the data allow us to control directly for the former effect, but not for the latter.
15 This effect may be somewhat offset under competitive-type discrimination to the extent that airport dominance lessens the threat of potential entry on a route from the airport and allows a carrier to behave more like a monopolist.
664 JOURNAL OF POLITICAL ECONOMY
Systematic Peak-Load Pricing
Variations in capacity utilization over the time of day or day of week may generate differences in the opportunity cost of providing airline service, leading to prices that depend on when a particular customer travels.16 During daily or weekly peak periods, most of an airline's
aircraft will be in the air, so the expected shadow cost of aircraft capacity will be quite high. At other times, the shadow cost of addi-tional seats may be near zero. Similarly, when airport runways or air traffic control is operating near capacity, congestion is likely to lead to slowdowns and associated cost increases. Airlines may be unable to add additional flights, raising the shadow cost of a seat. Peak-load pricing, reflecting variations in these shadow costs, will result in higher prices during congested periods and lower prices during off-peak periods.
This price variation is systematic in that it is based on variations in shadow costs known when a flight is opened for booking. Airlines have good information on their own utilization rates and on expected airport congestion levels at the time they create their flight schedules. Schedules rarely are changed in response to demand patterns after a flight is opened for booking. Flights scheduled for peak periods will be allocated fewer discount seats, thus raising their average fares. Off-peak flights will be allocated more discount seats, resulting in lower average fares.
We cannot obtain information on the travel times or flight numbers for specific tickets, so direct estimation of congestion premia is not possible. Price dispersion due to systematic peak-load pricing, however, should be correlated with the variability in airlines' fleet utilization rates and airports' operations rates. For example, if all flights on American between two uncongested airports take place at off-peak periods, there should be almost no price variation due to peak-load pricing. On the other hand, if one of American's flights on this route occurs at 8 A.M. on weekdays and its others remain at off-peak times, then variation in the shadow price of aircraft capacity for American's flights on this route will imply variation in observed ticket prices. Similarly, if some of a carrier's flights on a route occur when the endpoint airports are congested and others do not, variation in the shadow cost of runway usage should be reflected in price variation.
We assume that airline fleet capacity and airport congestion are the
16 Holidays and seasonal variations in demand also may generate predictable peak-load pricing patterns over the year. The period we examine, April-June, is a "shoul-der" demand period (i.e., neither the summer peak nor the winter trough) and does not have significant holiday spikes in traffic.
COMPETITION AND PRICE DISPERSION 665 two most important constraints on providing peak service. 17 Conges-tion costs and shadow capacity costs probably are highly nonlinear convex functions of capacity utilization. The effect of a marginal change in utilization is greatest at high levels of capacity utilization and relatively small over a wide range oflow utilization rates. We use higher-order powers of the capacity utilization rate to capture this nonlinearity in shadow costs. The results reported below use the stan-dard deviation of the cubed airline fleet utilization rate, SDCAPFL T, and the standard deviation of the cubed airport operations rate, SDCAP APT, to reflect variations in the underlying shadow costS.18
Because traffic never reaches capacity levels at most smaller U.S. airports, even during peak travel periods, we construct airport capac-ity utilization rates only for designated congested airports. For routes between the remaining airports, we assume that variations in airport operations rates do not contribute to variations in the shadow costs of providing service. We therefore set SDCAPAPT (or its log) equal to zero and include a dummy variable, DUMAPT, for these routes. To the extent that price dispersion is related to cost-based peak-load pricing variations, the coefficients on SDCAPFL T and SDCAP APT should be positive and the coefficient on DUMAPT should be neg-ative.
The extent of price dispersion due to systematic variations in the shadow cost of fixed inputs may be affected by market structure, suggesting that effects from peak-load pricing may influence the coef-ficient estimates for market structure and market share. Unfortu-nately, these effects cannot be signed a priori. Depending on the shape and location of the demand curves, the differences between peak and off-peak prices may be larger or smaller for competitive firms than for a monopolisLI9
Stochastic Peak-Load Pricing
The effect of demand uncertainty on price dispersion due to peak-load pricing depends on the degree of pricing flexibility that firms have after capacity is set. If an airline can adjust price as demand is revealed over time, then the optimal peak-load price will reflect mar-ginal operating costs plus a charge based on the probability at the time
17 Scarce gate capacity at airports may add an additional cost but is highly correlated with the two measures of congestion that we examine.
18 Qualitatively similar results were obtained with measures based on squared rates or higher-order terms.
19 This statement is clearly true when the peak and off-peak demand curves have very different elasticities. Simulations with constant elasticity demand revealed that it is also true when the elasticities do not change as the strength of demand varies.
666 JOURNAL OF POLITICAL ECONOMY
the ticket is sold that demand will exceed capacity and the expected shadow cost of capacity if it does (Crew and Kleindorfer 1986). Changes over time in the perceived probability that demand will ex-ceed capacity for a particular flight would cause prices for seats on that flight to vary with purchase date, increasing or decreasing as the flight date approached. This may induce price variation among passengers on a single flight or on the same flight number on differ-ent days.
If an airline cannot adjust prices after capacity is set, then, as Pres-cott (1975), Salop (1978), and most recently Dana (1992) have shown, equilibrium ex ante prices under competition, oligopoly, or monopoly will be different for different units sold and will increase with the number of units sold. Dana shows that under certain restrictive as-sumptions, the variance of prices is greater under competition than under monopoly, but that the result does not hold generally. In all these papers, units are sold in strictly increasing order of price, and lower-priced units are never withdrawn from the market or repriced at a higher level. These assumptions are less consistent with the airline industry than those associated with price flexibility after capacity is set: Full-fare tickets often are sold when discount seats are still avail-able, because the buyer does not meet the Saturday-night-stay restric-tion on most discounts; advance-purchase requirements ensure that airlines remove the most deeply discounted seats from sale well be-fore flight time, regardless of the revealed demand for that flight; and yield management departments at major airlines employ hundreds of individuals who constantly adjust the availability of tickets that carry different prices.
Regardless of the exact form of stochastic peak-load pricing in this industry, diagnosing its effect on price dispersion requires informa-tion unavailable to us. Average price, demand, or load factor by scheduled flight number (e.g., the average demand for the Friday 4
P.M. flight on a route) is not sufficient, since such historical data
would be available to the airline at the time flights are scheduled. The stochastic component of demand for a flight, in the sense that we are discussing it here, is orthogonal to all information that a car-rier has at the time of scheduling. In the absence of information on each flight departure, we cannot directly control for price dispersion due to stochastic peak-load pricing.
The presence of stochastic peak-load pricing has ambiguous impli-cations for the interpretation of our parameter estimates. Models of this effect have not generated clear, testable predictions. Stochastic peak-load pricing may cause greater or less price dispersion as com-petition increases, depending on the characteristics of demand. Fur-ther, dispersion due to stochastic peak-load pricing may increase or
COMPETITION AND PRICE DISPERSION
decrease with flight density. An increase in the number of flights is likely to raise the demand uncertainty for any given flight but may lower the shadow value of capacity for flights that face excess de-mand.20 Similar offsetting arguments may apply to the TOURIST
variable, depending on whether tourist demand for specific flights is more or less variable than business demand. We do not expect ENDDOMO to be affected by stochastic peak-load pricing, and the capacity variables, which reflect systematic peak-load variations, are orthogonal to stochastic variations in demand by definition. These predicted signs are summarized in column 4 of table 1.
Although we cannot control directly for stochastic peak-load pric-ing, it is important to recognize that airline pricing policies signifi-cantly deviate from these models. In particular, discount fare tickets are accompanied by advance-purchase, minimum-stay, and Saturday-night-stay restrictions rather than just use or time-of-purchase differentials. It is hard to see how these additional restric-tions could be justified on the basis of shadow capacity costS.21 Indeed,
one airline pricing manager has described Saturday-night-stay re-quirements as "the single best restriction of them all [for] separating business from pleasure travel" (Elkins 1986).
IV. Specification of the Empirical Model
An observation in our empirical work is the price dispersion of a single carrier, k, among all "local" passengers that it carries between
20 Demand uncertainty, measured by the variance of passengers who prefer each specific flight, seems to be nondecreasing in the number of flights, with average passen-gers per flight held constant. Consider, e.g., two markets, one with N passengers and F flights and a second with 2N passengers and 2F flights. If each passenger has proba-bility p = 1 IFL TTOT of preferring flight i and flight preferences follow a binomial distribution, then the variance of the number of passengers preferring flight i is equal to Np(1 - P), which is greater in the second (larger) market. On the other hand, the premium a passenger is willing to pay to take her most preferred flight is likely to fall as the availability of more flights lowers the cost of switching to another flight.
21 Two other cost-based justifications for advance-purchase discounts are unlikely to explain a substantial proportion of price dispersion. The first is that bookings made far in advance allow the airline to more accurately forecast demand and, in response, to reschedule equipment. As mentioned above, airlines almost never alter flight sched-ules in response to advance bookings. The second is that the type of people who meet these restrictions are less likely to be "no-shows." Borenstein (1983) demonstrates that the difference in the no-show rates of discount vs. full-fare passengers justifies a cost-based price difference of less than 2 percent. Gale and Holmes (1993) argue that advance-purchase restrictions could be used to efficiently allocate seats on peak-demand flights to those who value them most. They conclude that such restrictions dominate explicit peak-load pricing for a monopolist because they allow greater extrac-tion of consumer surplus, suggesting price discriminaextrac-tion, not cost-based price vari-ation.
668 JOURNAL OF POLITICAL ECONOMY
two airports, i,j.22 We measure dispersion by the GINI coefficient of fares. Because our data combine tickets purchased over a 3-month period without any date-identifying information, we include a control for intraquarter fare variation. The variable INQGINI is the tempo-ral Gini coefficient of the lowest published fares on a carrier-route for the second quarter of 1986.23 For observations with no intertem-poral price variation, we set the log of INQGINI equal to zero and created a dummy variable, DUMINQ, equal to one.
We report estimates from two empirical models of price dispersion. Because theory provides little guidance on the functional form, each model is estimated in constant elasticity (log-log) and linear forms. 24 The first model specifies the GINI coefficient to be a function of competitive conditions, population characteristics, congestion mea-sures, and intraquarter fare changes. The constant elasticity form of this model is In GINIijk
=
~o+
~lln FLTHERFij+
~21n FLTSHAREijk+
~31n FLTTOTij+
~41n ENDDOMOijk+
~51n TOURISTijk+
~6InSDCAPFLTijk+
~7InSDCAPAPTijk+
~8DUMAPTij+
~9InINQGINIijk+
~lODUMINQijk+
ak+
'Vij+
1]ijk'(1)
where In denotes the natural log. We specify the error term to have a carrier effect (ak)' a route effect ('Vij) common to all carriers on a given route, and a "white-noise" error specific to the observation (1]ijk)'
While equation (1) is a parsimonious model of the theoretically important factors that we can measure, it restricts the coefficients to be the same across market structures. Since our model simulation results suggest that market share and density may have different effects under different market structures, we also estimate a model that incorporates market structure interactions. The constant elastic-ity form of this model is
22 The term "local" here means that passengers who travel between these two airports but are connecting to other flights are excluded. We treat individual airports within a city (such as O'Hare and Midway in Chicago) as separate markets.
23 A similarly defined variable based on full coach fares had a negative and weakly significant effect on overall price dispersion, but its inclusion has virtually no effect on the other coefficients or their standard errors.
24 Log-linear specifications are similar to those reported here but fit the data less well.
COMPETITION AND PRICE DISPERSION
In GINIijk = 130M MONOPOLY ij
+
l3oDDUOPOLYij+
l3ocCOMPETITIVEij+
131wLARGE-DUOPijk+
131sDSMALL-DUOPijk+
131 c In FLTSHARE-COMPijk+
132 In FLTHERF-COMPij+
133M In FLTTOT-MONOPij+
133D In FLTTOT-DUOPij+
133c In FLTTOT-COMPij+ 134 In ENDDOMOijk + I3sln TOURIST ijk
+
136 In SDCAPFLTijk+
137 In SDCAPAPT ijk+ 138DUMAPTij + I3glnINQGINIijk
+
1310DUMINQijk+ uk
+
"Iij+
1]ijk,669
(2)
where MONOP, DUOP, and COMP denote the interaction of a con-tinuous variable with the relevant market structure dummy variable. 2s The models are estimated by a generalized least squares instrumen-tal variables approach. We treat carrier effects as fixed and route effects as random, and we address the possible endogeneity of FL TTOT, FL TSHARE, and FL THERF.26 Table 2 presents summary statistics for all variables used in the analysis.
V. Results of the Empirical Analysis
Table 3 reports results from constant elasticity (log-log) and linear formulations of both econometric models. Since the main qualitative
25 Tests of the equality of coefficients on SDCAPFLT, SDCAPAPT, and DUMAPT across market structures did not come close to rejecting common coefficient values for the latter two variables and were only marginally significant (at the .08 level) for SDCAPFL T. The last result seems to arise from a negative estimate for SDCAPFL T in monopoly markets, which we cannot easily reconcile with peak-load pricing interpre-tations. Given this puzzling result and the robustness of all other parameter estimates to our treatment of the peak-load pricing variables, we impose the constraint of common peak-load pricing coefficients across market structures in our estimates.
26 Following Hausman and Taylor (1981), we use as instruments outside instruments (described in App. A) and route means of exogenous variables in the system. Specifica-tion tests provided some evidence of bias if FL TTOT and FL TSHARE were treated as exogenous but none for FL THERF. In eq. (2), we use instruments interacted with the market-type dummy variables. We do not use instruments for market type or firm rank in asymmetric duopoly.
TABLE 2
SUMMARY STATISTICS FOR VARIABLES IN REGRESSION ANALYSIS
Standard
Variable Mean Deviation Minimum Maximum
GINI .181 .063 .018 .416 MONOPOLY .064 .000 1.000 DUOPOLY .345 .000 1.000 COMPETITIVE .591 .000 1.000 LARGE-DUOP .078 .000 1.000 SMALL-DUOP .069 .000 1.000 FLTHERF .437 .190 .163 1.000 FLTSHARE .394 .244 .002 1.000 FLTTOT .178 .126 .014 .930 ENDDOMO .207 .117 .009 .715 TOURIST .014 013 .003 .070 SDCAPFLT .197 .063 .000 .358 SDCAPAPT .094 .058 .000 .288 DUMAPT .086 .000 1.000 INQGINI .070 .068 .000 .373 INQDUM .222 .000 1.000 AMEANPOP 2.890 1.574 .376 8.921 GMEANPOP 2.292 1.378 .197 8.909 PAXI975 .134 .160 .000 1.306 DISTANCE .624 .469 .077 2.677 GEOSHARE .269 .171 .010 1.000 XFLTHERF .408 .133 .155 1.000
Within Monopoly Markets (65 Observations, 65 Routes)
GINI .155 .042 .070 .267
FLTTOT-MONOP .070 .042 .014 .218 Within Duopoly Markets
(352 Observations, 215 Routes)
GINI .185 .058 .049 .330
LARGE-DUOP .227 .000 1.000
SMALL-DUOP .199 .000 1.000
FLTTOT-DUOP .125 .062 .027 .444 Within Competitive Markets
(603 Observations, 241 Routes)
GINI .181 .066 .018 .416
FL TSHARE-COMP .270 .156 .002 .763 FLTHERF-COMP .322 .079 .163 .603 FLTTOT-COMP .220 .141 .034 .930
TABLE 3
PRICE DISPERSION REGRESSION RESULTS
(Dependent Variable: GINI; N = 1,020)
MODEL 1: MODEL 2:
PARSIMONIOUS MARKET STRUCTURE
Log-Log Linear Log-Log Linear
VARIABLE (1) (2) (3) (4) CONSTANT -1.742 .197 (.039) (.005) MONOPOLY -2.169 .154 (.411) (.032) DUOPOLY -2.033 .174 (.215) (.035) LARGE-DUOP - .117 -.022 (.055) (.010) SMALL-DUOP -.067 -.017 (.061) (.009) COMPETITIVE -1.807 .172 (.259) (.024) FLTHERF -.323 -.092 (.072) (.026) FLTHERF-COMP -.250 -.141 (.126) (.064) FLTTOT -.169 -.036 (.052) (.035) FLTTOT-MONOP -.178 -.268 (.136) (.289) FLTTOT-DUOP -.241 -.067 (.079) (.102) FL TTOT-COMP -.041 .009 (.063) (.038) FLTSHARE .010 .033 (.057) (.026) FL TSHARE-COMP .049 .104 (.052) (.029) ENDDOMO .087 .063 .075 .035 (.028) (.023) (.026) (.021) TOURIST -.066 -.549 -.055 -.483 (.023) (.173) (.023) (.176) SDCAPFLT .061 -.012 .053 -.031 (.027) (.033) (.023) (.030) SDCAPAPT .032 .070 .027 .045 (.021) (.039) (.018) (.038) DUMAPT -.345 -.023 -.316 -.024 (.078) (.009) (.071) (.009) INQGINI .047 .091 .043 .094 (.014) (.030) (.014) (.030) INQDUM -.154 -.144 (.050) (.050)
results are robust to changes in the functional form, we focus our discussion on the constant elasticity results in columns 1 and 3. While no single variable can prove or disprove the existence of price dis-crimination, the pattern of results across the market characteristic measures provides strong support for a conclusion of competitive price discrimination as one source, though not the only source, of airline price dispersion. The data also provide evidence of cost-based variation as an additional source of airline price dispersion.
The strongest and most striking result in our work is the significant positive effect of competition on price dispersion. This is robust across a broad range of specifications we have explored. In model 1, for example, a one-standard-deviation reduction in FL THERF from its mean (a 43 percent decrease) raises GINI by about 14 percent, with all else held constant. This regularity also is evidenced in the pattern of market structure constants in model 2. Monopolists and carriers in asymmetric duopolies have the least price dispersion, fol-lowed by symmetric duopolists and carriers in competitive marketsP Formal hypothesis tests reject equality of dispersion between any two market structures except monopolists with asymmetric duopolists and competitive firms with symmetric duopolists. The degree of competi-tion within competitive markets exerts a significant effect on price dispersion as well. A one-standard-deviation decrease in FL THERF from its mean within competitive markets (about 25 percent for these markets) raises GINI by about 7 percent. These results are consistent with the predictions of competitive-type price discrimination models and reject monopoly-type discrimination as the sole or dominant source of airline price dispersion.
The results for route density, measured by FLTTOT, further sug-gest the existence of price discrimination in airline markets. Higher route density appears to lower a carrier's price dispersion, with mar-ket concentration and the carrier's route share held constant. In modell, increasing FL TTOT by one standard deviation from its mean (an increase of 70 percent) reduces the Gini coefficient by 12 percent. This is consistent with price discrimination in multifirm mar-kets, in which differences in customers' willingness to switch firms become less important as the number of flights increases and the
27 Market structure effects are evaluated at the overall mean of In FL TTOT, the mean In FL TSHARE, and In FL THERF for competitive markets; all remaining vari-ables are held constant at the mean of their logs (DUMAPT and INQDUM are set to 0.0). Mean In GINI rankings are estimated as follows: competitive (- 1.64), symmetric duopolists ( - 1.69), small asymmetric duopolists ( - 1.76), large asymmetric duopolists (-1.81), and monopolists (-1.95). These estimates correspond to average GINIs of about .20 for competitive markets down to .14 for monopoly markets, all else equal.
COMPETITION AND PRICE DISPERSION
differences across firms decrease (as measured by differences in de-parture times).
The data unfortunately do not have much power in testing for differential effects of flight density across monopoly and multifirm markets. In column 3, the impact of flight density is largest for duop-oly markets (and statistically distinguishable from zero only for these markets). Increasing flight density by one standard deviation within duopoly markets (about 50 percent of the mean in these markets) reduces GINI by 12 percent. The standard errors on the density coefficients in monopoly and competitive markets are so large, how-ever, that we cannot reject the hypothesis of constant density effects across all market structures. The imprecision is even larger in the linear specifications, making it impossible to statistically distinguish FL TTOT from zero in either linear model.
The estimated effects of a carrier's relative market position on price dispersion are mixed. The variable FL TSHARE is estimated to have a positive effect in model 1 but cannot be distinguished statistically from zero. This result is echoed for competitive markets in model 2, where the coefficient for FL TSHARE-COMP suggests an increase in dispersion with market share, significant only in the linear formula-tion. Positive point estimates are consistent with monopoly-type dis-crimination, but such an interpretation seems least plausible for com-petitive markets. In contrast, large firms in an asymmetric duopoly have significantly less dispersion than firms in a symmetric duopoly, which is consistent with competitive-type discrimination. Large firms also are estimated to have less dispersion than small firms in an asym-metric duopoly, but we cannot reject the hypothesis that two coeffi-cients (on LARGE-DUOP and SMALL-DUOP) are equal. The impre-cision of these results and mixed pattern of point estimates do not permit a conclusive statement about the role of market share in de-termining airline price dispersion.
Airport dominance, measured by ENDDOMO, tends to raise dis-persion, as predicted under all models of price discrimination we discussed. In the constant elasticity specifications, a one-standard-deviation increase in ENDDOMO from its mean (an increase of 56 percent) raises dispersion by 4-5 percent. The results are consistent with a greater effectiveness of frequent-flyer programs in raising high-end or business class fares at airports that the carrier dominates. Finally, higher concentrations of tourist traffic are associated with lower levels of price dispersion in all the regressions. When the value of TOURIST is one standard deviation above its mean value (a 100 percent increase from the mean), the Gini coefficient is 5.5-6.6 per-cent smaller. This effect may reflect variation in both industry and cross-elasticities, since tourist travelers are likely to have higher
abso-lute values of both, and as such is consistent with both monopoly-type and competitive-type price discrimination.
The controls for airline and airport capacity utilization behave as predicted for measures of systematic variations in congestion costs. Increased variation in airport operations rates, reflected in SDCAP-APT, is consistently associated with increased price dispersion. A one-standard-deviation increase in SDCAPAPT from its mean raises the Gini coefficient by about 2 percent. Routes on which neither endpoint airport is congested (DUMAPT equal to one) average about 26 per-cent less price dispersion than routes on which at least one endpoint airport is congested, other things equa1.28 The variable SDCAPFLT,
which captures variations in airline fleet utilization rates, has a similar effect on dispersion in the constant elasticity models, where a one-standard-deviation increase in SDCAPFL T from its mean raises dis-persion by slightly less than 2 percent. Estimates of SDCAPFL T ef-fects in the linear models have the wrong sign and are quite imprecise.
Our measure of intraquarter fare variation, INQGINI, appears to capture differences in intertemporal price variation across markets, but its impact is quite small. Doubling INQGINI (about a one-standard-deviation increase) implies a 4-5 percent increase in GINI in the constant elasticity specifications. In the linear specifications, a one-percentage-point increase in INQGINI is associated with a 0.1-percentage-point increase in GIN!. This suggests that temporal varia-tion in published fares contributes to increased price dispersion in our data set, but temporal variation alone cannot account for the substantial amount of price dispersion we observe.
Overall, the pattern of results strongly suggests price discrimina-tion within airline markets, based in part on heterogeneity in cross-elasticities of demand, as well as dispersion due to peak-load pricing. This does not imply that either discrimination based on industry elas-ticities or dispersion attributable to other cost variations is absent. The regressions have significant nonzero constant terms and predict price dispersion even on monopoly routes. Moreover, since the re-gressions account for less than 20 percent of the variation, consider-able price dispersion remains to be explained by other factors.
The data also suggest that price dispersion may be affected by differences in carriers' abilities to execute sophisticated pricing poli-cies. The carrier effect estimates reveal substantial differences in the
28 This figure comes from calculating the effect of In SDCAP APT on price dispersion
at its average nonzero value and comparing it to the estimated decrease in dispersion when DUMAPT is equal to one (and, by construction, In SDCAPAPT is set equal to zero).
COMPETITION AND PRICE DISPERSION 675
TABLE 4
ESTIMATED CARRIER-SPECIFIC EFFECTS FROM TABLE 3 REGRESSIONS
(Dependent Variable: GINI; N = 1,020)
MODEL 1: MODEL 2:
PARSIMONIOUS MARKET STRUCTURE
Log-Log Linear Log-Log Linear
Owners of computer res-ervation systems:
Delta -.016 -.Oll -.020 -.Oll
(.037) (.006) (.037) (.006) Eastern -.075 -.016 -.088 -.019 (.039) (.006) (.039) (.006) TWA .244 .043 .262 .046 (.049) (.008) (.049) (.008) United -.135 -.024 -.138 -.024 (.037) (.006) (.037) (.006) Nonowners of computer reservation systems: Continental -.166 -.033 -.163 -.032 (.045) (.007) (.046) (.007) Northwest -.148 -.033 -.144 -.032 (.047) (.007) (.047) (.007) Piedmont .023 -.008 .014 -.Oll (.049) (.008) (.046) (.007) Republic -.1l6 -.026 -.1l0 -.026 (.047) (.007) (.047) (.008) USAir -.165 -.034 -.163 -.034 (.045) (.007) (.045) (.007) Western -.141 -.029 -.163 -.034 (.066) (.010) (.066) (.010)
NOTE.-All effects are estimated relative to American Airlines. Asymptotic standard errors are in parentheses.
average level of price dispersion across carriers, even after one con-trols for the specified population, product, and market characteris-tics. Table 4 reports these carrier fixed effects from each of the mod-els estimated in table 3. The coefficients measure each carrier's average price dispersion relative to American Airlines' average dis-persion. Notably, airlines that operated a computer reservation sys-tem (CRS) in 1986-American, Delta, Eastern, TWA, and United-generally exhibit a greater degree of price dispersion than carriers that did not operate CRSs. The difference between the average level of price dispersion for carriers that operated a CRS and the average for those that did not operate a CRS, other things equal, is statistically quite significant. The result is consistent with the claim that a CRS is complementary to utilization of sophisticated "yield management" techniques, that is, methods for allocating discount seats in a way that maximizes revenue on each flight.
676 JOURNAL OF POLITICAL ECONOMY VI. Conclusion
This study documents the existence of significant dispersion in the prices charged by individual firms within the largest direct service airline city-pair markets. The expected absolute fare difference be-tween two passengers on the same airline and route varies substan-tially: from a low of 3.6 percent of the mean fare on one carrier-route in our sample to a high of 83 percent of the mean fare on another. Dispersion also varies significantly across the 11 major carriers we studied: Western Airlines exhibited the least price dispersion, with expected absolute fare differences between two passengers averaging 29 percent of its mean fare in a market; TWA exhibited the most dispersion, with expected absolute fare differences averaging 45 per-cent of its mean fare in a market. On routes served by more than one carrier, the difference in average prices between firms is gener-ally much smaller than the average difference in prices paid by any two customers of the same airline.
We also describe the factors that influence the magnitude of price dispersion across carriers and markets. The data provide clear evi-dence that the level of a carrier's price dispersion within a market is related to the structure of the market. As the number of competitors in a market grows, with the total number of flights held constant, price dispersion increases. Greater frequency of flights on a route lowers price dispersion, and airport dominance by a carrier increases the dispersion of its prices on routes it serves from that airport. The latter result may be due to frequent-flyer plans, which tend to induce loyalty and enhance value most for the high-fare business travelers. On the most tourist-oriented routes, we find substantially less price dispersion than on other routes. Finally, airlines that owned com-puter reservation systems at the time of our sample demonstrated significantly more price dispersion than those that did not. These results are broadly consistent with a model of price discrimination in monopolistically competitive markets. The findings indicate that traditional monopoly theories of price discrimination may give nei-ther complete explanations nor accurate predictions of pricing pat-terns in monopolistically competitive markets.
Our analysis of airline price dispersion is not exhaustive. Although we control for price variation that results from predictable differ-ences in shadow values of aircraft and airport capacity, some other cost-based explanations of price dispersion, most notably peak-load pricing under stochastic demand, are not fully testable with these data. The basis relationships we observe, however, seem unlikely to be explained solely by cost variation. Our findings invite further em-pirical work to determine whether the relationships we find between
COMPETITION AND PRICE DISPERSION
price dispersion and market structure variables extend to other in-dustries and to test directly theories of stochastic peak-load pricing.
Appendix A
Data Description and Construction of Variables
We sketch below the construction of the data used in our analysis; a more detailed description of the data and estimation methods is archived with the data set in the Inter-University Consortium for Political and Social Research at the University of Michigan.
Price Data
Ticket and price data are taken from Databank lA (DBIA) of the Depart-ment of Transportation's Origin and Destination Survey for the second quar-ter of 1986, which is a 10 percent random sample of all tickets that originate in the United States on U.S. air carriers. Prices are measured as one-way fares; they are computed as one-half the reported fare for round-trip tickets. All tickets other than one-way and round-trips are excluded.
We made a number of further adjustments to the data following intensive examination of the DB lA data and discussions with Department of Trans-portation officials. We restrict the analysis to coach class direct or nonstop travel on routes for which the carrier reports fare information for at least 50 direct service passengers during the quarter. Tickets with reported fares of $10 or less are presumed to be frequent-flyer trips and excluded. Tickets with fares in excess of 3.5 times an imputed standard industry fare level (SIFL) for the route (4.0 times the SIFL for routes of 500 miles or less) are presumed to be keypunch errors and excluded. These criteria are similar to ones by Boeing in its internal processing of these data. We adjusted for incorrect airport code reporting by United Airlines for New York City.
Each observation in the sample is a unique carrier-route. A route is a pair of origin and destination airports. We restrict the analysis to routes in the 1,201 largest airport-pair markets on which more than 80 percent of the passengers traveled without a change of plane. For these markets, we calcu-late price dispersion measures for each of the 11 major U.S. domestic carriers at the time: American, Continental, Delta, Eastern, Northwest, Piedmont, Republic, TWA, United, Western, and USAir. The selection criteria leave us with a data set of 1,020 carrier-route observations on 521 routes.
Schedule Data
All flight information is based on the Official Airline Guide for May 15, 1986, the chronological midpoint of the second quarter.
Variable Descriptions