HAL Id: hal-00657813
https://hal.archives-ouvertes.fr/hal-00657813
Submitted on 9 Jan 2012
HAL is a multi-disciplinary open access
archive for the deposit and dissemination of
sci-entific research documents, whether they are
pub-lished or not. The documents may come from
teaching and research institutions in France or
abroad, or from public or private research centers.
L’archive ouverte pluridisciplinaire HAL, est
destinée au dépôt et à la diffusion de documents
scientifiques de niveau recherche, publiés ou non,
émanant des établissements d’enseignement et de
recherche français ou étrangers, des laboratoires
publics ou privés.
Effects of vocoding and intelligibility on the cerebral
response to speech.
Kuzma Strelnikov, Zoé Massida, Julien Rouger, Pascal Belin, Pascal Barone
To cite this version:
Kuzma Strelnikov, Zoé Massida, Julien Rouger, Pascal Belin, Pascal Barone. Effects of vocoding
and intelligibility on the cerebral response to speech.. BMC Neuroscience, BioMed Central, 2011, 12,
pp.122. �10.1186/1471-2202-12-122�. �hal-00657813�
R E S E A R C H A R T I C L E
Open Access
Effects of vocoding and intelligibility on the
cerebral response to speech
Kuzma Strelnikov
1,2,3*, Zoé Massida
1,2, Julien Rouger
4,5, Pascal Belin
4,6and Pascal Barone
1,2Abstract
Background: Degrading speech through an electronic synthesis technique called vocoding has been shown to affect cerebral processing of speech in several cortical areas. However, it is not clear whether the effects of speech degradation by vocoding are related to acoustical degradation or by the associated loss in intelligibility. Using vocoding and a parametric variation of the number of frequency bands used for the encoding, we investigated the effects of the degradation of auditory spectral content on cerebral processing of intelligible speech (words), unintelligible speech (words in a foreign language), and complex environmental sounds.
Results: Vocoding was found to decrease activity to a comparable degree for intelligible and unintelligible speech in most of the temporal lobe. Only the bilateral posterior temporal areas showed a significant interaction between vocoding and intelligibility, with a stronger vocoding-induced decrease in activity for intelligible speech.
Comparisons to responses elicited by environmental sounds showed that portions of the temporal voice areas (TVA) retained their greater responses to voice even under adverse listening conditions. The recruitment of specific networks in temporal regions during exposure to degraded speech follows a radial and anterior-posterior
topography compared to the networks recruited by exposure to speech that is not degraded.
Conclusions: Different brain networks are involved in vocoded sound processing of intelligible speech, unintelligible speech, and non-vocal sounds. The greatest differences are between speech and environmental sounds, which could be related to the distinctive temporal structure of speech sounds.
Keywords: speech, voice, environmental sounds, vocoder, brain
Background
In recent years, there has been an increasing number of studies that focused on the cerebral mechanisms of dis-torted speech processing [1-5]. These studies are war-ranted because distorted speech may constitute a model of complex speech comprehension, which is analogous to the complexity of imperfect real-life conditions. These studies should have clinical implications, because they serve to further elucidate the cerebral mechanisms of sound perception after cochlear implantations.
Modern cochlear implants (CI) allow deaf individuals to understand spoken speech and environmental sounds, and in some cases even to listen to music, although music per-ception usually remains poor [6-8]. However, auditory information delivered by the implant is spectrally degraded
[9,10] and lacks some of the fine structure that is impor-tant for speech comprehension [11,12]. This technical lim-itation of CI contributes to a period of adjustment during the first months after implantation, when perceived sounds remain largely indecipherable and hearing is poor. In contrast, high levels of speech comprehension can be achieved over the first year of using the neuroprostheses [13,14].
As only a few (16-20 at present) electrodes are inserted along the cochlea during CI implantations, the frequencies delivered by each electrode are averaged across frequency bands, which reduces the number of frequencies available to the subject. To model the impact of this reduced number of frequency bands on the perceptual and neuro-physiolo-gical responses to sound in normal listeners, an artificial distortion called vocoding can be used. Vocoding averages frequencies in a varying number of frequency bands by applying special temporal envelopes (e.g., half-wave rectifi-cation and envelope smoothing), while preserving most of
* Correspondence: [email protected]
1
Université de Toulouse, Université Paul Sabatier, Centre de Recherche Cerveau et Cognition, 31062 Toulouse, France
Full list of author information is available at the end of the article
© 2011 Strelnikov et al; licensee BioMed Central Ltd. This is an Open Access article distributed under the terms of the Creative Commons Attribution License (http://creativecommons.org/licenses/by/2.0), which permits unrestricted use, distribution, and reproduction in any medium, provided the original work is properly cited.
the slowly varying temporal cues. In other words, temporal and amplitude cues are preserved in each spectral band, but the spectral detail within each band is removed [9].
In normal subjects, voice discrimination and speech recognition with vocoded material improve as the number of vocoding channels is increased [9,15,16]. Variations of the number and spacing of frequency bands affects the brain in similar ways to changes in the number and place-ment of electrodes in CI. In a positron emission tomogra-phy (PET) study, Scott et al. [5] varied the number of vocoder channels between 1 to 16, thus increasing the level of intelligibility for the presented phrases. This voco-der-driven manipulation of intelligibility levels was found to correlate with bilateral brain activity in the superior temporal gyrus (STG) running lateral and anterior to the primary auditory cortex, with an additional peak in the left temporal pole. In a functional magnetic resonance imaging (fMRI) study of vocoded sentence perception, the number of vocoding channels was found to co-vary with cerebral activity in a large bilateral temporal cluster with peaks in the anterior superior temporal sulcus (STS), extending on the left side into the inferior frontal gyrus [4]. For isolated words, in contrast, the number of channels correlated with bilateral brain activity in the lateral STG, with a small bias to the right hemisphere [3].
These studies demonstrate a clear negative relationship along the bilateral STG between neuronal activity and the amount of vocoding-induced spectral degradation. These studies did not, however, dissociate the effects of vocod-ing-induced acoustical degradations and speech intellig-ibility decreases in these activity reductions, because they exclusively used stimuli composed of intelligible speech (IS).
Here, we attempt to dissociate the acoustical and intel-ligibility-related effects of vocoding on cerebral activity by comparing the effects of vocoding across intelligible speech (IS), unintelligible speech (US), and nonvocal envir-onmental sounds (ES). The stimuli were presented to the subjects while they were performing a 1-back task either in their natural form or following degradation through vocoding with 2, 4, 8, or 16 channels. We expected that vocoding-induced acoustical degradation would affect pro-cessing of all of the stimuli in a similar manner. In con-trast, we expected that vocoding-induced intelligibility losses would affect the processing of IS, but not of US or ES. Specifically, cerebral regions involved in intelligibility-related effects of vocoding were expected to show a signifi-cant Stimulus (IS, US) × Vocoding interaction.
A secondary goal of the present study was to ask whether the cerebral processing of different types of vocal information is differentially affected by vocoding, and whether the temporal voice areas (TVA) of auditory cortex preserve their sound-selectivity for voice after vocoding. Specifically, acoustical information that allows
discriminations to be made between vocal and nonvocal sounds is expected to be preserved even at vocoding levels that significantly impair speech comprehension, suggesting possible dissociations at both the behavioural and cerebral levels [16]. To examine these issues, we compared the effects of vocoding on voice discrimination (voice/non-voice classification) and IS comprehension (IS/US classification) tasks performed outside the scan-ner, and its effects on the differential response to vocal and non-vocal sounds in the TVA. Our results demon-strate that different brain networks are involved in vocoded sound processing of IS, US and ES.
Results
Behavioural results
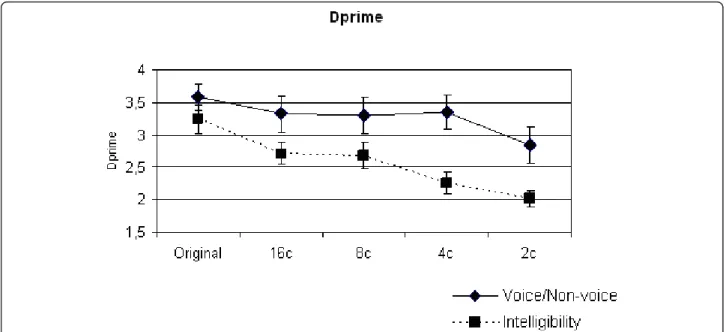
In both the Intelligibility and Voice Discrimination tasks, correct responses decreased with a decreasing number of vocoder channels (Figure 1). A two-way repeated-measures analysis of variance (ANOVA) with Task (Intelligibility, Voice Discrimination) and Degradation (no vocoding; vocoding using 16, 8, 4 or 2 channels) as factors showed a significant effect of Degradation on the performance of the subjects (F (4, 65) = 14.6, p < 0.001) (Figure 1). There was also a significant main effect of the type of Task F (1, 130) = 10.5, p < 0.01), and a significant interaction between Task and Degradation (F (4, 130) = 3.2, p < 0.05,). These data indicate that there was a greater vocoding-induced degradation of performance for the intelligibility task than for the Voice Discrimination task. Indeed, at intermediate levels of vocoding (4, 8 channels), voice versus non-voice discrimination performance remained close to normal levels whereas speech intelligibility was already markedly impaired (Figure 1).
fMRI results Effect of Category
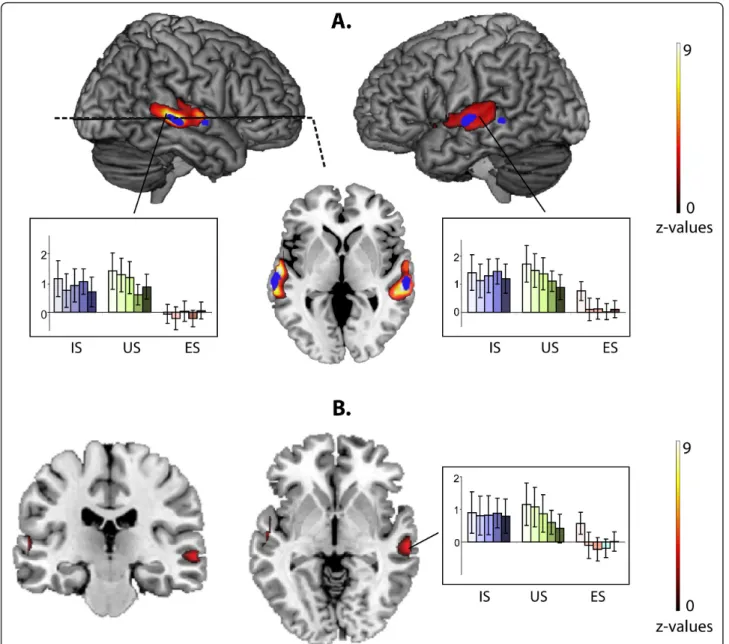
A significant main effect of Category in our 3×5 full fac-torial design was observed in the bilateral STS/STG (Figure 2A, Table 1).
As 80% of our stimuli were degraded stimuli, we deter-mined whether the Category effect was related to the dif-ferences between processing of degraded speech and degraded environmental sounds. We collapsed the beta values across the degrees of vocoding and compared brain activity in response to vocal sounds and to environmental sounds (IS+US vs. ES). The peaks were the same as those observed in the Category effect analysis (Table 2 Figure 2A). The same analysis (IS+US vs. ES) did not provide any significant results for the non-degraded stimuli, likely because of their small number in the paradigm. Planned comparisons revealed no difference between activity induced by IS versus US (p > 0.5, uncorrected). In other words, the greater responses to speech in these regions were not related to intelligibility.
Strelnikovet al. BMC Neuroscience 2011, 12:122 http://www.biomedcentral.com/1471-2202/12/122
Effect of Degradation
The linear approach used in the 3 × 5 full-factorial design did not detect brain areas sensitive to vocoder degrada-tion (p > 0.5). Therefore, using regression analysis, we determined the relationship between the logarithmic values of the number of channels (using a value of 64 channels for the natural stimuli) and brain activity. Using this model, we found a significant correlation between BOLD signals and the level of vocoder degradation in a large bilateral area of the STG/STS and in the cerebellum (Figure 3, Table 1).
Category × degradation interaction
No region showed a significant Category × Degradation interaction in the full factorial design, indicating similar effects of vocoder degradation on IS and US. As we had ana priori hypothesis that there would be a statistical interaction between degradation and intelligibility, we conducted a hypothesis-driven analysis of these interac-tions in a restricted number of regions that are involved in general speech and sound processing based on the“All effects of interest” contrast (used as a mask at p = 1e-07). A differential influence of vocoder degradation on IS, US, and ES was found bilaterally in the lateral superior tem-poral cortex and in the right cerebellum (Table 1 Figure 3B). In these regions, degradation-related deactivations were more pronounced for IS than for US or ES.
Mean degradation effect
As an alternative way to examine the effects of vocoder degradation, we compared the differences in brain activity between the degraded and natural stimuli. To examine
these“degraded vs. normal” differences, we pooled the effects of the degradation levels for each stimulus category.
When comparing the differences between“degraded vs.
natural” stimuli, we found that the reduction in activity in the right STS caused by vocoder degradation was smaller for IS and US than for ES (Table 2 Figure 2B). This result suggests that the TVA remains specifically sensitive to speech compared with non-vocal sounds, even when the stimuli are degraded. Though no significant interaction was found in the whole brain analysis between the main factors of Category and Degradation, collapsing across the levels of degradation revealed a group specific effect. Nota-bly, no difference in the similar“degraded vs. natural” ana-lysis was found between IS and US (p > 0.3, uncorrected).
Region of interest approach
We used brain regions issued from the TVA localizer and applied them to the IS and US images from the event-related part of the study. These functionally defined ROIs included the TVA along the bilateral STS and amygdala (Table 3). Using both linear and logarithmic approaches, no correlation with the vocoder degradation levels was found in the TVA areas (p > 0.1), suggesting that they were comparably responsive to normal and degraded speech.
Comparing activations from the TVA localizer and from the main effect of Category in the bilateral STS/ STG (Table 1), we found that the Euclidian peak-to-peak distance between clusters is 9.5 mm on the left and 6.7 mm on the right, which is greater than the 6 mm Gaus-sian kernel used for smoothing. However, at the same threshold (p < 0.05, family-wise error (FWE) corrected),
47% of the clusters on the right and 58% of the clusters on the left from the main Category effect overlapped with clusters from the TVA localizer (voice vs. environ-mental sounds).
Comparing activations from the TVA localizer with those from the regression with the levels of vocoder degradation (Table 1) in the bilateral STS/STG, we found that the Euclidian peak-to-peak distance between clusters is 17.5 mm on the left and 7.3 mm on the right, which is
greater than the 6 mm Gaussian kernel used for smooth-ing. At the same threshold (p < 0.05, FWE corrected), 16% of the clusters on the right and 3% of the clusters on the left from the regression analysis overlapped with clus-ters from the TVA localizer.
Thus, based on the TVA localizer, the areas for normal voice processing are spatially distinguishable from the areas correlated with vocoder degradation of speech. Spe-cifically, for the Category effect, there is approximately
Figure 2 Effect of stimulus Category. A. Main effect of stimulus category. Vocoder degraded speech (degraded IS and US) vs. vocoder degraded E (IS+US vs. 2E). The horizontal slice is at the coordinate z = -3 (p < 0.0001). IS-Intelligible Speech, US-Unintelligible Speech, ES-Environmental Sounds. In each group, the darker the color in the bar graphs of BOLD signal variation, the higher the level of vocoder degradation. In blue, areas from TVA localizer are presented at p < 0.05, FWE corrected. B. Degradation effect for speech vs. degradation effect for environmental sounds as defined by the expression (Speechdegraded-Speechnormal)-(Soundsdegraded-Soundsnormal). It can be algebraically
rewritten as (Soundsnormal-Soundsdegraded)-(Speechnormal-Speechdegraded). The latter formula makes clear that the difference between normal and
degraded stimuli in the right STS is smaller for speech compared with non-speech sounds. In each group, the darker the color in the bar graphs of BOLD signal variation, the higher the level of vocoder degradation.
Strelnikovet al. BMC Neuroscience 2011, 12:122 http://www.biomedcentral.com/1471-2202/12/122
50% overlap between TVA localizer and the degraded stimuli.
Discussion
We have used vocoded IS, US, and ES with different levels of vocoder degradation to differentiate the modula-tion of cortical activity by acoustical degradamodula-tion and a reduced speech intelligibility. Comparisons with environ-mental sounds suggest that certain brain areas retain their speech specificity even when the presented stimuli are degraded, probably due to the important temporal
structure of speech sounds [9,10,12]. We have been able to delineate a bilateral region in the posterior STG a region that plays a different role in processing vocoder degraded IS and US, suggesting that this region may be implicated in the increased computational efforts required to process linguistic information in difficult acoustical situations.
Vocoder degradation and speech processing
In the present study, the bilateral STG activations related to vocoder degradation confirm earlier findings for voco-der degraded words [3,5]. These STG activations are dif-ferent for speech compared to ES. In a large portion of the STG, vocoder degradation effects are probably related to speech-specific acoustic properties [9,10,12,17], which are present in IS and US. Obleser et. al. [3] reported the presence of areas where there is covariation between vocoder degradation and BOLD activity in bilateral STG/ STS regions, which overlap with areas found in the pre-sent study. As they used only words for stimulation, they could not clarify whether their observed effects were spe-cific to the lexico-semantic level of processing or whether it reflected increased demand of the complex acoustical analysis under the degraded acoustic conditions. Though there is no interaction between IS and US in our whole brain approach, significant interactions do exist in the bilateral posterior temporal areas and the cerebellum using regions of interest from the“All effects of interest” contrast (Table 1 Figure 3B). This temporal region, located outside the areas found by Obleser et al. (2008), shows a more marked degradation-related deactivation for IS than for unintelligible stimuli (US and ES) (Figure 3B). Such differential effects of IS and US in the posterior STG suggests that these regions are involved in proces-sing vocoder degradation of US and ES. The emergence of the additional neuronal support for the unintelligible sounds (US and ES) in adverse conditions is consistent with our findings that the negative effects of vocoder degradation on task performance were more marked for the linguistic Intelligibility task (US/IS) than for the Voice/Non-voice Discrimination task (Figure 1).
As mentioned in the Introduction, vocoder degradation is analogous to imperfect real-life conditions. As such,
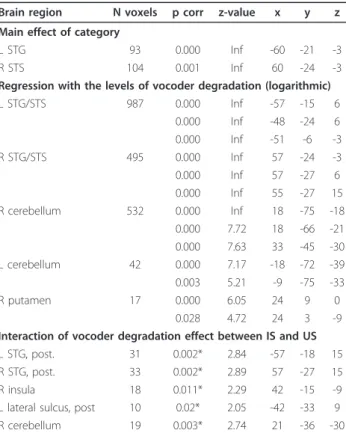
Table 1 Main effect of category, regression of BOLD signal variations with the levels of vocoder degradation and its interaction between IS and US
Brain region N voxels p corr z-value x y z Main effect of category
L STG 93 0.000 Inf -60 -21 -3
R STS 104 0.001 Inf 60 -24 -3
Regression with the levels of vocoder degradation (logarithmic) L STG/STS 987 0.000 Inf -57 -15 6 0.000 Inf -48 -24 6 0.000 Inf -51 -6 -3 R STG/STS 495 0.000 Inf 57 -24 -3 0.000 Inf 57 -27 6 0.000 Inf 55 -27 15 R cerebellum 532 0.000 Inf 18 -75 -18 0.000 7.72 18 -66 -21 0.000 7.63 33 -45 -30 L cerebellum 42 0.000 7.17 -18 -72 -39 0.003 5.21 -9 -75 -33 R putamen 17 0.000 6.05 24 9 0 0.028 4.72 24 3 -9 Interaction of vocoder degradation effect between IS and US L STG, post. 31 0.002* 2.84 -57 -18 15 R STG, post. 33 0.002* 2.89 57 -27 15 R insula 18 0.011* 2.29 42 -15 -9 L lateral sulcus, post 10 0.02* 2.05 -42 -33 9 R cerebellum 19 0.003* 2.74 21 -36 -30
Cluster size is indicated at the level of p = 0.05, FWE-corrected, p-values are indicated at voxel level. STS-superior temporal sulcus.
* uncorrected p-values from region of interest analysis using as regions of interest those of the“All effect of interest” contrast.
Table 2 Comparison of speech and non-speech
Brain region N voxels p corr z-value x y z
Vocoded speech (IS+US) > vocoded E
L STG 86 0.000 6.24 -60 -21 -3
R STS 99 0.000 6.08 57 -24 -3
Degradation effect for speech > degradation effect for E
R STS 43 0.005 5.11 57 -24 -6
By“speech” here, we mean the pooled effect of intelligible speech (IS) and unintelligible speech (US). Cluster size is indicated at the level of p = 0.0001, uncorrected. FWE-corrected p-values are indicated at voxel level, except for those significant only at cluster level, marked as (clust). STS-superior temporal sulcus, STG-superior temporal gyrus.
understanding the functional role of the speech degrada-tion-related network may lie in the perception of ecologi-cal noisy speech. Indeed, the study of word perception with babbling noises from multiple talkers [18] revealed that the same areas in the bilateral, posterior STG were more responsive to speech contained in noise than for isolated speech. However, this study did not demonstrate
whether this effect was specific for speech intelligibility or was a more general effect of differences between speech and non-speech sounds. Interestingly, they reported increased activity in this area in response to words in noise, which is contrary to the decreased response to vocoded words in the present study. This may indicate that the reported area is involved in
Figure 3 Effect of vocoder degradation on BOLD signal variation. A. General regression with vocoder degradation. Plots are presented for the peaks in the left and right temporal regions: L STG/STS at (-57 -15 6) and R STG/STS at (60 -24 -3), the horizontal slice at the coordinate z = -3 (p < 0.0001). IS-Intelligible Speech, US-Unintelligible Speech, ES-Environmental Sounds. In each group, the darker the color, the higher the level of vocoder degradation. The level of degradation in this analysis was transformed to the logarithmic scale being the logarithm of the inverse number of channels n: log(1/n). In each group, the darker the color in the bar graphs of BOLD signal variation, the higher the level of vocoder degradation. B. Interaction between Category and Degradation (factorial analysis of IS, US and ES, contrast weights restricted to IS and US) in the regions of interest from the“All effects” contrast. Plots are presented for the peaks in the left and right temporal regions: L STG at (-57-18 15) and R STG at (57-27 15), the horizontal slice at the coordinate z = 15. In each group, the darker the color in the bar graphs of BOLD signal variation, the higher the level of vocoder degradation.
Strelnikovet al. BMC Neuroscience 2011, 12:122 http://www.biomedcentral.com/1471-2202/12/122
extracting spectral information from speech in adverse conditions, which is preserved in noisy speech but is degraded by vocoding. The level of deciphering of this spectral information from vocoded sounds is sufficient for speech and sound recognition, but is insufficient for speech intelligibility. Following vocoder degradation, poorer recognition of speech intelligibility compared with voice/non-voice recognition was also confirmed by our behavioural data (Figure 1).
The results of the present study suggest that the correla-tions with vocoder degradation reported in previous stu-dies with only linguistic stimuli [3-5] cannot be attributed to linguistic processes, and areas in the temporal cortex and in the cerebellum are involved in speech intelligibility. Moreover, we found bilateral effects of vocoder degrada-tion on activity in the cerebellar hemispheres, a result not described in previous studies of vocoded speech proces-sing [3,5]. The cerebellum is involved in speech procesproces-sing [19], especially in difficult acoustical conditions such as noisy environments [18] and in patients with CI [20].
Vocoder degradation and temporal voice areas (TVA)
The analysis of the Main category effects for the degraded stimuli revealed cortical regions that exhibit approximately 50% overlap with voice-specific regions using more ecolo-gically-relevant voice stimuli from the TVA localizer. The locations of the peaks for the degraded speech stimuli were displaced compared to the peaks for the voice stimuli obtained from the voice localizer analysis. In general, there is only a weak and non-significant effect of speech degra-dation on peak activity in the TVA. However, because of overlap between the TVA and areas that are sensitive to vocoder degradation, the peripheral regions of the TVA showed greater involvement in the processing of degraded speech.
The spread of activity for degraded speech is radial from the normal TVA peaks with the most pronounced direc-tions along the anterior-posterior axis. We did not observe any effects of vocoder degradation at the peaks of the voice specific areas issued from the TVA-localizer. Moreover, these voice specific areas were spatially distinguishable
from those related to vocoder degradation. These results suggest that activity at the peaks of these TVA areas is not influenced by the high levels of vocoder degradation. A plausible explanation for this possibility is that peripheral activity in TVA-related networks deciphers voice informa-tion and transmits it to the regions involved in normal voice analysis.
In addition, global degradation effects were different between speech and ES in the right STS. Thus, this analy-sis revealed areas that are reanaly-sistant to degradation of speech in comparison with degradation of ES. It is possible that speech survives degradation better than non-speech sounds because the temporal cues contained in speech are relatively preserved following vocoder degradation (vocod-ing). In vocoding, a process that mimics the effects of a cochlear implant processor, global temporal information, i.e. the envelope, is preserved, while the fine spectral struc-ture is degraded [9]. Such differential effects makes speech less sensitive to degradation than non-speech sounds (see [16]). Whether intelligible or not, speech has a specific temporal structure [17], which makes it distinguishable from ES. It has been demonstrated that modulating broad-band noise with temporal envelopes extracted from speech does not prevent a subject from using only temporal cues to recognize a sound as speech [9]. Therefore, the distinc-tion between speech and non-speech sounds can be made based exclusively on temporal features. Retention of speech recognition at high levels of vocoder degradation may be explained by the preservation of speech-specific temporal structure in the speech stimuli.
In a study of degraded voice perceptions [21], the scrambled voices had the same amplitude values as those in the original signal (hence preserving the overall energy) but at different frequencies, which made these sounds totally unrecognizable as voices. Speech sounds elicited greater responses than their scrambled version in nearly all parts of auditory cortex including primary audi-tory cortex. In contrast, non-speech vocal sounds elicited greater responses than their scrambled version only in the middle and anterior portions of the right STS. Thus, it was suggested that the scrambling degradation techni-que has a relatively small effect on the activity of voice-specific neural networks compared to its effect on speech-specific networks. This result is in line with our presently presented data, where vocoder degradation had a small effect on speech-specific activity and on discrimi-nation scores, but had a larger effect on speech intellig-ibility as reflected by brain activity in the posterior STG and discrimination scores.
Conclusions
The brain networks involved in vocoded sound proces-sing are different when the stimuli are composed of IS, US, or ES. The recruitment of speech-specific networks
Table 3 Brain regions from the comparison of voice vs. environmental sounds in“TVA localizer”
Brain region N voxels p corr z-value x y z R STS middle 259 0.000 Inf 60 -30 0 R STS anterior 49 0.004 5.24 54 12 -21 L STS 113 0.000 6.07 -57 -30 -3 L STS 65 0.000 5.98 -57 -3 -12 R amygdale 55 0.002 5.38 21 -6 -15 L amygdale 31 0.000 5.84 -21 -6 -15
Cluster size is indicated at the level of p = 0.0001, uncorrected. FWE-corrected p-values are indicated at voxel level. STS-superior temporal sulcus, STG-superior temporal gyrus.
in the temporal regions when degraded speech is pre-sented follows a radial and anterior-posterior topography with regard to normal voice responses. This may be related to the processing of speech-specific temporal cues, which are relatively preserved by vocoder degradation.
Methods
Subjects
Fifteen English-speakers with normal hearing, 9 females (mean age 26, range 19-41) participated in the study. No participant reported having any auditory or neurological diseases, and they all had normal or corrected to normal vision. All of the subjects gave their full and informed con-sent prior to their participation in accordance with the Declaration of Helsinki (1968). The study was approved by the local research ethics committee of Glasgow University.
Stimuli
We used a 3 × 5 (Category × Degradation) full factorial design, with the stimulus categories IS (26 frequent Eng-lish words, with half spoken by a female voice), US (26 unfamiliar words in Finnish and Japanese, with half spoken by a female voice) and non-vocal ES (26 industrial sounds, non-living nature sounds, or bird and animal sounds). The vocoding levels were 2, 4, 8, and 16 channels and no vocoding (unchanged, original sounds). Each stimulus was presented in its original form plus 4 vocoder-degraded forms resulting in 26*5 = 130 presented items per cate-gory, for a total of 390 stimuli. The durations of the sti-muli were (mean ± standard deviation) IS: 740 ± 20 msec, US: 730 ± 100 msec, and ES: 740 ± 20 msec (no significant difference, p < 0.87, F(2, 75) = 0.14). The sound intensity was normalized for each stimulus by RMS power.
Behavioural testing
The behavioural part of the study was conducted in an fMRI simulator after the scanning session. The fMRI simulator reproduced the environment of the fMRI scan-ner, including the continuous scanning noises. In two tasks in a counterbalanced order, the subjects were pre-sented the same stimuli with the same levels of degrada-tion as in the scanner. In the Intelligibility task, subjects were asked to distinguish between IS and US, i.e., to decide whether the heard voice was speaking an intelligi-ble English word or not. In the Voice Discrimination task, subjects were presented with US and ES stimuli and asked to decide whether the sound was a voice or not. In both tasks, the stimuli were presented in a pseudo-ran-dom order, and the subjects indicated their responses using a computer mouse.
fMRI scanning
In the main functional run, stimuli corresponding to the 3 categories × 5 degradation levels were presented in a pseudo-random order with 20% of the presented stimuli
consisting of randomly occurring null-events. For each stimulus category, 26 (13 male and 13 female voice) sti-muli were randomly played (ISI = 4 sec, stisti-muli duration 0.7 ± 0.1 (SD) sec). The subjects were instructed to press a button when they heard a repetition (1-back task). There were no other repetitions in the stimuli presentation. Except for this “orthogonal” task, there were no other stimuli repetitions.
In the“TVA localizer” [22] part of the study, stimulus blocks of 8 sec were presented in an efficiency-optimized order, consisting of human vocalizations (speech and non-speech) or non-vocal ES (the stimuli are available at http://vnl.psy.gla.ac.uk/resources_main.php), intermixed in 33% of the noiseless blocks. The subjects were instructed to listen attentively and passively.
For both fMRI scans, the auditory stimuli were pre-sented binaurally through pneumatic headphones, sealed by foam ear inserts, and further shielded by plastic ear defenders (providing an attenuation of fMRI scanning noise of about 30 dB), with a sound-pressure level of 85-90 dB.
Imaging details
Scanning was performed in a 3T MRI system (Siemens) at the Neuroimaging centre of Glasgow University. Func-tional scans were acquired with a single-shot echo planar gradient-echo (EPI) pulse sequence (TR = 2 s, TP = 30 ms, flip angle = 77°, FOV = 215 mm, matrix = 64 × 64). The 32 axial slices (resolution 3.75 × 3.75 mm in-plane, 5-mm thickness) in each volume were aligned to the AC-PC line, covering the whole brain. A total of 498 volumes per subject were acquired after T1 saturation for the event-related part of the study and 310 volumes for the“TVA localizer” part. Scanner noise was continuous throughout the experiment. After the functional scans, T1-weighted anatomical images were obtained for each participant (1 × 1 × 1 mm resolution).
Image processing and analysis
Image processing and statistical analysis were performed using SPM5. The imaging time series was realigned to the first volume to correct for interscan movement. To account for differences in sampling time of different slices, the voxel time series were interpolated using 4th degree b-spline interpolation and re-sampled using the 1st slice at the anterior-posterior commissural line as the reference. A T1-weighted anatomical MRI (1 mm×1 mm×1.5 mm voxel slice) was obtained for each subject, co-registered with the mean realigned functional image and normalised using the parameters determined for the functional images. A mean anatomical image was created from the subjects’ individual scans, onto which activa-tions were overlaid for anatomical localisation. Finally, the functional images were spatially normalised to a
Strelnikovet al. BMC Neuroscience 2011, 12:122 http://www.biomedcentral.com/1471-2202/12/122
standard MNI space to allow for group analysis. Func-tional data were smoothed using a 6 mm full-width at half maximum (FWHM) isotropic Gaussian kernel. The data were analysed by modelling the evoked hemody-namic responses with canonical hemodyhemody-namic response functions for the fixed-effects general lineal model per subject.
In the event-related part of the study, 15 contrasts per subject were created. For each of the 3 categories of sti-muli, 5 contrasts were created (4 levels of vocoder degra-dation and the natural sound relative to the baseline). These contrasts were used at the group-level in a ran-dom-effect analysis using a full 3 × 5 (Category × Degra-dation) factorial design. The “All effects of interest” contrast (used as a mask at p = 1e-07) served for the hypothesis-driven analysis of IS and US interaction in the flexible factorial design with IS, US and ES stimuli; con-trast weights were restricted to IS and US stimuli. In the TVA -localizer part of the study, for each subject, the voice and non-voice contrasts were created. For the 2nd level analysis, these contrasts were compared for the group using a one-sample t-test. Brain areas showing sig-nificant activity differences in the“voice vs. non-voice” contrasts (the TVA) were used as regions of interest in the full factorial analysis of the event-related design using the MarsBaR toolbox.
The FWE corrected value of p < 0.05 was used for the whole-brain analysis in both parts of the study.
Acknowledgements and Funding
ANR Hearing Loss (ANR-06-Neuro-021-04) (P. Barone) Cifre Convention (Cochlear France SAS-ANRT N°979/2006) (ZM) API2009 PHRC interrégional CHU Purpan (KS)
Fondation pour la Recherche Médicale (JR) BBSRC BB/E003958/1 (P. Belin)
Author details
1Université de Toulouse, Université Paul Sabatier, Centre de Recherche
Cerveau et Cognition, 31062 Toulouse, France.2CNRS, UMR 5549. Hôpital
Purpan, Toulouse, France.3CHU Purpan, Toulouse, France.4Centre for Cognitive NeuroImaging (CCNi) & Institute of Neuroscience and Psychology, University of Glasgow, Glasgow, UK.5Brain Innovation B.V., Maastricht, the Netherlands.6International Laboratories for Brain, Music and Sound,
Université de Montréal & McGill University, Montreal, Quebec, Canada. Authors’ contributions
KS planned the experiment, conducted the study, analysed the fMRI data of vocoder degradation and wrote the article. ZM analysed the behavioural data and fMRI data of the voice localizer. JR prepared the stimulation programs and conducted the study. P. Belin planned the experiment, analysed the fMRI data of vocoder degradation, and wrote the article. P. Barone planned the experiment and wrote the article. All authors read and approved the final manuscript.
Received: 15 July 2011 Accepted: 30 November 2011 Published: 30 November 2011
References
1. Scott SK, Blank CC, Rosen S, Wise RJ: Identification of a pathway for intelligible speech in the left temporal lobe. Brain 2000, 123(Pt 12):2400-2406.
2. Narain C, Scott SK, Wise RJ, Rosen S, Leff A, Iversen SD, Matthews PM: Defining a left-lateralized response specific to intelligible speech using fMRI. Cereb Cortex 2003, 13(12):1362-1368.
3. Obleser J, Eisner F, Kotz SA: Bilateral speech comprehension reflects differential sensitivity to spectral and temporal features. J Neurosci 2008, 28(32):8116-8123.
4. Obleser J, Wise RJ, Alex Dresner M, Scott SK: Functional integration across brain regions improves speech perception under adverse listening conditions. J Neurosci 2007, 27(9):2283-2289.
5. Scott SK, Rosen S, Lang H, Wise RJ: Neural correlates of intelligibility in speech investigated with noise vocoded speech–a positron emission tomography study. J Acoust Soc Am 2006, 120(2):1075-1083.
6. Drennan WR, Rubinstein JT: Music perception in cochlear implant users and its relationship with psychophysical capabilities. J Rehabil Res Dev 2008, 45(5):779-789.
7. Pressnitzer D, Bestel J, Fraysse B: Music to electric ears: pitch and timbre perception by cochlear implant patients. Ann N Y Acad Sci 2005, 1060:343-345.
8. Cooper WB, Tobey E, Loizou PC: Music perception by cochlear implant and normal hearing listeners as measured by the Montreal Battery for Evaluation of Amusia. Ear Hear 2008, 29(4):618-626.
9. Shannon RV, Zeng FG, Kamath V, Wygonski J, Ekelid M: Speech recognition with primarily temporal cues. Science 1995, 270(5234):303-304.
10. Zeng FG, Nie K, Stickney GS, Kong YY, Vongphoe M, Bhargave A, Wei C, Cao K: Speech recognition with amplitude and frequency modulations. Proc Natl Acad Sci USA 2005, 102(7):2293-2298.
11. Friesen LM, Shannon RV, Baskent D, Wang X: Speech recognition in noise as a function of the number of spectral channels: comparison of acoustic hearing and cochlear implants. J Acoust Soc Am 2001, 110(2):1150-1163.
12. Lorenzi C, Gilbert G, Carn H, Garnier S, Moore BC: Speech perception problems of the hearing impaired reflect inability to use temporal fine structure. Proc Natl Acad Sci USA 2006, 103(49):18866-18869.
13. Tyler RS, Parkinson AJ, Woodworth GG, Lowder MW, Gantz BJ: Performance over time of adult patients using the Ineraid or Nucleus cochlear implant. Journal of Acoustical Society of America 1997, 102(1):508-522. 14. Rouger J, Lagleyre S, Fraysse B, Deneve S, Deguine O, Barone P: Evidence
that cochlear-implanted deaf patients are better multisensory integrators. Proc Natl Acad Sci USA 2007, 104(17):7295-7300.
15. Fu QJ, Chinchilla S, Galvin JJ: The role of spectral and temporal cues in voice gender discrimination by normal-hearing listeners and cochlear implant users. J Assoc Res Otolaryngol 2004, 5(3):253-260.
16. Massida Z, Belin P, James C, Rouger J, Fraysse B, Barone P, Deguine O: Voice discrimination in cochlear-implanted deaf subjects. Hear Res 2011, 275(1-2):120-129.
17. Chandrasekaran C, Trubanova A, Stillittano S, Caplier A, Ghazanfar AA: The natural statistics of audiovisual speech. PLoS Comput Biol 2009, 5(7): e1000436.
18. Wong PC, Uppunda AK, Parrish TB, Dhar S: Cortical mechanisms of speech perception in noise. J Speech Lang Hear Res 2008, 51(4):1026-1041. 19. Ackermann H: Cerebellar contributions to speech production and speech
perception: psycholinguistic and neurobiological perspectives. Trends Neurosci 2008, 31(6):265-272.
20. Giraud AL, Truy E, Frackowiak RS, Gregoire MC, Pujol JF, Collet L: Differential recruitment of the speech processing system in healthy subjects and rehabilitated cochlear implant patients. Brain 2000, 123(Pt 7):1391-1402.
21. Belin P, Zatorre RJ, Ahad P: Human temporal-lobe response to vocal sounds. Brain Res Cogn Brain Res 2002, 13(1):17-26.
22. Belin P, Zatorre RJ, Lafaille P, Ahad P, Pike B: Voice-selective areas in human auditory cortex. Nature 2000, 403(6767):309-312.
doi:10.1186/1471-2202-12-122
Cite this article as: Strelnikov et al.: Effects of vocoding and intelligibility on the cerebral response to speech. BMC Neuroscience 2011 12:122.