HAL Id: hal-01820512
https://hal.archives-ouvertes.fr/hal-01820512
Submitted on 21 Jun 2018HAL is a multi-disciplinary open access
archive for the deposit and dissemination of sci-entific research documents, whether they are pub-lished or not. The documents may come from teaching and research institutions in France or abroad, or from public or private research centers.
L’archive ouverte pluridisciplinaire HAL, est destinée au dépôt et à la diffusion de documents scientifiques de niveau recherche, publiés ou non, émanant des établissements d’enseignement et de recherche français ou étrangers, des laboratoires publics ou privés.
Computational Filterability and dewatering
determination based on shape and size distribution of
solid suspensions
Danièle Bourcier, J.P Féraud, D. Ode, D Colson, François Puel
To cite this version:
Danièle Bourcier, J.P Féraud, D. Ode, D Colson, François Puel. Computational Filterability and dewatering determination based on shape and size distribution of solid suspensions. 12th World Filtration Congress (WFC12), Apr 2016, Taipei, Taiwan. �hal-01820512�
To cite this article: D. BOURVIER, J.P. FERAUD, D. ODE, D. COLSON, F. PUEL (2016) Computational Filterability and dewatering determination based on shape and size distribution of solid suspensions World Filtration Congress WFC12, 11-15 April, Taipei, Taiwan
Computational Filterability and dewatering determination based on shape and size
distribution of solid suspensions
D. Bourcier a,d, J.P. Féraud a, D. Ode a, D.Colson b, F. Puel c
a CEA, DEN, DTEC, SGCS, LGCI, BP 17171, 30207 Bagnols-sur-Cèze, France
b Université de Lyon F-69622, Lyon, France ; Université Lyon 1; Villeurbanne ; CNRS, UMR5007,
Laboratoire d'Automatique et de Génie des Procédés (LAGEP), CPE-Lyon, 43 bd du 11 Novembre 1918, 69100 Villeurbanne, France
c Université Paris Saclay, Centrale Supélec, Laboratoire de Génie des Procédés et Matériaux
(LGPM), EA 4038, Grande Voie des Vignes, 92290 Châtenay-Malabry, France
dFlowerSep, Village Entreprises Lasserre, 47310 Estillac, France
ABSTRACT
Dewatering after filtration is an important issue, as it determines the transferability and the final cost of dewatering for the product. Any optimization in the dewatering step will improve the process. This paper shows the effect of particle properties such as shape factor and size distribution on dewatering efficiency. An experimental plan was established to show the influence of the working pressures (filtration and dewatering pressures) on residual moisture and dewatering time. This plan was repeated on four calcium carbonate particle shapes: needles, plates, spheres, and cubes. The first data from these experiments showed that the volume shape factor of the particle has no effect on cake behavior during dewatering. The same-shaped iso-response curves of residual moisture as a function of the filtration pressure and the dewatering pressure were obtained for each particle shape. It was also shown that raising the dewatering pressure can in fact lead to a wetter cake if this pressure is higher than the cake filtration pressure. This fact points out a counterproductive phenomenon that the industrial operator has to avoid.
The experimental considerations were compared to a model for dewatering based on work by Tarleton and Wakeman combined with a specially-developed filtration model. This combination enabled the computation of cake resistance and compressibility, as well as cake dewatering behavior, using easily measurable parameters. It can serve the industrial process in the choice of the appropriate liquid-solid separation device, and provide information as to the pressure conditions necessary to obtain the wettest cake possible for a time-fixed dewatering or to see if a wet target can be reached and in how much time.
KEYWORDS
Deliquoring, Pressure Filtration, Modeling, Solid-liquid-separation, Suspension
1. Introduction
The deliquoring helps to cut down the costs of drying and improves the transferability of the cake between the different steps of the process. Knowing the optimal deliquoring pressure will also improve the productivity of the process and increase the profits of an industrial application.
The residual moisture after filtration has to be linked with particle properties such as Particle size Distribution or shape factor.
This paper aims at studying the variation of the behavior of the cake during deliquoring as a function of the shape factor. A model for dewatering based on work by Tarleton and Wakeman (2007) combined with a specially-developed filtration model will also be presented. This combination enabled the computation of cake resistance and compressibility, as well as cake dewatering behavior, using easily measurable parameters.
2. Simulation procedure
The simulation of deliquoring is based on work by Tarleton and Wakeman (2007). The first step is to consider Darcy’s law combined with Ergun’s equation (Equation 1):
𝑘 = 1
𝛼𝜌 (1 − 𝜀)=
𝜀 𝐷
180(1 − 𝜀) (1)
Thanks to equation 1, the effective particle diameter can be calculated: 𝐷 = 180(1 − 𝜀)
𝛼𝜌 𝜀 = 13.4
(1 − 𝜀)
𝛼𝜌 𝜀 (2)
Wakeman proposes a correlation to calculate the irreducible saturation thanks to this effective diameter and a calculation of the capillary number (Equation 3 and 4):
𝐶𝑎 =𝜀 𝐷 (𝜌 𝑔𝐿 + ∆𝑃)
(1 − 𝜀) 𝐿𝜎 (3)
𝑆∝= 0.155(1 + 0.031𝐶𝑎 . ) (4)
If the objective is to calculate the residual moisture obtained in a cake after a fixed time and pressure of deliquoring, the dimensionless time and pressure are calculated:
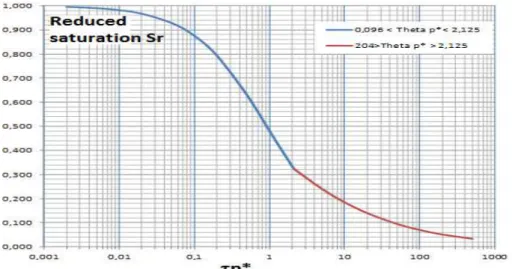
𝜏 = 𝑘𝑝 𝜇𝜀(1 − 𝑆 )𝐿 𝑡 (5) 𝑝∗ = ∆𝑃 𝑝 (6) The product 𝜏𝑝∗ can be linked with the reduced saturation thanks to an experimental curve.
Figure 1: Correlation between reduced saturation and the product of the time and pressure adimensional
The reduced saturation is obtained and the saturation S calculated. This saturation gives access to the residual moisture in the cake:
𝑆 =𝑆 − 𝑆 1 − 𝑆 (7) 𝑆 = (1 − 𝜀) 𝜀 𝜌 𝜌 𝐻 1 − 𝐻 (8)
If the residual moisture is the target and the deliquoring time needed is wanted, the calculation can be done by calculating Sr, having the product 𝜏𝑝∗ thanks to the curve and calculating the deliquoring time td.
3. Experimental considerations
A study of the influence of the particle shape on cake deliquoring is proposed thanks to multiple synthesis of calcium carbonate. Four shapes were obtained: spheres, cubes, platelets and needles.
The values of cake residual moisture as a function of filtration and deliquoring pressure were measured. For instance, Figure 2 presents the iso-responses curves for calcium carbonate spheres.
Figure 2: Isoresponses curves of residual moisture as a function of deliquoring and filtration pressure
The table 1 summarizes the results for each shape.
Table 1: Experimental results of residual moisture measurements
Shape Deliquoring Pressure Filtration Pressure
1 3 5 Spheres 1 23.3 24.0 24.6 3 18.8 19.8 20.3 5 9.0 9.7 10.1 Cubes 1 21.0 25.7 31.4 3 14.8 19.3 25.1 5 9.0 14.5 18.4 Platelets 1 34.3 38.2 43.0 3 32.8 36.8 40.2 5 30.2 34.7 39.1 Needles 1 12.0 21.6 32.0 3 8.4 18.1 27.9 5 6.2 15.6 24.3
For each shape, a linear polynomial regression is proposed:
𝐻 = 𝑎 + 𝑎 𝑋 + 𝑎 𝑋 (9)
where X1 stands for the centered variable for deliquoring pressure and X2 for the centered variable for filtration pressure.
Table 2: Polynomial coefficients for each shape
Shape Shape factor a0 a1 a2 a1+a2
Spheres 0.92 17.74 -3.6 0.33 -3.27
Cubes 0.81 19.91 -3.02 2.51 -0.51
Platelets 0.3 36.59 -0.96 2.08 1.12
Needles 0.17 18.46 -1.63 4.80 3.17
An analysis of the coefficients shows that the influence of deliquoring pressure is more important for shapes close to the sphere and that the influence of filtration pressure is more important for shapes far from the sphere.
4. Comparison experiments/modeling
The model presented in section 2 and the experiments presented in section 3 were compared in figure 3.
Figure 3: Comparison modelling-experiments for calcium carbonate spheres
The surface represents the difference between the modeled results and the experiments. The correlation is good and better at low pressure.
5. Conclusion
The correlation between the model and the experiments is good. The effect of the shape on deliquoring has to be taken into account. This comparison gives the industrial a great tool to adapt the filtration and deliquoring pressures to the product needed, in order to improve the productivity and the dryness of the solid at the end of the separation process. The optimal pressures can be found with the Filtration Performance Test by FlowerSEP.