HAL Id: insu-03112848
https://hal-insu.archives-ouvertes.fr/insu-03112848
Submitted on 6 Feb 2021
HAL is a multi-disciplinary open access
archive for the deposit and dissemination of
sci-entific research documents, whether they are
pub-lished or not. The documents may come from
teaching and research institutions in France or
abroad, or from public or private research centers.
L’archive ouverte pluridisciplinaire HAL, est
destinée au dépôt et à la diffusion de documents
scientifiques de niveau recherche, publiés ou non,
émanant des établissements d’enseignement et de
recherche français ou étrangers, des laboratoires
publics ou privés.
Accuracy and precision of cryogenic limb array etalon
spectrometer (CLAES) temperature retrievals
John Gille, Paul Bailey, Steven Massie, Lawrence Lyjak, David Edwards,
Aidan Roche, John Kumer, John Mergenthaler, Michael Gross, Alain
Hauchecorne, et al.
To cite this version:
John Gille, Paul Bailey, Steven Massie, Lawrence Lyjak, David Edwards, et al.. Accuracy and
precision of cryogenic limb array etalon spectrometer (CLAES) temperature retrievals. Journal of
Geophysical Research: Atmospheres, American Geophysical Union, 1996, 101 (D6), pp.9583-9601.
�10.1029/96JD00052�. �insu-03112848�
JOURNAL OF GEOPHYSICAL RESEARCH, VOL. 101, NO. D6, PAGES 9583-9601, APRIL 30, 1996
Accuracy and precision of cryogenic limb array etaIon
spectrometer
(CLAES) temperature retrievals
John C. Gille, l Paul L. Bailey, l Steven T. Massie, l Lawrence V. Lyjak, l David P.
Edwards, l Aidan E. Roche,2 John B. Kumer,2 John L. Mergenthaler,2 Michael R.
Gross,3
Alain Hauchecorne,4
Phillip
Keckhut,4,5
Thomas
J. McGee,6
Ian S.
McDermid,7 Alvin J. Miller,5 and Upendra Singh3
Abstract. The Cryogenic Limb Array Etalon Spectrometer (CLAES) measured emission from
the 792 cm-• Q branch of CO2, from which temperature distributions in the stratosphere and low
mesosphere were derived. Here we briefly review the measurement technique, concentrating on
aspects that affect the temperature determination. Comparison of many pairs of retrievals at the
same location (near 32øN or 32øS) measured on sequential orbits (time separation of 96 min)
shows a precision ranging from approximately 0.8 K at 68 mbar to about 3.5 K at 0.2 mbar,
which agrees with simulations incorporating random noise and short-period spacecraft motions.
Comparisons of globally analyzed CLAES data with National Meteorological Center (NMC) and
U.K. Meteorological Office (UKMO) analyses show general agreement, with CLAES tending to
be cooler by about 2 K, except in the tropics and high-latitude winter conditions. This is sup-
ported
by comparisons
with individual
radiosondes
and several
lidars that indicate
that the
agreement is within 2 K throughout the profile (except for a narrow layer around 3 mbar). An
error analysis also indicates that systematic errors should be roughly 2 K, independent of alti-
tude. The systematic differences at low latitudes appear to be due to tropical waves, which have
vertical wavelengths too short to be seen by the TIROS Operational Vertical Sounder (TOVS)
instruments. There are no correlative rocketsondes or lidars to help resolve the reasons for the
high-latitude differences. Comparisons with other Upper Atmosphere Research Satellite (UARS)
data should shed additional light on this question.
1. Introduction
The Cryogenic Limb Array Etalon Spectrometer (CLAES) was launched on the NASA Upper Atmosphere Research Satellite (UARS)on September 12, 1991, and began measure- ments of the infrared radiation emerging from the atmospheric limb, or horizon, on October 1, 1991. The observed data included measurements of the radiation emitted by the 792 cm-l Q branch of CO 2 as a function of relative altitude, from which the atmospheric temperature has been determined. The stored cryogen capacity of CLAES was designed to allow an 18-month lifetime on orbit. It actually operated for 19 months, acquiring 470 days of data, of which 388 (between January 9, 1992, and May 5, 1993) have been processed to date using version 7 (V7)data processing software. (Data acquired prior to January 9 measured slightly different wavelengths and will require a modified algorithm.) A V7 day file contains approximately 1200 altitude profiles each of temperature, aerosol extinction coefficient, and the mixing ratios of 11 species.
INational Center for Atmospheric Research, Boulder, Colorado. 2Lockheed Palo Alto Research Laboratory, Palo Alto, Califomia. 3Hughes STX Corporation, Lanham, Maryland.
4Service d'Adronomic du CNRS, Vdrricrcs-Le Buisson, France. 5Climate Analysis Center, NMC/NWS/NOAA, Washington, D.C. 6NASA Goddard Space Flight Center, Greenbelt, Maryland. 7Jet Propulsion Laboratory, California Institute of Technology,
Pasadena.
Copyright 1996 by the American Geophysical Union. Paper number 96JD00052.
0148-0227/96/96JD-00052505.00
This paper is concerned with the assessment of the quality of the CLAES-retrieved temperatures through error analysis,
analysis of the data fields, and their comparison with correla-
tive data. We give here a summary of those instrument design
and operational characteristics most relevant to this assess-
ment. Details of the instrument design and on-orbit perform- ance can be found in the work of Roche et al. [1993], hereinafter referred to as R93, and a discussion of the UARS
mission is given by Reber[1993] and Reber et al. [1993].
Temperature is the principal quantity defining the state of the atmosphere, determining its vertical structure. From a knowledge of the atmospheric temperature distribution, along with the pressure at one level, one may compute the distribu- tion of atmospheric density and the pressure at all levels. From the pressure distribution, one can further calculate a good estimate of the extratropical winds.
In addition to its importance as a thermodynamic and
dynamic variable, the temperature must also be known to
invert the other radiance measurements in order to recover the
vertical distributions of aerosols and trace gases. Clearly the
importance of atmospheric temperature requires that the
characteristics of the CLAES temperature determinations be accurately known.
2. CLAES Temperature Determination
2.1. Observational Technique
CLAES is a limb-viewing spectrometer, simultaneously observing infrared emission from the atmosphere with a
vertical linear array of 20 abutting detectors, each subtending 2.5 km vertical height at the limb, viewing tangent altitudes
nominally between 10 and 60 km. CLAES views in a direc-
9584 GILLE ET AL.' CLAES TEMPERATURE ACCURACY AND PRECISION
tion perpendicular to the UARS velocity vector, from the side of the spacecraft opposite to the solar array (the "cold side"). As the UARS orbit precesses, it is necessary to rotate the spacecraft about the yaw axis approximately every 36 days to keep the solar panels pointing toward the Sun. This yaw- around of UARS means that CLAES alternately observes from 34øN to 80øS or from 34øS to 80øN, depending on the orienta- tion of UARS. Because it measures thermal emission, data may be obtained at all local times, day and night, i.e., irrespective of whether the observed atmosphere is sunlit or dark. Each observed latitude is sampled about 15 times per day from the ascending (south to north) part of the orbit and likewise from the descending part of the orbit. Combining the observations from the two parts of the orbit over the 36-day yaw period provides coverage of a large fraction of the diurnal cycle at a given latitude.
To prolong the life of the stored cryogens, the instrument aperture door was closed for approximately 5 days around the time of each spacecraft yaw. The telescope door carries on its inside surface a blackbody calibration source which was used for end-to-end radiometric calibration during the yaw- maneuver door closings. The door was also closed for 1 to 2 days halfway between the yaws (roughly every 2 weeks) for additional radiometric calibration.
While viewing the atmosphere, CLAES was operated for the most part (-- 94% of the time) in the nominal science mode (designated mode 1). In this mode, Earth-limb radiance data
were obtained by sequentially positioning each of the nine
blocker filters in the beam to isolate spectral regions a few
inverse centimeters wide and spectrally scanning these
regions by tilting an etalon in the beam (see R93 for details).
These data allow retrieval of the entire CLAES species set,
including temperature, 03, C1ONO2, HNO3, CFC-11, CFC-12,
N205, N20, CH 4, NO 2, H20, NO, and aerosol. Data were ob- tained with a UARS standard 65-s repeat time, corresponding to about 500 km along the ground track. A given blocker was
in place an average of about 7.2 s. Because the blocker width
was roughly 20 to 30 times the full width at half maximum
(FWHM) of the etalon [,lames et al., 1988], there was not
enough time for a continuous scan through the entire blocker region at etalon resolution. Instead, for each blocker region, the etalon was driven sequentially to a set of tilt angles that provided high-resolution measurements in a subset of frequen- cies, i.e., channels, selected to optimize information content for retrieval purposes. Typically, some of these channels would include the line centers of species to be retrieved and some would be located between lines in order to simultaneously retrieve aerosols or other continuum-emitting species. 2.2. Temperature and Pressure Determination
As a limb-viewing infrared spectrometer, CLAES tempera-
ture retrievals rely on the principles described by Gille and House [1971] (hereinafter referred to as GH), and used by sev- eral subsequent infrared limb scanners. For a gas with a known distribution, such as CO 2, the infrared emission at a given altitude depends on the temperature and density at that altitude. The transmittance between that level and space depends on the density of the absorber and its temperature. The density at any level depends, through the hydrostatic equation, on the temperature distribution between the level in question and a reference level at which the pressure is known. Thus the temperature distribution and the pressure at a single
known level are sufficient to determine the outgoing radiance profile.
Conversely, to retrieve the temperature, measurements of a radiance profile and knowledge of a single reference pressure are sufficient to determine the temperature distribution, as noted by GH (although more emphasis was placed there on the use of two radiometric channels to determine the temperature and the pressure simultaneously).
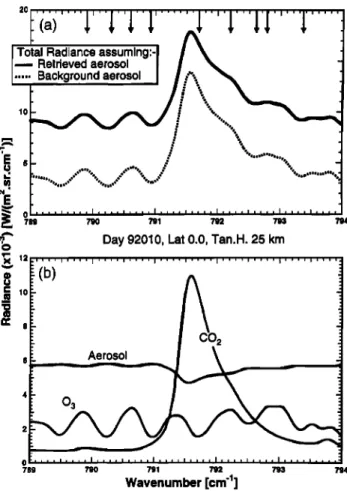
CLAES blocker filter 8 was selected to isolate a spectral region about 4 cm-] wide centered near the CO2 Q branch at approximately 792 cm-] for temperature retrieval. Figure 1 shows a calculated spectrum of atmospheric radiance at an altitude of 25 km in the blocker-8 region as it would be measured by CLAES. This can be done by tilting the etalon in a smooth motion to scan its passband continuously across the spectral region passed by the blocker-8 filter. The large peak, at 791.7 cm -• is the Q branch of the second hot band of the
CO2 principle isotope (626)v2 system, often designated
(11101-10002), which is used in the temperature determinations discussed here. The CO2 feature is the strongest in this blocker region. The weaker features at lower frequencies are ozone lines. (The small features in the aerosol signal are due to absorption of aerosol emission by the gases.) Because of the instrument finite field of view the FWHM of the
[Total
Radiance
assuming:-]
•
i
I
"'"
•' BRaetc•:;
rvOeudn•e•srg
IsO
' [ /;.
•'•.._'
•
-
, i , , i • I , • i i i , , , , I , , , i , , ,
78•
7•
701
792
•
794
Day 92010, Lat 0.0, Tan. H. 25 km
Aerosol
4
o
769 790 791 792 793 794
Wavenumber [cm 4]
Figure 1. Calculated radiance spectra at 25 km altitude over the equator for January 10, 1992. (a)Solid line shows calcu- lated total signal, using the retrieved amount of aerosol, com- pared with the same calculation with background aerosol (dotted line). Arrows indicate discrete etalon positions (frequencies or channels) at which mode-1 measurements are made. (b) Contributions to the solid line in Figure la, show- ing CO 2 and 03 features, and the quasi-continuum of aerosol.
GILLE ET AL.: CLAES TEMPERATURE ACCURACY AND PRECISION 9585
spectral response broadens as a function of tilt angle 0, from 0.245 cm -l at normal incidence to 0.333 cm -l at the largest angle involved. The central frequencies at which the outgoing radiance is measured in the science mode are indicated and given in Table 1.
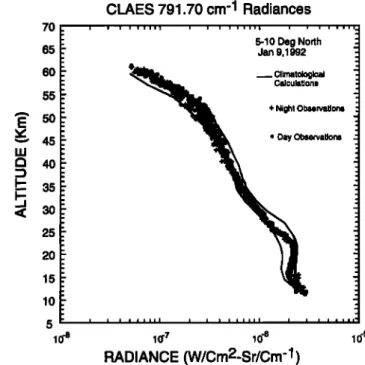
The vertical distribution of radiances measured in the 791.70 cm -1 Q-branch peak channel for a tropical atmosphere is shown in Figure 2. The signal varies by 2 orders of magni- tude from bottom to top, mainly reflecting the decreasing den- sity of the atmosphere and increasing transparency with altitude. Within the passband of the etalon the signal varies from3 x 10 -6 W/(m2 sr cm -1) (denoted spectral radiance units (SRU) below)at the lowest level to 2 x 10⁻⁸ SRU at the top. Even at the top the signal is 10 times greater than the quoted noise values of 1.4 x 10 -9 SRU.
The bulge between 20 km and 25 km is due to the effects of the heavy aerosol loading following the eruption of Mount Pinatubo. This plot also shows calculated estimates of maxi- mum and minimum radiance in the tropics, based on tempera- tures and ozone amounts from the UARS climatology (developed by R. R. Seals and D. J. Wuebbles for the UARS Science Team; a description provided by P.S. Connell is given by Kumer et al. [1993]) and aerosols measured by SAGE. The radiance profile lies within or slightly over the estimated limits over the full altitude range, suggesting that there are no severe anomalies in the radiance measurements and their calibration, or in the calculations.
A research approach to solution of this multichannel, multiemitter retrieval from simulated CLAES data for ozone, temperature and pressure, and sensitivities to instrument effects, has been published by Kumer and Mergenthaler [1991]. The V7 production approach [Kumer et al., this issue] is similar in that it breaks the problem into the equivalent of a single-emitter and single-channel problem for each species by using a linear least squares approach for fitting calculated spectra to the observed data. In this case, the species are aero- sol, ozone, and CO2. Following GH, the CO2 distribution is assumed to be known so the equivalent single-emitter and single-channel formulation for CO2 can be used to retrieve
temperature.
As noted above, knowledge of a single reference pressure is required. Spacecraft ephemeris and attitude data are used to calculate the geographic location and altitude viewed by each detector. The reference pressure is adjusted so that the mean CLAES-retrieved temperature is equal to that from the U.S.
National Meteorological Center (NMC) analysis for the pres- sure range of 100 to 10 mbar. How well this is accomplished is discussed below. The equivalent single-emitter and single- channel retrievals and error estimation for each species are implemented by an approach [Kurner et al., this issue] similar to the Newtonian iterative algorithm [Rodgers, 1976, equa- tion (99)]. For production data processing, the method requires a computationally efficient algorithm for calculation of radiance profiles. The model described by Marshall et al. [1994] is used for this purpose. The method uses initial guess ozone profiles from the UARS prelaunch climatology. NMC provides the initial guess temperature profile. The quality of CLAES-retrieved ozone data is the subject of a companion paper [Bailey et al., this issue]. Retrieved aerosol has been discussed in numerous papers [Mergenthaler et al., 1993; Roche et al., 1994; Massie et al., 1994]; its validation is also discussed in a companion paper [Massie et al., this issue.]
3. Estimation of CLAES Experiment
Systematic and Random Errors
It is useful to compare the empirically estimated instrument systematic and random errors with the equivalent quantities inferred from correlative data comparisons and observed vari- ability. In estimating instrument errors associated with the retrieval of temperature, the predicted errors in the measured and calculated atmospheric spectral radiances were applied to an altitude-dependent profile relating error in temperature to percent radiance error. This latter relationship was found empirically by using the retrieval algorithm to determine the sensitivity of the retrieved temperature to changes in the input radiance. The following paragraphs describe the components of the error estimation and summarize the total systematic and random errors for selected pressure levels for temperature in Tables 2 and 3, respectively.
3.1. Systematic Errors
The primary sources of systematic error are as follows: Radiometric calibration. Atmospheric radiances are cali- brated using the onboard blackbody calibration source (OBCS). Determination of spectral radiances from this source involves biases in the OBCS temperature as determined from five platinum resistance thermometers (PRTs), errors in the knowledge of the absolute emissivity, offsets in the electronic
Table 1. Narrowband channels used in the CLAES Blocker-8 Spectral Region for Retrieval of Temperature, Aerosol, and
Ozone
Tilt Angle, deg Spectral Position, cm -• Spectral Feature
16.540 789.9O 17.650 790.29 18.679 790.60 19.450 790.92 21.352 791.70 22.487 792.20 5.460* 792.61 6.674* 792.78 9.926* 793.36
0 3 line center, i.e., peak
minimum, i.e., in between lines, use for aerosol retrieval 0 3 line center, i.e., peak
minimum, i.e., in between lines, use for aerosol retrieval strongest region of CO 2 Q branch and overlapping 0 3 line slightly weaker region of CO 2 Q branch
progressively weaker region of CO 2 Q branch, and 0 3 CO 2 and 0 3
CO 2 and aerosol * These channels use the next order etalon transmission feature.
9586 GILLE ET AL.' CLAES TEMPERATURE ACCURACY AND PRECISION uJ 70 65 60- . . 55 . .. 50- . 45- 40' . ,. 35 = 30 . 25' . 20' . 15- 10 5 10 'a CLAES 791.70 cm -1 Radiances' . I ! I I I Ill i i i i • w ill ! I I I I I II 5-10 Deg North Jan 9,1992 • Climatological Calculations .. . + Night Ol•ervation$ - . Day Obsewa•ns i i i i i iii i I I I I I II I i 10'7 10 "6
RADIANCE
(W/Crn2-Sr/Cm'l)
, I I , I I I 1(• 5Figure 2. Observed radiances in the 791.7-cm -1 channel from
the 20 detectors (symbols) versus altitude between 5 ø and 10øN, on January 10, 1992, compared to calculations based on UARS climatological maxima and minima of ozone and aerosol, and NMC temperatures. (Pluses are night; open circles are day observations.)
zero-photon level, uncertainty in foreoptics thermal emission,
and the use of a detector "characteristic responsivity curve"
fitting technique to provide responsivities for atmospheric radiances below the minimum (coldest) OBCS radiance. The design and prelaunch characterization of the OBCS has been discussed by $territt et al. [1990]. OBCS temperature and emissivity uncertainties in the 790-cm -l spectral channel
amount to approximately 1.1% root-mean-square (RMS) radi-
ance error at the OBCS coldest temperature of 160 K. The other uncertainties listed above are mainly of interest in this wavelength region for high-altitude, low-radiance conditions. The root-sum-square (RSS) of all systematic radiometric cali- bration radiance errors is estimated to be in the range 1.1- 2.5% between 100 and 0.46 mbar. For the V7 software used in
the retrieval of the data discussed here, only calibrations up to August 10, 1992, were used. This leaves a roughly linear
Table 2. Contribution to Systematic Temperature Error
responsivity trend of about 3% in the 790-cm -1 channel from
August 10, 1992, to January 15, 1993, followed by recovery
to the August 10, 1992, value by April 24, 1993, as the detec- tor temperature increase accelerated toward the end of the cryogen lifetime. This small trend will be removed in future software versions. We also note that during the last six days of the mission, April 30, 1993, through May 5, 1993, the detector temperature was rising very rapidly, with associated rapid changes in responsivity and noise. The V7 data for this
period therefore should be used with considerable caution.
Special calibration software will be developed to improve the
quality of data from these six days.
Instrument characterization. This includes absolute wavelength calibration, spectral transmission function, spec- tral dispersion along the vertical extent of the array, detector spatial responsivity, optics out-of-field stray light rejection, and in-field scattering (optical cross talk). James et al. [1988] discuss the design and prelaunch characterization of the CLAES solid Fabry-Perot etalons, and Mergenthaler et al. [1990], and Kumer et al. [1990] discuss aspects of the design and prelaunch characterization of the blocking filters. Informa- tion on the absolute wavelength calibration and the effective spectral transmission function can also be deduced from on- orbit spectral scans of specific emission features, and limits on off-axis and in-field scattering can be deduced on orbit from
high altitude and "cold space" radiance measurements. From
prelaunch and on-orbit analysis we estimate an uncertainty of 0.01 cm-l both in the absolute spectral calibration and in the
spectral function width. The spectral calibration error results
in a relatively small radiance error of 0.6%. The uncertainty in
the spectral function, however, represents a 3% error at median tilt angles in the 790 cm-• etalon spectral function. The error
has some covariance between the measurement of atmospheric
spectra and the measurement of the nearly continuum-like radi-
ance from the OBCS, especially for quasi-continuum atmos-
pheric emitters such as aerosol and CFC13, and in the wings of
overlapping lines. This would tend to reduce the effective
radiance error associated with the spectral function uncer-
tainty in these situations. However, for the purposes of
comparing estimated systematic error with that inferred from
correlative measurements in this paper we will assume the maximum 3% radiance error. Array dispersion effects contri- bute less than 1.2% radiance error, and detector uniformity contributes less than 0.5%. Array cross talk contributes less
than 1% from 100 to 0.46 mbar. The RSS of all instrument characterization radiance uncertainties is estimated to be in
the range 3.1-3.3% between 100 and 0.46 mbar.
Systematic Temperature Error, K
100 mbar 46 mbar 10 mbar 1.0 mbar 0.46 mbar
(16.00 km) (21.40 km) (32.00 km) (48.00 km) (53.40 km)
Radiometric calibration 0.45 0.49 0.52 1.19 0.99
Spectral calibration 0.27 0.29 0.31 0.32 0.26
Spectral response function 1.26 1.38 1.44 1.50 1.20
Array dispersion 0.42 0.55 0.43 0.15 0.04
Detector spatial response 0.04 0.04 0.14 0.06 0.14
Optical crosstalk 0.08 0.09 0.10 0.20 0.40
Spectral parameters 1.26 1.38 1.44 1.50 1.20
Forward radiance 0.42 0.46 0.48 0.50 0.40
GILLE ET AL.: CLAES TEMPERATURE ACCURACY AND PRECISION 9587
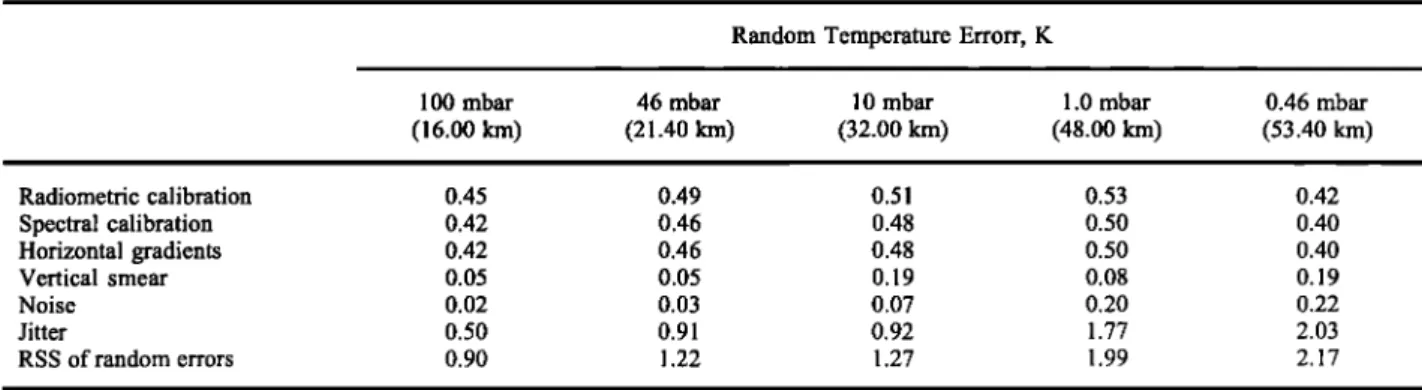
Table 3. Contribution to Random Temperature Error
Random Temperature Errorr, K
100 mbar 46 mbar 10 mbar 1.0 mbar 0.46 mbar
(16.00 km) (21.40 km) (32.00 km) (48.00 km) (53.40 km) Radiometric calibration 0.45 0.49 0.51 0.53 0.42 Spectral calibration 0.42 0.46 0.48 0.50 0.40 Horizontal gradients 0.42 0.46 0.48 0.50 0.40 Vertical smear 0.05 0.05 0.19 0.08 0.19 Noise 0.02 0.03 0.07 0.20 0.22 Jitter 0.50 0.91 0.92 1.77 2.03 RSS of random errors 0.90 1.22 1.27 1.99 2.17
Spectral parameters. This involves a priori knowledge of spectral line strengths, shapes and positions, and their pres- sure and temperature dependencies, and knowledge of absorp- tion cross sections for continua-like features. Spectral parameters are taken from the HITRAN92 compilation. For temperature the largest error source is associated with the line strength uncertainty, for which we chose + 3% [Rothman et al., 1992; Johns, 1992].
Forward radiance model. This primarily involves radia- tive transfer approximations, treatment of line overlap and mix- ing, and calculation of emissivity growth approximation (EGA) table coefficients. Errors estimated by comparing the forward model results with rigorous line-by-line code calcula- tions show that the average systematic radiance error is about
1%.
Table 2 summarizes the systematic error estimates in retrieved temperature from these various radiance effects for five pressure levels. The estimated systematic errors in temperature are dominated by uncertainties in spectral parameters and the spectral response function. The estimated systematic errors, obtained by taking the RSS of the individual components, are found to be between 1.95 and 2.52 K. These values are to be compared with those found in sections 5 and 6.
3.2. Random Errors
The primary sources of random error are as follows: Spectral Repeatability. The primary instrument contribu- tors to random errors in the measured radiances involve repeatability in the angular (i.e., spectral) positioning of the Fabry-Perot etalons. Observed repeatability showed it to be better than 0.03 ø, and a similar value was inferred from observations of scatter in the shape of the on-orbit spectral modulation curves obtained during OBCS calibrations. For the 792-cm -l temperature channel this results in a random error of less than 1% in the measurement of atmospheric line
radiances.
Horizontal gradients. Random errors due to line-of-sight gradients in the viewed radiances were investigated by look- ing at the sensitivity of the retrieval algorithm to induced gra- dients. This led to an estimate of approximately 1% equivalent radiance error. For these two mechanisms the radiance errors were converted to temperature errors in the same way as for the systematic errors and are presented in Table 3.
Radiometric Noise. Instrument radiance noise is charac- terized as the noise equivalent spectral radiance (NESR) in SRU units. This is defined as the input spectral radiance at the instrument aperture required to give an output signal equal to
the system noise for a specific integration time. The NESR has a specific value for each of the 20 CLAES detectors and also for the specific spectral positions within each particular chan- nel, due to the variation of the effective blocker filter transmis- sion during a spectral scan. A measure of the effective NESR due to the instrument alone is obtained by looking at the vari- ance of a large number of mode-1 measurements obtained when UARS was rolled, so that CLAES looked well above the sensibly emitting atmosphere into a region of very low radi- ances. Using the mode-1 radiance ensures use of the identical spectral positions, dwell times, integration times, and gains as those used when viewing the atmosphere. Further, these roll- up radiances are conditioned in an identical manner to those used in the retrieval of atmospheric parameters, particularly with respect to the reduction of a quasi-sinusoidal low-
frequency artifact ("ripple") seen in the electronics dark noise
output. For the eight spectral positions used in the retrieval
of species in the 790-cm -1 channel the array average NESR
as seen in the roll-up data lies between 0.8 x 10 -9 SRU and 1.4 x 10 -9 SRU.
Another measure of the NESR can be obtained from science mode measurements obtained during the cooldown of the OBCS. In this case, the signal levels are higher, and the noise levels are larger, indicating a value of about 5.0 x 10 -9 SRU. These signal levels are closer to those seen in the stratosphere, and the difference suggests that the noise depends, to some extent, on signal level. We might expect to see the higher noise levels associated with the atmospheric radiances going into the retrievals. We will use the higher value in this error
discussion.
The effect of this noise was estimated by simulation, adding Gaussian random noise with the above magnitude to calcu- lated radiances, and carrying out the retrieval. First, an ideal radiance profile was derived from a temperature profile. Radiometric noise with NESR of 5 x 10 -9 was added to each of the five channels. The radiance profile was inverted, and the resulting solution was compared with the initial profile. The RMS difference between a number of simulated profiles and the initial profile gives an estimate of the precision. Additional simulations showed that as expected, the precision estimates were not significantly affected by the initial profile chosen. The standard deviations of 10 cases are shown in Table 3. Noise errors lead to temperature errors that grow with altitude, as the signal-to-noise ratio decreases at higher altitudes.
Vertical jitter. During observations a combination of random error in the positioning of the limb acquisition and adjustment mirror (LAAM) and oscillatory spacecraft motions
9588 GILLE ET AL.: CLAES TEMPERATURE ACCURACY AND PRECISION
that are not well sampled by the standard 2.048-s roll data, with a magnitude of several tens of meters of motion of the tangent point (R. J. Wells and C. D. Rodgers, unpublished study, 1994)contributes additional random noise to the retrievals. The thermal snap, occurring when the solar array passes between sunlight to shadow, also causes large altitude excursions that last for over a minute. This random vertical motion between etalon positions is estimated to be approximately 80 m_ The resulting error in temperature will depend on the vertical gradients of the channel radiances. Again, simulated 790-cm -l channel radiances were calculated, with random altitude errors between the etalon positions. The errors had a Gaussian distribution, with an amplitude of 80 m. The RMS differences from the true values for 10 cases are shown in Table 3. Temperature errors due to jitter do not have a strong dependence on altitude.
The RSS of these values for these independent error sources are also shown in Table 3. In the next section these values will be compared to an observational determination of the pre- cision of CLAES temperature retrievals.
CLAES V7 Temperature Precision
ß 1 !1, lillli&lil'illllllllllllllilllllilllll
.2
•
'o,,...
ß ß '
60
55.5
_5o
• 2
. .
45
•
35 •'
0-1
3O 2 2550
20
10 .5 1.0 1.5 2.0 2.5 3.0 3.5 4.0 4.5 [K]4. Observed Precision of CLAES
Temperature Determinations
The true temperature T is related to the retrieved tempera- ture T R by the expression
TR=T+œA +_œp (1)
where e• and ep are the accuracy and precision associated with T•. (Estimation of e• is discussed in sections 5 and 6.)
When the same area is viewed within a time period short enough to minimize atmospheric variability, the precision may be estimated directly from temperature profiles retrieved using the operational software. The CLAES limb-viewing track intersects itself at the northernmost and southernmost parts of the tracks (80øN and 32øS or 32øN and 80øS depending on the phase of the spacecraft yaw cycle). This feature enables nearly coincident profiles from successive orbits to be obtained at these latitudes. The profile pairs so obtained are separated in time by the orbital period of 96.4 min and are within + 1 ø latitude and +_ 2 ø longitude of each other.
Assuming that atmospheric and instrument characteristics remain unchanged (i.e., T and e• are constant) over these spa-
tial and temporal scales, the RMS difference between the pairs
T• and T• gives
a measure
of the
precision,
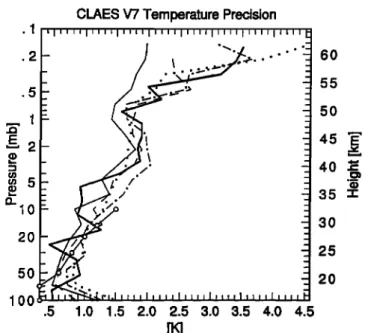
Figure 3. CLAES V7 temperature precision as a function of altitude. Empirical determinations (see text): thin solid line, January 9-12, 1992, 32øS, 53 pairs; dashed, June 20-July 10, 1992, 32øN, 280 pairs; dashed-dotted, July 30-August 10, 1992, 32øS, 160 pairs; dotted, December 2, 1992, to January 7, 1993, 32øS, 482 pairs. The simulation is shown by the thick solid line. Radiosonde precision [Nash and Schmidlin, 1987] is indicated by the line connecting the open circles.
precisions calculated from the data all show the same increas- ing dependence on altitude, with similar values; the spread gives an idea of the variability of this estimate, which may also contain some component of atmospheric variability. These values are similar for all yaw periods. The simulated precision shows the same dependence on altitude, with similar values. In summary, precision values estimated by both methods are about 1 K in the lower stratosphere, less than 2 K up to the stratopause, and reach approximately 3.5 K in the lower meso- sphere. The agreement between the two estimates supports the idea that random noise and jitter are the dominant factors con- tributing to the random temperature errors. Estimated radiosonde precisions [Nash and $chmidlin, 1987] are also shown; they are comparable to or larger than the observed CLAES precision values over the altitude range of 20-30 kin.
= - /2 (2)
where angle brackets indicate an average over the number of comparison pairs. This assumption does not hold exactly and this estimate for the precision should therefore be considered an upper limit for the true value.
Precision estimates were also calculated, based on simula-
tions including both dominant noise sources, jitter and instrumental noise, with the magnitudes discussed in section 3.
Figure 3 compares the precisions calculated using large numbers of pairs of profiles at 32øN or 32øS during the two northern and one southern winter to the precisions derived using simulated radiances, plotted as a thick solid line. The
5. Comparisons of CLAES Temperature
Retrievals with Global Analyses
5.1. General Approach
Ideally, CLAES retrievals would be compared to estab- lished, accepted measurement standards that were valid under all conditions and available in all locations, and appropriate error statistics developed. These estimates would then be compared to the calculated systematic errors in CLAES temp- eratures that were presented in section 3 to demonstrate that the sources of error were understood and properly quantified. Unfortunately, assessment and verification of the accuracy of stratospheric quantities is difficult in any case because of the lack of such ideal standards. Estimating the accuracy of stratospheric temperature determinations is a different problem
GILLE ET AL.: CLAES TEMPERATURE ACCURACY AND PRECISION 9589
from that of other quantities because of the number of other methods and measurements available; it is also potentially more ambiguous, because these other methods do not always agree with each other as well as would be desired. Compari- sons inevitably require attempts to discover which of the "standard" measurements is closest to the truth. In addition, space-based determinations bring their own set of difficulties, including differences of horizontal and vertical resolution and measurement time, from ground-based measurements as well as from each other.
CLAES data cover a large part of the globe every day and are expected to be used in a globally mapped form for many research applications. Comparisons show that temperatures determined on the ascending and descending (northward and southward) portions of the orbits are in good agreement, except in locations where the different orbital sections system- atically sample different parts of the daily temperature cycle. Similar effects have been noted in temperatures retrieved by other instruments with the same view direction (e.g., MLS, E. Fishbein, personal communication, 1995). The following analyses combine all CLAES data.
The approach adopted here is to compare mapped CLAES temperatures with standard global analyses of stratospheric temperature. This will allow a determination of overall differ- ences with CLAES. Such comparisons will also show the conditions under which there are large differences. It will then be possible to investigate those situations in greater detail, to see what can be learned about both tyl•es of data.
In particular, global analyses are operationally produced on a daily basis by NMC, for a series of pressure levels up to 0.4 mbar, based on temperatures measured by conventional balloon-borne radiosondes and those derived from the TOVS system on NOAA satellites [Gelman et al., 1994; Finger et al., 1993]. The NMC analyses use radiosonde data up through
l0 mbar in the northern hemisphere (NH), along with satellite data; above that, only satellite data are used. In the southern hemisphere (SH), where there are far fewer radiosondes, only satellite data are used above 100 mbar. The gridding employs a Cressman approach to use the observations to modify the initial field, which is analyzed TOVS data. The temperature corrections provided by Gelman et al. [1994] have been applied to the analyses used here. There are few independent data with which to evaluate systematic errors. They present a table of estimated combined random and systematic errors, with values ranging from 1.5 K at 100 mbar in data rich areas to 7 K at 1 mbar and 9 K at 0.4 mbar.
In addition, the United Kingdom Meteorological Office (UKMO), to support the UARS program, developed a data assimilation code to produce global analyses based on the same input data [Swinbank and O'Neill, 1994]. The UKMO analyses assimilate the radiosonde measurements and the TOVS satellite temperature retrievals into their model. Thus one would expect that the UKMO maps might be characterized by better vertical continuity and coherence, as well as perhaps better temporal continuity, than the NMC analyses. There are also differences in the screening techniques, which determine which data are retained in the analyses, which may influence analyses in extreme or rapidly changing conditions.
Because both of these analyses are based on TOVS retriev- als, it is worth noting some points about them. The TOVS sounders [Smith et al., 1979] are cross-track nadir sounding instruments, with quite broad weighting functions, the high-
est of which peaks near 2 mbar. Retrievals produce layer-mean temperatures between the standard levels used in the NMC analyses, which are spaced about 7 km apart. The temperatures at these levels are derived by log-linear interpolation between the given TOVS layer-mean temperatures. Thus their vertical resolution is coarse compared to that of CLAES. In addition, there is limited measurement information in the 0.4-mbar field.
The CLAES profiles have been mapped using a Kalman fil- ter approach, similar to that described by Kohri [1981], but improved to allow more data to be included and imposing better latitudinal continuity. All sets of data were supplied at the UARS pressure levels, given by the expression p(n) =
1 On/6 for integer n in the range 12 > n > -6. 5.2. Time-Latitude Cross Sections
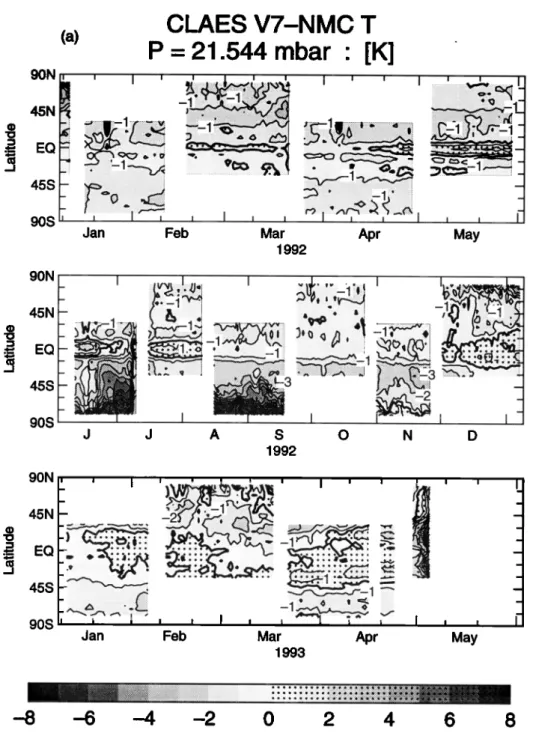
Figure 4a is a time versus latitude cross section plot of CLAES minus NMC zonal mean temperatures at 21.544 mbar. The alternating northward and southward viewing of CLAES resulting from the yaw-around of UARS can clearly be seen, as well as the data gaps resulting from closing the CLAES door. Note that at this level, temperature differences are generally small (< 3 K), except for large negative values (NMC = 9 K warmer than CLAES) in high southern latitudes in southern winter, when temperatures are very cold. A corresponding difference is not seen in the NH, although there appears to be more small-scale variability with latitude and time. Other- wise, we note that differences tend to be negative and that differences in the tropics vary from positive to negative in a regular way. The same features are seen at 46.4 and l0 mbar, but the NH differences show more rapid variations.
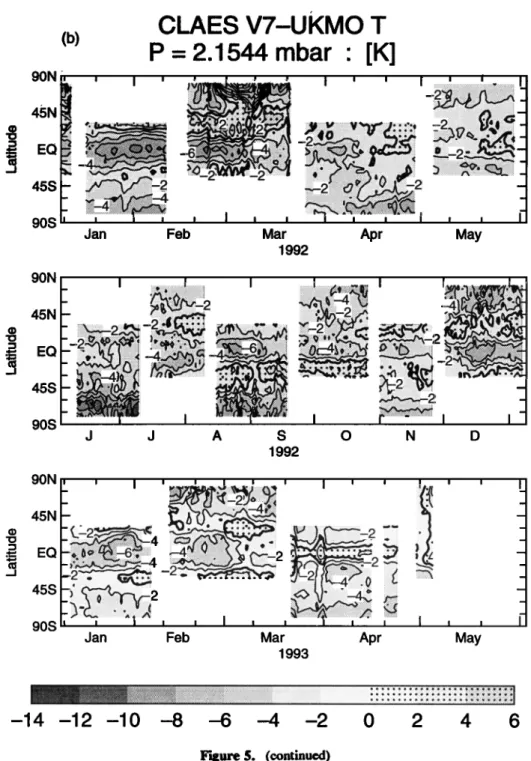
The corresponding plot, comparing CLAES to UKMO data, is shown in Figure 5a; this shows the same general fea- tures, but the differences in SH winter are smaller than in Figure 4a, and largest (-- 5 K) away from the pole. The smaller differences are likely due to the inclusion of radiosonde temperatures in the UKMO assimilation [see Manney et al., this issue]. There are more positive differences, notably in the equatorial region.
Differences between CLAES and NMC at 2.15 mbar are shown in Figure 4b. Once again, large differences are seen in June 1992, in the depths of the southern winter, where differ- ences up to 16 K are seen; these have disappeared by August. However, comparably large differences are also seen in the northern polar winter (December) at this level. Again, CLAES is generally cooler than NMC, and there are large differences in the tropics that vary with season. Differences at higher levels are not presented because of the lack of information in the TOVS radiances makes retrievals at higher levels suspect. Other comparisons will be used to evaluate temperatures at high altitudes.
Figure 5b displays the differences from the UKMO at the same level. The same qualitative features are seen as in Figure 4b, but again the differences are •omewhat smaller, and there are more positive (CLAES warmer) regions.
5.3. Latitude-Pressure Cross Sections
To get additional insight into some of the situations in which there are large differences between CLAES and NMC or UKMO, we next look at latitude-altitude cross sections of these differences for particular dates. The cross section of dif- ferences from NMC for early August 1992, when CLAES was viewing the northern summer and low-latitude SH, is shown
9590 GILLE ET AL.' CLAES TEMPERATURE ACCURACY AND PRECISION 90N 45N EQ 45S 90S (a)
CLAES V7-NMC
T
P,
--
21,544
mba
:, [K,]
... ;:•i•ii.-:..--•i•i::iii::•::::•11iiii!•!::::iiiiiii?•: :•i(<l•'m--....•:.-.::--'---,., 1;.•.:v.--.•.•!-
l•;-•-.--.--•.--•.--•:::•.--•.--•.--...v..:
-'/":';•
Jan Feb Mar Apr May
1992
A S O
1992
Jan Feb Mar Apr
1993
i
May
-8
-6
-4
-2
0
2
4
Figure 4. Time latitude (b) 2.154-mbar surface.
plots of CLAES V7 minus NMC temperature:
6 8
(a) 21.544-mbar surface;
in Figure 6a. Differences at most locations are small (< 2 K), suggesting that under these conditions, when there are no extremes of temperature, the CLAES temperature retrievals give results in good agreement with the conventional data and the sources on which they are based.
However, there are differences of several degrees in the tropics, alternating in sign with altitude. These appear to be due to tropical waves, which have vertical wavelengths of only a few kilometers and are thus too small to be measured well with the conventional vertical sounding systems, which have vertical resolutions greater than 10 km. These are dis- cussed in more detail below.
There is also a smaller but significant difference (CLAES up to 4 K cooler than NMC) in a region from 45øN-to 80øN,
between 2 and 3 mbar. Similar but slightly smaller differences are seen in comparisons with UKMO data (Figure 7a). However, the Microwave Limb Sounder (MLS)on UARS agrees with CLAES in this part of the atmosphere, which thus requires further attention.
A cross section for the June 1992 period, during the middle of the southern winter, is presented in Figure 6b, which shows much larger differences in the high-latitude SH, centered at 65ø-70øS, over a deep altitude region, as noted above. Given that the NMC analysis is based entirely on satellite data in this region of extremely cold temperatures, and have very broad weighting functions, it is not immediately clear which results are closest to the truth. However, the TOVS retrieval scheme, while physically based, relies on a priori information
GILLE ET AL.: CLAES TEMPERATURE ACCURACY AND PRECISION 9591 90N 45N EQ 45S
90S
t
(b)
CLAES
V7-NMC
T
P,=2.1544
mbar
: [K]
I I I..•
.:.:.:
I
•[ I .• [ • [ [ [ [ I
•i.•
3:.:..•
; i;
i i i, I [ [ ...
"'"'"'"':":•
• ['
...
I [
;•-2
Jan Feb Mar Apr May
1992 90N 45N EQ 45S 90S
•:•.
'•%•½iiii:;i•ii:L•:;•.
i?-'"•2j•i•!::-"•ii:.•?
'-"
•:
'""•
d d A S O N D 1992 90N 45N EQ 45S 90S...
-8'••• -• ;iiii?i:i?i'i'.'.'i'i:•:-'
...,,:
-':'•
o
Jan Feb Mar Apr
1993
' I
May
-14 -12 -10 -8 -6 -4 -2 0 2 4 6
Figure 4. (continued)
derived from NH rocketsondes and radiosondes, which are warmer, and therefore will tend to provide a warm bias for the soundings.
The UKMO analyses employed in Figure 7b incorporate radiosonde temperatures as well as the same satellite data; Figure 7b shows the same features, which is not surprising, but with smaller differences. Clearly, this is another region to be looked at in more detail. Differences in the tropics are again smaller and consistent with the idea of tropical waves.
Cross sections for the two northern winter periods are pre- sented in Figures 6c and 6d for two days with comparable dates in 1992 and 1993, chosen for comparison by the UARS team. Again, there are large differences which vary strongly with altitude in the tropics. Of greater interest are the large
differences at high latitudes. However, these differences with NMC are much greater than those with UKMO (Figures 7c and 7d) at both 30 and 40 km altitudes, and again MLS agrees with CLAES (and UKMO), suggesting that the NMC analy- ses may be too warm.
A further explanation may lie in the CLAES transmittances. In general, the agreement between the parameterized values and the detailed line-by-line calculations is better than 1%, as given in section 3, but during the extreme cold of the Antarctic winter, errors of 4% occurred in the region of the temperature minimum, which could bias CLAES temperatures under extremely cold conditions. Based on these results, extra atten- tion will be paid to the three situations of southern polar winter, northern polar winter, and variations in the tropics.
9592 GILLE ET AL.: CLAES TEMPERATURE ACCURACY AND PRECISION (a) 90N I•. 45N • EQ 45S 90S
CLAES V7-UKMO
T
P-21.544
mbar ß [K]
'
I
'
, ...
•..•:l. ..' ...
'
I
'
'
':'i"
...
•i":'""'•i
'
Jan Apr i Feb I I Mar May 1992 90N 45N EQ 45S 90S I A S O 1992I ...
•'•""•
'•::::i:.!'"'==========================
-:-:::::i
N D 90N 45N --'= EQ 45S 90S ::-:.::' ' '"':--:•--:•! ":' .... •:'::•!Jan Feb Mar Apr
1993
i
May
' I
-8
-6
-4
-2
0
2
4
6
8
Figure5.
Time latitude plots of CLAES V7 minus UKMO temperature:
(a) 21.544-mbar
surface;
(b) 2.154-mbar surface.
6. Comparison
of CLAES Temperatures
with
In Situ and Lidar Measurements
As noted above, it is difficult to assess the absolute accu- racy of satellite temperature determinations because of the lack
of accepted
temperature
standards.
The differences
that may
arise because the "overpasses" over the ground stations are
not at exactly the same location or time as the ground-based
measurements, and the larger volume sampled by the satellite
instruments (compared to the local volumes sampled by the
conventional data) also obscure the significance of observed
differences. In addition, no single technique can cover the
total altitude regime observed by CLAES. On the other hand,
a ground-based (or ground launched) instrument can be care-
fully adjusted and calibrated before use, minimizing long-term
drifts.
6.1. Comparisons up to 10-mbar Pressure Level
Radiosondes
are launched,
usually
at 0000 and 1200 UT,
from many locations in the NH and SH. Over 800 from each
time
reach
the 70-mbar
level,
but
the number
decreases
rapidly
at the upper levels, such that only slightly over 100 reach the
10-mbar
level, almost
all in the NH (W. J. Randel,
private
communication, 1995).
Comparisons
were
made
against
standard
meteorological
GILLE ET AL.: CLAES TEMPERATURE ACCURACY AND PRECISION 9593
CLAES V7-UKMO
T
(b)P- 2.1544 mbar ß [K]
90N
,, , I ' ::!•!i•;•
•.,,•=-.'",
"•-:-•
I ' ' I ' '
;" • ...
:
...
' ... :ii:.:::111.i.::.:'::%2;i•;:•".
".•"'-:::•'"75'I.:
?:•::..•::.-:...-•:•..
.?...:..:.:.:::. •?..?:•5•...::•::::•:::.-'•::::.:-:-:•...
... ==============================================================================
...
•
•!•;:•'"'
':
90S
, I , , r--...
'"'"•"'"•'••••
...
I ' '
Jan Feb Mar Apr May
1992 90N
45N
•
EQ 45S 90S::•:•..--:-•-:-:--•...••
-•i•::•i•---
-:i•:.:•i•i•i•::•:.
...
::i!'!-!-..
J J A S O N D 1992
..s
90S
•/•
Jan• •
Febß
j•_..-.:...:...__
'•
'•'
i:::'•½::iii ... ":•::•:• .... iF:::"' ß ":: ...Mar Apr May
1993
-14 -12 -10 -8 -6 -4 -2 0 2 4 6
Figure 5. (continue. d) periods. The coincidence criteria used for the radiosonde
comparisons were 1 ø latitude, 4 ø in equivalent longitude (4ø/cosine (latitude)), or about 450 km, and 3 hours. If more than one CLAES sounding met these criteria for a single radiosonde, all were included in calculating the statistics. For each pressure level the number of difference pairs that were used in computing the mean difference for that level was
calculated. The maximum and minimum number of these
difference pairs used in each comparison are given in the figure captions, in the form maximum/minimum. The mean differences along with the standard deviations of the mean (SD( X )) defined as
li__•l
(X
i _
.•)2
SD(.•)
= N(N-
1)
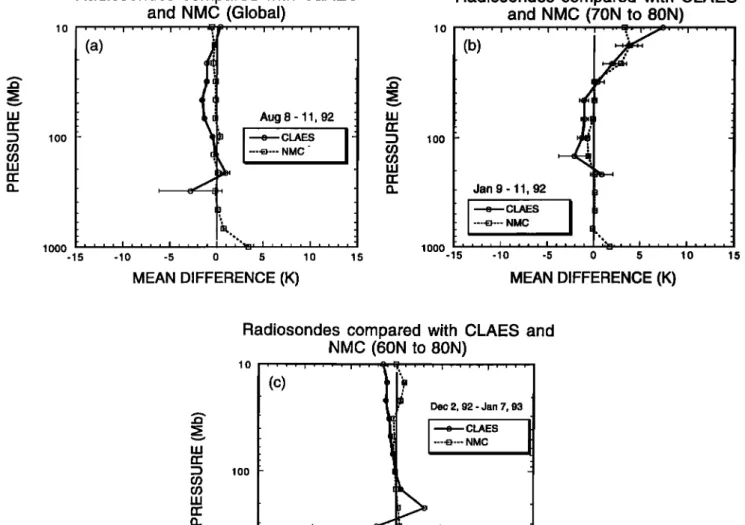
(3)were computed, either locally or in specific latitude bands. Figure 8a presents the average CLAES minus radiosonde differences averaged over the globe, with their SD( X ) values, for the undisturbed NH summer (August 8-11, 1992) situa- tion mentioned above. Between 100 and 10 mbar CLAES retrievals are less than 2 K cooler than the radiosondes, with an SD(X ) small enough to indicate that the differences are significant. The NMC-analyzed values at the radiosonde loca- tions are also compared to the radiosonde values. As expected, the analyses and the radiosondes are in very good agreement. The results are essentially unchanged if the data are stratified by latitude. The mean differences provide quanti- tative values for the CLAES accuracies. One interpretation is that these are the characteristic accuracies of the temperature retrievals and that larger values in other situations result from special circumstances which can be identified.
9594 GILLE ET AL.: CLAES TEMPERATURE ACCURACY AND PRECISION
CLAES V7-NMC T Diff [K]
(a),
5o
•E f
ß
Au•.
10,
1992
...
::::::::::::?::::?::::::::::
...
::::::::::::::2::::::::::::::::::?::::::::::::::::
....
::•::::•.'.,.'i•i•!•:.=;•:i
- 40
• •
_•
• 10• - '
1 • . ... ,-••20
•
•os 75s 60s 45s 30s 15s EQ 15N •N 45N 60N 75N 90N •titude(b)
...
Jun.
20,
1992 40
•
1•
-•0S 75S 60S 45S - •S 15S EQ 15N •N, I , , I , , I , ,•20
45N 60N 75N 90N •titude(c)
Jan. 10. 1992 • • • I • • I • • I • 201•0S 75S 60S 45S - •S 15S EQ 15N •N 45N •N 75N • 90N
•titude(d)
so
• 40 •• • Jan'
•• •
100
90S 75S •S 45S 30S 15S EQ 15N •N 45N •N 75N 90N20
•titude-8
-6
-4
-2
0
2
4
6
8
Figure6. Latitude-pressure cross sections of CLAES V7 minus NMC temperature: (a) August 10, 1992; (b) June 20, 1992; (c) January 10, 1992; (d) January 4, 1993.
High-latitude differences, averaged over a yaw cycle are shown in Figure 8b, which also compares the NMC analysis with the radiosondes. The differences show a slightly different pattern, but the differences from the radiosondes are still less than or equal to 2 K, and NMC is again in good agreement
with the radiosondes for these conditions. However, individual shorter situations, such as January 9-11, 1992, show larger differences at 14 and 10 mbar (Figure 8c).
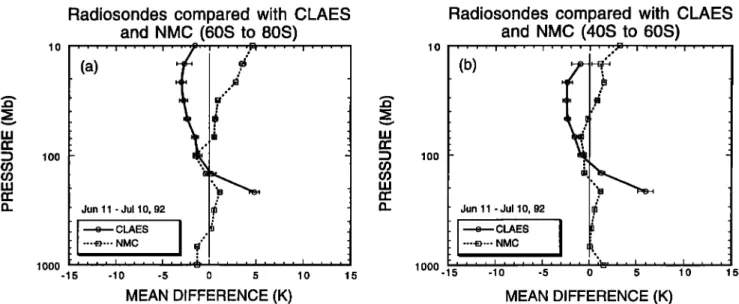
A different picture is presented in Figures 9a and 9b, which shows that the CLAES retrievals averaged over a yaw period in the depths of the southern winter are lower than the radiosondes by up to 3 K, while the NMC analyses are warmer than the radiosondes by up to 5K. The NMC minus radiosonde differences are largest in the 60ø-80øS latitude band. An obvious cause is the neglect of the radiosonde data in the SH stratospheric analyses. They probably result from several causes, including neglect of the radiosonde data in the SH stratospheric. In addition, although a physically based
retrieval is used, it has characteristics of a regression scheme, and the retrievals are unable to get as cold as the extremes.
Because these are the coldest temperatures, it raises the
question of whether there is a bias that causes CLAES to give
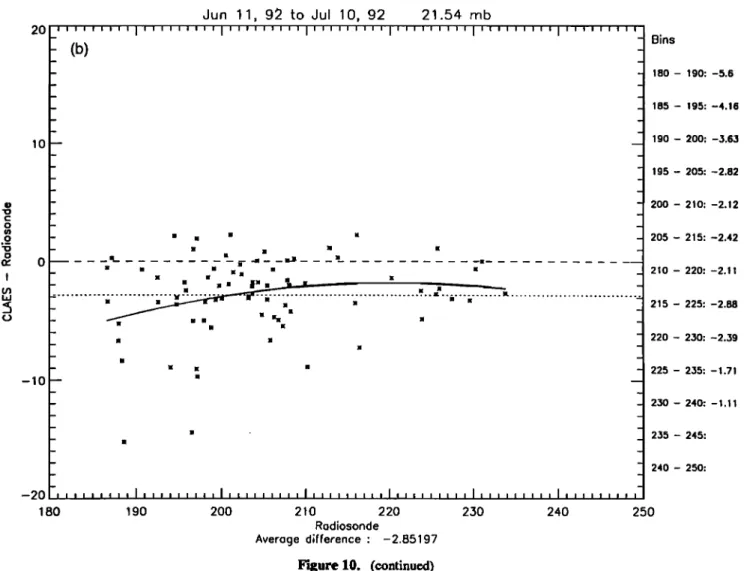
low results when the temperature is cold. Plots of CLAES minus radiosonde at 21.5 mbar for the northern and southern hemispheres are presented in Figure 10. From December 2, 1992, to January 7, 1993, in the 60ø-80øN band (Figure 10a) CLAES averages 1.2 K cooler than the radiosondes, but the mean difference becomes more negative below 195 K, as indi-
cated
by a least squares
fit (solid line). A similar
but more
extreme result, based on radiosondes between 40ø-80øS from June 11 to July 10, 1992 (Figure 10b), shows CLAES cooler, on average, by 2.85 K but with larger curvature for the slightly lower temperatures observed by the radiosondes. In the NH (Figure 10a) the minimum difference is near 200 K, and the fit difference at 190 K is about 2 K, while in the SH, the fit difference, for a differently distributed and much smaller hum-
GILLE ET AL.: CLAES TEMPERATURE ACCURACY AND PRECISION 9595
CLAES V7-UKMO T Diff [K]
(a) ... ...: ... ...::.-. ...
.•. 1
'i"
':'.:•
...
:-•
50
z3
!7::.
40 ..•
E.e
Aug.
10,
1992
"4oi! ...
75S 60S 45S'"•:'""•:
30S•
15S EQ 15N 30N 45N 60N 75N 90N Latitude (b) 1 - - S 75S 60S 45S 30S 15S EQ 15N 30N 45N 60N 75N 90N Latitude(c) , ,, , , , , , , ,
.o • 309596 GILLE ET AL.' CLAES TEMPERATURE ACCURACY AND PRECISION
lO
lOO
lOOO -15
Radiosondes compared with CLAES
and NMC (Global)
•
Aug
8 -,11
,,
92,
-10 -5 0 5 10 15 10100
1000 -15Radiosondes compared with CLAES
and NMC (70N to 8ON)
Jan
9- 11,
92
•
.... , .... , ....
-10 -5 0 5 10 15
MEAN DIFFERENCE (K)
MEAN DIFFERENCE (K)
Radiosondes compared with CLAES and
NMC (60N to 80N)
lO lOO 1 ooo .,Dec
2,
92
- Jan
7,
93
o CLAES
----•--- NMC 15 MEAN DIFFERENCE (K)Figure 8. Mean CLAES minus radiosonde and NMC analysis minus radiosonde comparisons: (a) August
8-11, 1992, global, maximum/m'mimum number of comparisons; 545/28; (b) January 9-11, 1992, 70ø-80øN, 91/3; (c) December 2, 1992, to January 7, 1993, 60ø-80øN, 1211/248.
sented in Figure 11. Here the coincidence criteria are 4 ø lati- tude, 12 ø of equivalent longitude, and 4 hours. These show agreement for the 75 soundings (one per week) within
approximately 1 K from 10 to 1 mbar, with CLAES cooler by
2 K at 6.8 and 4.6 mbar. The results are quite similar when a
12-hour time window is used and 300 rocketsondes satisfy
the coincidence criteria. CLAES is up to 7 K cooler than the
rocketsondes above 0.46 mbar, in the low mesosphere. The
agreement and consistency in the stratosphere are excellent. Lidar temperature soundings. Lidar temperature sound- ing of the atmosphere is reviewed by Keckhut et al. [1993] and their compatibility with NMC analyses is discussed by Finger et al. [1993]. As a relatively new technique, lidar data are still the subject of active evaluation. The technique derives the temperatures from the vertical derivative of the density, which is determined from measurements of lidar radia- tion backscattered by atmospheric molecules. Because molec- ular Rayleigh backscattering coefficients are well known, the
determinations have aspects of an absolute measurement sys-
tem. However, different systems show somewhat different results, which requires caution in their use for comparisons. A comparison among the lidars used here is discussed by Wild et al. [1995].
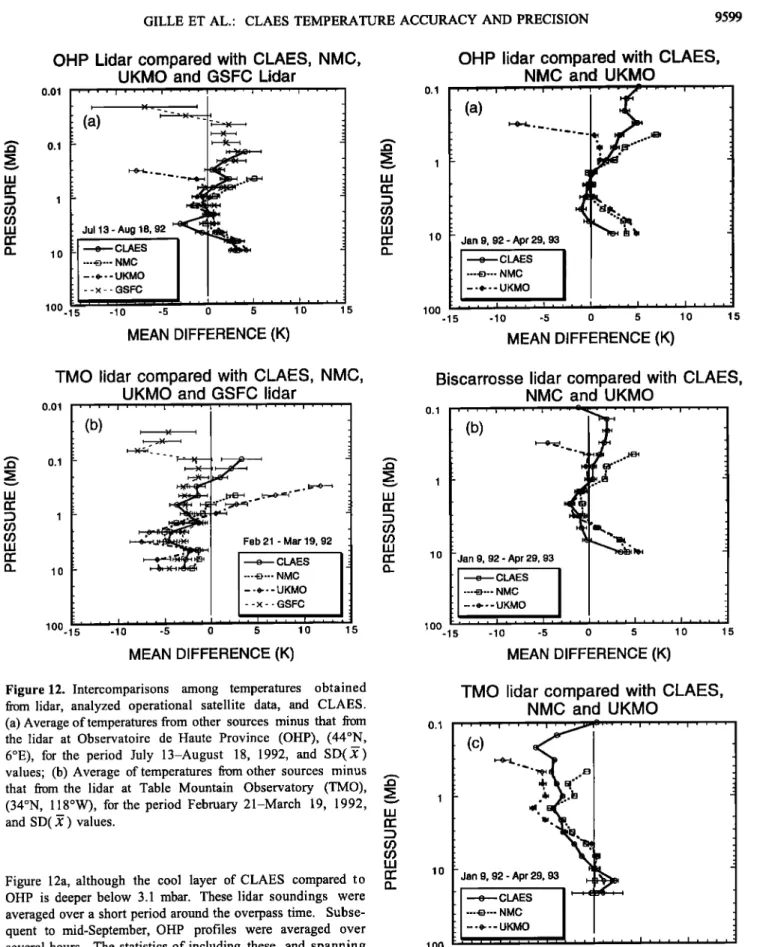
Results from an extremely illuminating comparison from July 13 to August 18, 1992 at Observatoire de Haute Provence (OHP) in France (44øN, 6øE) is shown in Figure 12a. Here the lidar soundings of the OHP lidar [Hauchecorne
et al., 1991 ] were compared to 31 simultaneous soundings by
the mobile lidar from Goddard Space Flight Center (GSFC)
[Ferrare et al., 1995; McGee et al., 1995], 33 days of NMC and UKMO data, and 18 CLAES temperature retrievals. For CLAES the sounding compared was the closest within 4 ø latitude, 12 ø longitude, and 4 hours. First, note that the
GSFC temperatures are in excellent agreement (< 1 K) with OHP from 4.6 to 1 mbar, above which it is increasingly warmer, by up to 3.5 K at 0.1 mbar, which is still quite reason-