HAL Id: inserm-02181772
https://www.hal.inserm.fr/inserm-02181772
Submitted on 12 Jul 2019
HAL is a multi-disciplinary open access archive for the deposit and dissemination of sci-entific research documents, whether they are pub-lished or not. The documents may come from teaching and research institutions in France or abroad, or from public or private research centers.
L’archive ouverte pluridisciplinaire HAL, est destinée au dépôt et à la diffusion de documents scientifiques de niveau recherche, publiés ou non, émanant des établissements d’enseignement et de recherche français ou étrangers, des laboratoires publics ou privés.
peripheral artery disease assessed by
computed-tomography angiography
Olivier Stivalet, Anita Paisant, Dihia Belabbas, Loukman Omarjee, Alexis Le
Faucheur, Philippe Landreau, Ronan Garlantezec, Vincent Jaquinandi, David
Liedl, Paul Wennberg, et al.
To cite this version:
Olivier Stivalet, Anita Paisant, Dihia Belabbas, Loukman Omarjee, Alexis Le Faucheur, et al.. Ex-ercise testing criteria to diagnose lower extremity peripheral artery disease assessed by
computed-tomography angiography. PLoS ONE, Public Library of Science, 2019, 14 (6), pp.e0219082.
Exercise testing criteria to diagnose lower
extremity peripheral artery disease assessed
by computed-tomography angiography
O. Stivalet1,2, A. Paisant3, D. Belabbas3, L. Omarjee1,4, A. Le Faucheur5,6, P. Landreau1, R. Garlantezec5, V. Jaquinandi1,5, D. A. Liedl7, P. W. Wennberg7, G. Mahe´ID1,5,7*
1 Vascular Medicine Unit, CHU Rennes, Rennes, France, 2 Vascular Medicine, CH de Saint Malo, Saint-Malo, France, 3 Radiology Department, CHU Rennes, Rennes, France, 4 Vascular Medicine Unit, CH de Redon, Redon, France, 5 Univ Rennes; INSERM CIC, Rennes, France, 6 Ecole Normale Supe´ rieure, Bruz, France, 7 Gonda Vascular Center, Mayo Clinic, Rochester, MN, United States of Amerca
Abstract
Background
The sensitivity and specificity of exercise testing have never been studied simultaneously against an objective quantification of arterial stenosis. Aims were to define the sensitivity and specificity of several exercise tests to detect peripheral artery disease (PAD), and to assess whether or not defined criteria defined in patients suspected of having a PAD show a difference dependent on the resting ABI.
Methods
In this prospective study, consecutive patients with exertional limb pain referred to our vas-cular center were included. All patients had an ABI, a treadmill exercise-oximetry test, a sec-ond treadmill test (both 10% slope; 3.2km/h speed) with post-exercise pressures, and a computed-tomography-angiography (CTA). The receiver-operating-characteristic curve was used to define a cut-off point corresponding to the best area under the curve (AUC; [CI95%]) to detect arterial stenosis�50% as determined by the CTA.
Results
Sixty-three patients (61+/-11 years-old) were included. Similar AUCs from 0.72[0.63–0.79] to 0.83[0.75–0.89] were found for the different tests in the overall population. To detect arte-rial stenosis�50%, cut-off values of ABI, post-exercise ABI, post-exercise ABI decrease, post-exercise ankle pressure decrease, and distal delta from rest oxygen pressure (DROP) index were�0.91,�0.52,�43%,�20mmHg and�-15mmHg, respectively (p<0.01). In the subset of patients with an ABI>0.91, cut-off values of post-exercise ABI decrease (AUC = 0.67[0.53–0.78]), and DROP (AUC = 0.67[0.53–0.78]) were�18.5%, and�-15mmHg respectively (p<0.05). a1111111111 a1111111111 a1111111111 a1111111111 a1111111111 OPEN ACCESS
Citation: Stivalet O, Paisant A, Belabbas D,
Omarjee L, Le Faucheur A, Landreau P, et al. (2019) Exercise testing criteria to diagnose lower extremity peripheral artery disease assessed by computed-tomography angiography. PLoS ONE 14 (6): e0219082.https://doi.org/10.1371/journal. pone.0219082
Editor: Xianwu Cheng, Nagoya University, JAPAN Received: December 31, 2018
Accepted: June 15, 2019 Published: June 27, 2019
Copyright:© 2019 Stivalet et al. This is an open access article distributed under the terms of the
Creative Commons Attribution License, which permits unrestricted use, distribution, and reproduction in any medium, provided the original author and source are credited.
Data Availability Statement: Data are available on
request, provided that approval from the Ethics Committee from the University Hospital of Rennes is given. This is because it was stated in the application to the ethical board, as well as in the information to the study participants, that data are kept confidential and only accessible for the researchers responsible for the study. Requests may be sent to the corresponding author or to the Regional Ethics Committee from the University Hospital of Rennes. The address for such a request is: Comite´ d’e´thique, CHU Rennes, 2 Av. H le
Conclusion
Resting ABI is as accurate as exercise testing in patients with exertional limb pain. Specific exercise testing cut-off values should be used in patients with normal ABI to diagnose PAD.
Introduction
Peripheral artery disease (PAD) affects more than 200 million people worldwide.[1] The ankle brachial index at rest (ABI) is the ratio of the highest systolic blood pressure measured in each ankle to the highest systolic blood pressure measured in the arms. [2,3] This is the main clinical test recommended by the guidelines of the American Heart Association (AHA) to diagnose the presence and severity of PAD regardless of the symptoms presented by patients.[4]
For intermittent claudication (exertional limb pain that is relieved by rest), it has been sug-gested that exercise or post-exercise assessments (ABI, Doppler waveforms analysis) could be better than resting investigations to detect stenosis that are hemodynamically silent at rest but significant during exercise. According to AHA recommendations the ABI should be the first line tool to diagnose PAD. [5] In case of normal ABI and strongly suspected of having a PAD, the AHA statement proposed two different post-exercise criteria to diagnose PAD; either a post-exercise ABI decrease > 20% or a post-exercise pressure decrease > 30mmHg. We have shown previously that these criteria are of concern for several reasons: i) they do not identify PAD the same patients [6]; ii) they were established without quantifying the degree of arterial stenosis anatomically; iii) the exercise protocols utilized in those studies are now uncommon; iv) they were defined on subjects without reference to the ABI whereas AHA stated that they should be used in patients with ABI > 0.90. It is unlikely that post-exercise findings are similar in patients suspected of having a PAD with ABI > 0.90 compared to the findings in patients regardless of the ABI. Moreover, an updated exercise protocol used for exercise-oximetry (exercise-TcPO2) has been developed.[7,8] In our previous study we have confirmed in 34 patients included from 2014 to 2015 the accuracy of exercise TcPO2 to diagnose arterial steno-sis.[8] However, in this study the accuracies of the other classical tests (ABI and post-exercise ABI) were not studied. Furthermore, the accuracy of exercise TcPO2 to diagnose arterial ste-nosis in patients with normal ABI is unknown.
To date, no study has been performed that simultaneously defines the sensitivity and speci-ficity of multiple exercise tests and parameters (post-exercise ABI decrease, post-exercise pres-sure decrease, and exercise-TcPO2) in patients with exertional-limb pain regardless of the ABI against the degree of stenosis. Therefore, the aims of this study were i) to define optimal cut-off value for exercise tests with their sensitivity and specificity to detect arterial stenosis as quantified by CTA; ii) to assess whether or not defined criteria defined in patients suspected of having a PAD show a difference dependent on the resting ABI.
Materials and methods
Study design and population
This is a monocentric study on consecutive patients referred to our vascular unit (University Hospital, Rennes, France) for exertional limb pain after a careful clinical examination.
The study was conducted from May 2016 to June 2017 and approved by an institutional review board from the University Hospital of Rennes (ref. 17.12). All participants gave written informed consent. The study protocol conforms to the ethical guidelines of the 1975
Guilloux, 35000 Rennes or [email protected].
Funding: The authors received no specific funding
for this work.
Competing interests: The authors have declared
Declaration of Helsinki. The exercise PAD study was registered with the American National Institutes of Health database under reference n˚ NCT03186391.
In this population, we selected patients who had a CTA performed within 3 months of the exercise appointment. In our clinical practice, we systematically perform an exercise-TcPO2 followed by a second exercise test to measure the post-exercise ankle pressure and ABI. Patients unable to walk on the treadmill, or suffering cardiac pathology contraindicating a stress test were excluded.
Demographic characteristics
Variables collected included age, sex, body mass index, comorbidities, and medications (stat-ins, anti-hypertension treatment, antiplatelet, antidiabetic oral treatment or insulin).
ABI measurement
After clinical evaluation, a baseline resting ABI was performed according to AHA recommen-dations [4] using a hand-held Doppler probe (8 MHz; Basic Atys Medical, Soucieu en Jarrest, France) and a 10 cm cuff by a trained vascular medicine physician at the ankle level. In brief, the patient was at rest for 10 minutes in the supine position, relaxed, head and heels supported, in a room with comfortable temperature (21˚C).[9] The following counterclockwise sequence was used: right brachial artery, right posterior tibial artery, right dorsalis pedis artery, left pos-terior tibial artery, left dorsalis pedis artery, left brachial artery, and right brachial artery. The ABI was calculated by dividing the artery highest pressure of the limb (dorsalis pedis or poste-rior tibial pressures) by the highest arm pressure.[10]
For the brachial artery, contrary to the AHA guidelines, we used an automatic blood pres-sure monitor (Carescape Dinamap V100; GE Healthcare, Chicago, Illinois, United States of America) in order to have the same technique to measure the pressure at rest and after exercise.
Treadmill test
A treadmill test (3.2km/h, 10% slope) was used up to a maximal distance of 1053m (20 min-utes). This test was used for both the exercise-TcPO2, which was performed first, and for the post-exercise pressure measurements. A minimum of 10 minutes was required between the two exercise tests. The patients were asked to inform the physician when and where (buttock, thigh, calf or other) symptoms occurred. Exercise was stopped for both studies according to patient’s limitation.
Exercise-TcPO2 test
Briefly, measurement of TcPO2 was performed using calibrated TcPO2 electrodes (TCOM/ TcPO2; PF 6000TcPO2/CO2 Unit; Perimed; Jarfalla, Sweden) as previously described. [7,11,12] Exercise was performed on a treadmill at a 10% slope and a speed of up to 3.2km/h. [11] Exercise was discontinued at the patient’s request or, by protocol, up to maximum exer-cise duration of 20 minutes. A reference electrode (chest electrode) was placed between the scapulae to measure systemic changes in TcPO2 during exercise. One electrode was positioned on each buttock, 4 to 5 cm behind the bony prominence of the trochanter, and one electrode on each calf.[11] The measurements from the TcPO2 electrodes were used to calculate the delta from rest oxygen pressure (DROP) index which was expressed in mmHg and was recorded in real time by the in-house Oxymonitor Software as previously described.[12,13]
Results of exercise-TcPO2 were analyzed without knowledge of CTA results. Right distal DROP allows the detection of flow-reducing lesions in the following arteries; the aorta, the
right common iliac artery, the right external iliac artery, the right common femoral artery, the right superficial femoral artery, and the right popliteal artery. Left distal DROP allows the detection of flow-reducing lesions in the following arteries; the aorta, the left common iliac artery, the left external iliac artery, the left common femoral artery, the left superficial femoral artery, and the left popliteal artery.[12] A recent study has shown that exercise-TcPO2 using a minimal DROP value is accurate to diagnose arterial stenoses of � 50% assessed by computed tomography angiography (CTA) as a gold standard that confirmed previous results.[8]
Post-exercise pressure and post-exercise ABI measurements
Two technicians performed the measurements: one at the brachial level with the automatic blood pressure device and one at the limb level with the handheld Doppler.
Post-exercise brachial pressure was assessed on the same artery as used for the ABI mea-surement. When the ABI was measured, a black pen was used to mark the skin area where the highest limb pressure had been recorded with a hand-held Doppler. Following exercise, we were sure that we were on the correct area to perform the post-exercise pressure measurement. If there was no arterial flow detected the pressure were recorded as 0 mmHg.[14] The highest ankle pressure of each limb at rest was assessed, beginning with the more symptomatic limb. Post-exercise pressures were assessed within 1 minute after the termination of walking.
Arterial stenosis quantification using CTA
CTA was performed in all subjects within 3 months before or after the post-exercise ABI and exercise-TcPO2 measurements. CTA was performed with a 64-slice CT scanner (Discovery CT 750 High Definition; GE Healthcare, Milwaukee, WI, USA), 100-kV tube voltage and an automatic modulation of mAs (80–500 mAs). The scanning range was planned with a scout view and included the entire vascular tree from the abdominal aorta to ankles. A total of 120 mL or 1.5ml/kg of iobitridol 350 mgI/ml (Xenetix, Guerbet, Roissy, France) was administered with an automated injector at a flow rate of 4 mL/sec. There was systematically a 3D MIP reconstruction (Maximum Intensity Projection) and a 2D multiplanar reconstruction (MPR). CTA data were transferred to a computer workstation (Advantage Workstation, AW 4.6; GE Medical Systems) for analysis. The reformatted 1.25-mm axial images, multiplanar reformats and Vessel Analysis software (GE Healthcare, Milwaukee, WI, USA) were used to determine the grade of stenosis. The normal diameter of the artery was measured proximal to the steno-sis. The patient’s referring doctor ordered CTA at his or her discretion. CTA, used as gold standard, was performed to detect luminal arterial stenosis in each patient in our facility. Sig-nificant stenosis (� 50% of the diameter) at each artery level (aorta, common iliac artery, exter-nal iliac artery, common femoral artery, superficial femoral artery, popliteal artery on both sides) were reported by two blinded radiologists (AP and DB) who were unaware of the results of the exercise appointment. In case of variability higher than 10% for � 50% stenosis between the two radiologists, a new interpretation was performed with both. The percent stenosis was calculated as follows by each physician: 100 x [1 –(diameter of the lumen at the site of the ste-nosis/diameter of the normal lumen)]. Finally, the degree of stenosis at each artery level used for the statistical analysis was calculated as the mean of the quantification performed by both physicians or in the case of a third interpretation, a third measurement was used.
Statistical analyses
Sample size calculation. A sample size of 26 was estimated with 13 having the condition
PAD (arterial stenosis � 50%) and a sample size of 13 without the condition. An 80% power and 0.05% significance level were used to show a significant difference when comparing the
area under the ROC curve (AUC) to a reference value for discrete response when the AUC under the null hypothesis is 0.500 and the AUC under the alternative hypothesis is 0.800.
Data analysis. Results are expressed as mean± standard deviation in the case of normal distribution (Shapiro-Wilk test) or in median [25thcentile; 75thcentile] in the other cases. Receiving Operating Characteristic curves were used to study the relationship among: i) ABI and degrees of arterial stenosis; exercise ABI and degrees of arterial stenosis; iii) post-exercise ABI decrease and degrees of arterial stenosis; iv) post-post-exercise pressure decrease and degrees of arterial stenosis; and v) TcPO2 values (DROP) and degrees of arterial stenosis assessed using CTA.[8] The minimal DROP value at each calf site was used for the analysis. The DROP was the combination of the right and left distal DROP values. ROC curve analysis is based on calculating the sensitivity and specificity of a test for each value of the studied vari-able in the diagnosis of a disease state. An area under the curve (AUC) of 1.000 indicates per-fect performance of the test, whereas an AUC of 0.500 indicates no discriminatory power. ROC curve determines a cutoff value that corresponds to the highest AUC for each test. Using ABI cut-off determined in the overall population, we performed a second ROC curve analysis to propose updated cut-offs for all exercise tests. Finally, additional analyses were performed to study if potential confounders could influence the conclusions. Indeed, for each test (with the corresponding cut off), we used multivariate logistic regression with a stepwise selection (p = 0.10) to adjust for potential confounders: sex, antihypertensive treatment (yes, no), diabe-tes (yes, no), dyslipidemia (yes, no) and tobacco habit (never, former, current). Statistical anal-yses were performed with MedCalc 12.6.1.0 software (MedCalc Software, Mariakerke,
Belgium). For all statistical tests, a two-tailed probability level of p < 0.05 was used to indicate statistical significance.
Results
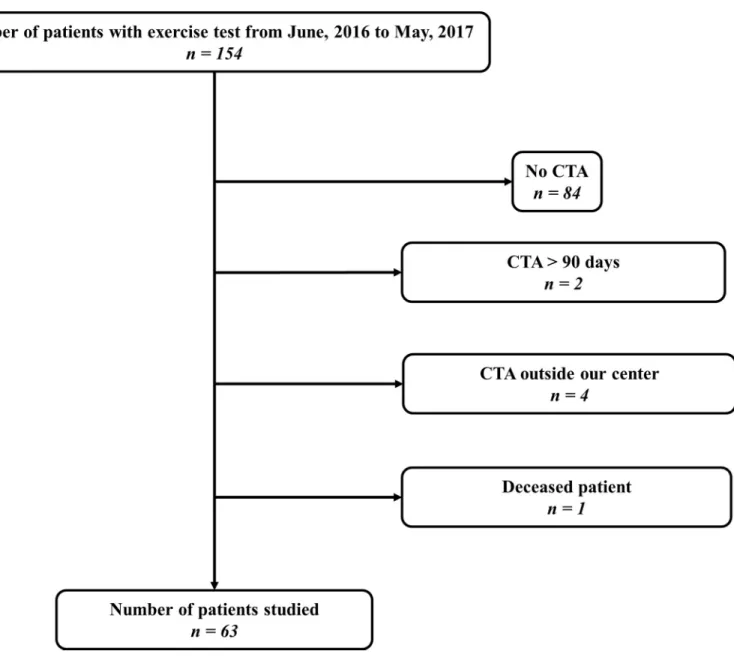
Among 154 patients, 63 patients (83% men) met all criteria to be included in this prospective study (Fig 1). Study population characteristics and those from the subset of patients’ with at least one limb with an ABI > 0.91 (n = 39 subjects) are listed inTable 1.
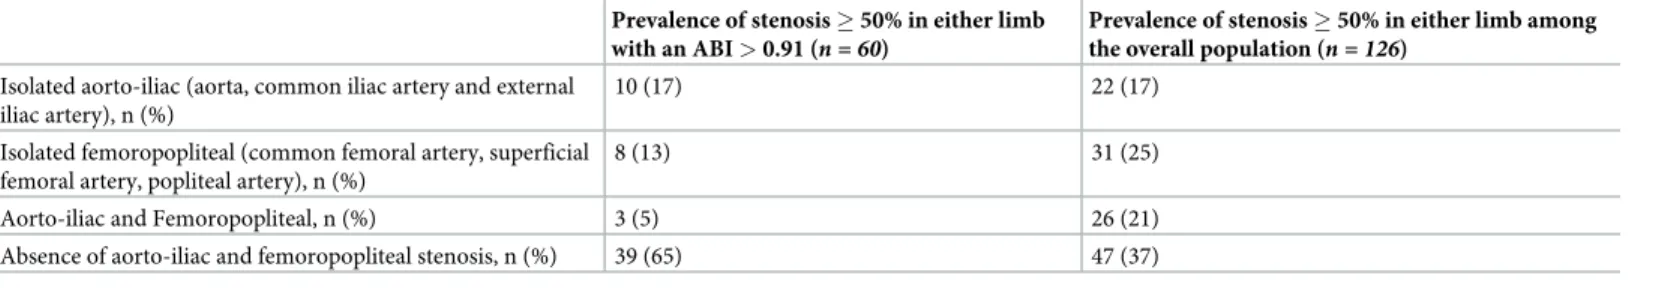
Table 2describes the prevalence and the anatomic level of stenosis � 50% detected with CTA in our study population.
Fig 2(panel A) shows the ROC curves analysis, for the overall population (n = 126 limbs),
that allows to determine a cutoff value that corresponds to the highest AUC for each test.
Table 3shows for the overall population, test characteristics (ABI, exercise ABI, post-exercise ABI decrease from ABI; post-post-exercise ankle pressure decrease from resting ankle pres-sure, DROP) to detect arterial stenosis � 50%.
For the overall population, all tests (ABI, post-exercise ABI, post-exercise ABI decrease, post-exercise pressure decrease and DROP) were statistically significant to detect arterial stenosis � 50%. The test with the highest AUCs to detect arterial stenosis � 50% was the ABI (Table 3).
Fig 2(panel B) shows the ROC curves analysis, for the population with an ABI > 0.91 (n = 60 limbs), that allows to determine for each test a cutoff value that corresponds to the
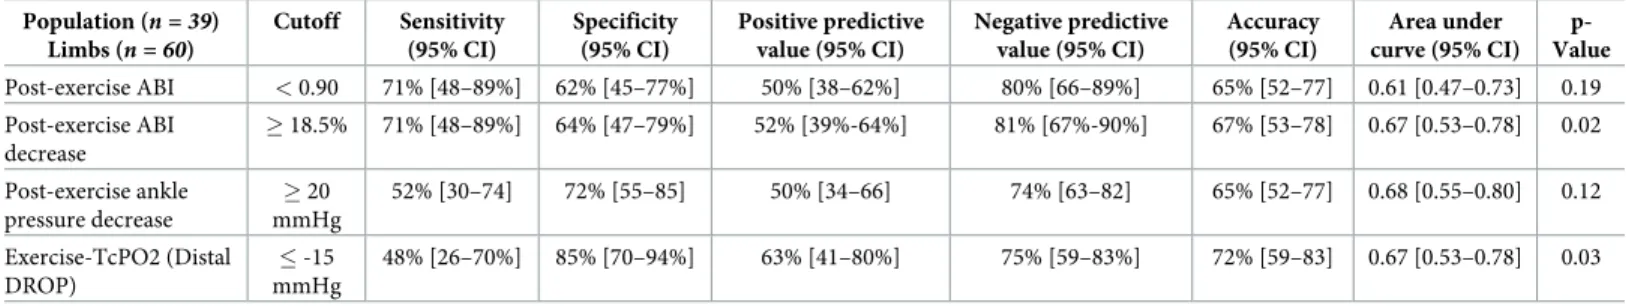
highest AUC.Table 4shows exercise test characteristics of each exercise test in the population with an ABI > 0.91. In these subsets of patients, the AUCs of post-exercise ABI and post-exer-cise ankle pressure decrease � 20mmHg were not statistically significant to detect arterial ste-nosis whereas statistical significances were obtained for post-exercise ABI decrease, and DROP with similar AUCs.
Supplemental population characteristics for the both treadmill tests are listed inS1 Table. Test characteristics of the post-exercise AHA criteria in our population are listed inS2 Table.
After multivariate logistic regression with a stepwise selection to adjust for potential con-founders: sex, antihypertensive treatment, diabetes, dyslipidemia, and tobacco habit (never, former, current), our criteria for each exercise test was not modified since none of the covari-ates mentioned above were included in the final model (S3andS4Tables).
Discussion
This study is the first to simultaneously determine the sensitivities and specificities of ABI and multiple exercise tests to detect arterial stenosis � 50% assessed by CTA. We confirm that ABI has a similar AUC to detect arterial stenosis as exercise testing and show that the cri-teria defined in an overall population (all ABI values) cannot be used in patients with an ABI > 0.91.
Fig 1. Flow chart. CTA, Computed tomography angiography. https://doi.org/10.1371/journal.pone.0219082.g001
The AHA guidelines and recent PAD guidelines recommend an ABI as a first line tool to detect PAD.[10,15] Our results confirm that even in patients with exertional limb symptoms and suspected of having a PAD, post-exercise ABI and exercise-TcPO2 testing have similar AUCs as the ABI. Our results are similar to Ourielet al. showing that ABI has a similar AUC
Table 1. Population characteristics.
Overall population (n = 63)
Subjects with at least one limb with an ABI > 0.91 (n = 39)
Age, years, mean (standard deviation) 61 (+/- 11) 61 (+/- 11)
Men, n (%) 52 (83) 30 (70)
Body mass index, kg/m2, mean (standard deviation) 27.1 (+/- 5.5) 26.7 (+/- 5.7)
Maximal walking distance self-reported, meter, median (25thpercentile, 75th percentile)
400 (200–850) 500 (200–1000) Ankle-brachial index, mean, (standard deviation) 0,87 (+/- 0.28) 1,09 (+/- 0.18) Smoker (current smoker), n (%) 24 (46) 13 (33) History of smoking, n (%) 29 (38) 20 (51) Hypercholesterolemia, n (%) 45 (71) 25 (64) Diabetes mellitus type 2, n (%) 16 (25) 8 (21) Diabetes mellitus type 1, n (%) 0 (0) 0 (0) Peripheral artery vascular revascularization�, n (%) 41 (65) 12 (31)
Hypertension, n (%) 42 (67) 26 (67)
Systolic blood pressure, mean, (standard deviation) (mmHg) 145 (+/-22) 146 (+/-19) Diastolic blood pressure, mean, (standard deviation) (mmHg) 75 (+/-10) 75 (+/-10) Coronary artery disease, n (%) 16 (25) 11 (28)
Prior stroke, n (%) 10 (16) 7 (18)
Statins, n (%) 34 (54) 23 (59)
Antihypertensive treatment, n (%) 46 (73) 27 (69)
Diuretics, n (%) 19 (30) 12 (31)
Angiotensin Converting Enzyme Inhibitors, n (%) 24 (38) 16 (41) Angiotensin II receptor antagonists, n (%) 11 (18) 5 (13) Calcium channel blockers, n (%) 23 (37) 11 (28)
Betablockers, n (%) 19 (30) 14 (36)
Antiplatelets, n (%) 54 (86) 31 (80)
Oral anti-diabetics treatment, n (%) 15 (24) 7 (18) ABI, Ankle-brachial index
�Peripheral artery = Vascular surgery from aorta and/or more distal iliac or leg arteries.
https://doi.org/10.1371/journal.pone.0219082.t001
Table 2. Prevalence and anatomic level of stenosis � 50% in either limb.
Prevalence of stenosis � 50% in either limb with an ABI > 0.91 (n = 60)
Prevalence of stenosis � 50% in either limb among the overall population (n = 126)
Isolated aorto-iliac (aorta, common iliac artery and external iliac artery), n (%)
10 (17) 22 (17)
Isolated femoropopliteal (common femoral artery, superficial femoral artery, popliteal artery), n (%)
8 (13) 31 (25)
Aorto-iliac and Femoropopliteal, n (%) 3 (5) 26 (21) Absence of aorto-iliac and femoropopliteal stenosis, n (%) 39 (65) 47 (37) ABI, Ankle-brachial index.
as post-exercise measurements.[5] From a clinical point of view, it reinforces the ABI as a first line test in patients with exertional limb pain suspected of having a PAD.[16]
According to the AHA, a post-exercise ABI decrease of > 20% from the resting value or post-exercise pressure decrease from resting value of > 30mm Hg are recommended to con-firm the diagnose PAD (Class IIa; Level of Evidence A).[5,17,18] These criteria have been sug-gested by Ouriel et al. and Laing and Greenhalgh.[5,17] In both studies, these criteria were defined in patients without a defined ABI. Our results show that a cut-off defined in an overall population cannot be used in a population with a specific ABI value. Indeed, to detect an arte-rial stenosis � 50%, the post-exercise ABI decrease is � 43% in the overall population whereas
Fig 2. ROC curves of the different tests to diagnose arterial stenosis � 50% in the overall population (n = 126 limbs) (A) and in the population with an ABI > 0.91
(n = 60 limbs) (B). Blue curve is ABI; Green curve post exercise ABI decrease; Orange post-exercise ankle pressure decrease; Green curve (incomplete line) exercise
TcPO2 (DROP); Pink curve: post-exercise ABI.
https://doi.org/10.1371/journal.pone.0219082.g002
Table 3. Test characteristics for identifying stenosis � 50% in any limb from aorta till popliteal artery in the overall population (n = 126 limbs).
Population (n = 63) Limbs (n = 126) Cutoff Sensitivity (95% CI) Specificity (95% CI) Positive predictive value (95% CI) Negative predictive value (95% CI) Accuracy (95% CI) Area under curve (95% CI) p-Value ABI � 0.91 73% [62–83] 83% [69–92] 88% [79–93] 65% [56–73] 77% [69–84] 0.83 [0.75–0.89] <0.01 Post-exercise ABI � 0.52 67% [56–77] 89% [77–97] 91% [82–96] 62% [54–69] 75% [67–83] 0.82 [0.75–0.87] <0.01 Post-exercise ABI decrease � 43% 57% [45–68] 89% [77–97] 90% [79–96] 55% [49–62] 69% [60–77] 0.79 [0.71–0.86] <0.01 Post-exercise ankle pressure decrease � 20 mmHg 71% [60–81] 66% [51–79] 78% [70–84] 57% [48–67] 69% [60–77] 0.72 [0.63–0.79] <0.01 Exercise-TcPO2 (Distal DROP) � -15 mmHg 76% [65–85] 79% [64–89] 86% [77–91] 66% [56–75] 77% [69–84] 0.78 [0.69–0.85] <0.01
ABI, Ankle-brachial index; TcPO2, Transcutaneous oxygen pressure measurements.; DROP, Delta from rest oxygen pressure; CI: Confidence Interval.
the cut-off is � 18.5% in the subset of patients with an ABI > 0.91. The higher decrease of post-exercise ABI in a population containing patients with an abnormal ABI is not surprising and was suggested by the papers from Ourielet al. and Laing and Greenhalgh that showed that
the more patients are diseased the more the decrease of the post-exercise ABI or ankle pressure are.[5,17]
Our study suggests updated post-exercise ABI criterion and has several strengths when compared to previous studies.[5,17] First, arterial stenosis quantification was objectively per-formed when compared to the study conducted by Ourielet al. in which no degree of stenosis
was reported.(5] Second, in the present study, the subjects’ characteristics are well-defined with only patients with exertional limb pain included whereas in the Ourielet al. paper,
patients with exertional limb pain and patients with rest pains, ulcers and gangrene were stud-ied.[5] Third, the tests used by Ourielet al. (2.4 km/h and 7% grade up to pain) and by Laing
and Greenhalgh (4 km/h and 10% during 1 minute) are very specific and are rarely performed. In the current study we used a treadmill speed and incline (3.2km/h and 10%) performed more widely as a clinical routine.[5,19]
Another interesting point is that it is the first time that exercise-TcPO2 and post-exercise pressure or post-exercise ABI measurements have been performed in the same study. In the subset of patients with an ABI > 0.91, this study finds that AUCs were similar between post-exercise ABI decrease (0.67 [0.53–0.78]) and the DROP (0.67 [0.53–0.78]) meaning that either technique can be used to detect PAD. Due to time and technical constraints when performing exercise-TcPO2, our study suggests that post-exercise pressure measurement should be per-formed first to diagnose PAD in patients with an ABI > 0.91 and suspected of having a PAD. However it has been shown that exercise-TcPO2 is useful in the case of patients with proximal claudication, patients with non or poorly compressible arteries (ABI > 1.40) or in the case of suspected exercise induced hypoxemia.[20–24]
A recent study published by Adayet al. in 2018 (n = 199 subjects) suggests that post-exercise
ABI criteria < 0.90 has a statistically significant sensitivity and specificity higher than the post-exercise AHA criteria.[25] In our study, the post-exercise ABI criterion is statistically not sig-nificant, probably due to a lack of power of our study (n = 39 subjects). Another study should be performed to compare post-exercise ABI criterion < 0.90 and post-exercise ABI
decrease � 18.5% or a combination of them to diagnose PAD.
Finally, the current study confirms that a DROP cut-off of -15mmHg is accurate to diag-nose arterial stenosis in patients suspected of PAD.[7,8] It is important to note that the AUCs are not high in this study and a fair question remains; what is the optimal treadmill workload to be used for patients suspected of having a PAD?
Table 4. Exercise test characteristics for identifying stenosis � 50% in any limb among the 60 limbs with normal ABIs (> 0.91). Population (n = 39) Limbs (n = 60) Cutoff Sensitivity (95% CI) Specificity (95% CI) Positive predictive value (95% CI) Negative predictive value (95% CI) Accuracy (95% CI) Area under curve (95% CI) p-Value Post-exercise ABI < 0.90 71% [48–89%] 62% [45–77%] 50% [38–62%] 80% [66–89%] 65% [52–77] 0.61 [0.47–0.73] 0.19 Post-exercise ABI decrease � 18.5% 71% [48–89%] 64% [47–79%] 52% [39%-64%] 81% [67%-90%] 67% [53–78] 0.67 [0.53–0.78] 0.02 Post-exercise ankle pressure decrease � 20 mmHg 52% [30–74] 72% [55–85] 50% [34–66] 74% [63–82] 65% [52–77] 0.68 [0.55–0.80] 0.12 Exercise-TcPO2 (Distal DROP) � -15 mmHg 48% [26–70%] 85% [70–94%] 63% [41–80%] 75% [59–83%] 72% [59–83] 0.67 [0.53–0.78] 0.03
ABI, Ankle-brachial index; TcPO2, Transcutaneous oxygen pressure measurements; DROP, Delta from rest oxygen pressure; CI: Confidence Interval.
Limits
Our study has several limitations. First, among our population of 154 patients, 63 patients have been included and 91 excluded, as shows inFig 1. Among these 91 patients excluded, the absence of CTA (n = 84) was the main cause. Indeed, the realization of a CTA was done only if
patients were strongly suspected of having a PAD. The use of the CTA was performed accord-ing to AHA recommendations.[10] Of interest, the population studied in the present study especially the patients with an ABI � 0.91 is the population that required exercise test accord-ing to AHA recommendations.[10] Second, the different tests were not randomized. For all patients we began by performing ABI, then exercise-TcPO2 and finally post-exercise pressure measurements. It was not possible to randomize the tests due to appointment time constraints. Third, it was not possible to assess the reproducibility of the different tests in the present study. However, the intra-observer coefficient of variation (CV) for the resting ABI in our vas-cular laboratory is 9.4% (typical error of the estimate is 0.06).[26,27] This variation is in the common range found in the literature.[10] The reproducibility of the exercise tests have been previously reported: Van Langenet al. found that the inter-observer variability of the ABI was
10% at rest and 21% post exercise.[28] The exercise TcPO2 reproducibility using the same pro-tocol that we used has been reported by our colleagues as excellent.[29] Finally, the inter-observer agreement of multi-detector row CT scan is considered as excellent with k values (Cohen’s k statistic).[30] Fourth, we have shown inTable 2that our population has heteroge-neous anatomical lesions. Due to a lack of power, we could not study if any of the exercise tests have greater value for a specific anatomical location compares to another. Fifth, we did not analyze infrapopliteal arterial lesions since it was not possible to quantify the degree of stenosis accurately using CT scan. While a limitation from a physiologic perspective, from a clinical perspective focus therefore is placed on more commonly re-vascularized arterial locations. Sixth, we used an automatic blood pressure monitor to assess brachial blood pressure at rest and after exercise. We recognize that the AHA guidelines recommend performing all pressure measurements with a hand-held Doppler at rest.[10] However, our objective was that pro-posed criteria are widely applicable in clinical practice, where in most facilities; only one per-son is available to perform the measurement. Indeed, Gardner and Montgomery have shown at rest, that brachial systolic blood pressure was not significantly different among the Doppler and oscillometric methods.[31] Seventh, it was possible to compare neither the accuracy of the different exercise tests to diagnose arterial stenosis � 50% nor difference of cut-off between men and women due to the small sample size. These points remain to be studied.
Conclusion
Our study shows that ABI is as accurate as exercise testing (similar AUCs) in patients with exertional limb pain. In patients with an ABI > 0.91, we suggest cut off values of post-exercise ABI decrease � 18.5%, or distal DROP � -15mmHg, which have similar AUCs, to detect PAD. An external validation of these criteria seems important to confirm our findings.
Supporting information
S1 Table. Supplemental population characteristics for both treadmill tests. ABI,
Ankle-bra-chial index. (DOCX)
S2 Table. Performance of AHA exercise criteria for identifying stenosis � 50% in any limb among the 60 limbs with normal ABIs (> 0.91). ABI, Ankle-brachial index.
S3 Table. Association between test for identifying and stenosis � 50% in any limb from aorta till popliteal artery in the overall population (n = 126 limbs) adjusted for sex,
antihy-pertensive treatment, dyslipidemia, diabetes, tobacco. OR: Odds ratio; ABI: Ankle Brachial
Index, TcPO2, Transcutaneous oxygen pressure measurements. DROP, Delta from rest oxy-gen pressure.
(DOCX)
S4 Table. Association between test for identifying and stenosis � 50% in any limb among the 60 limbs with normal ABIs (> 0.91) adjusted for sex, antihypertensive treatment, dysli-pidemia, diabetes, tobacco. OR: Odds ratio; ABI: Ankle Brachial Index, TcPO2,
Transcutane-ous oxygen pressure measurements. DROP, Delta from rest oxygen pressure. (DOCX)
Acknowledgments
We thank Meghan Craughwell from the University of Limerick who revised the paper.
Author Contributions
Conceptualization: O. Stivalet, G. Mahe´.
Data curation: O. Stivalet, A. Paisant, D. Belabbas, R. Garlantezec, G. Mahe´. Formal analysis: O. Stivalet, R. Garlantezec, G. Mahe´.
Investigation: O. Stivalet, A. Paisant, D. Belabbas, L. Omarjee, P. Landreau, V. Jaquinandi, G.
Mahe´.
Methodology: O. Stivalet, R. Garlantezec, G. Mahe´. Project administration: G. Mahe´.
Resources: O. Stivalet.
Supervision: O. Stivalet, G. Mahe´.
Validation: O. Stivalet, A. Paisant, D. Belabbas, L. Omarjee, A. Le Faucheur, P. Landreau, R.
Garlantezec, V. Jaquinandi, D. A. Liedl, P. W. Wennberg, G. Mahe´.
Writing – original draft: O. Stivalet, G. Mahe´.
Writing – review & editing: O. Stivalet, A. Paisant, D. Belabbas, L. Omarjee, A. Le Faucheur,
P. Landreau, R. Garlantezec, V. Jaquinandi, D. A. Liedl, P. W. Wennberg, G. Mahe´.
References
1. Fowkes FGR, Rudan D, Rudan I, Aboyans V, Denenberg JO, McDermott MM, et al. Comparison of global estimates of prevalence and risk factors for peripheral artery disease in 2000 and 2010: a sys-tematic review and analysis. Lancet Lond Engl. 2013 Oct 19; 382(9901):1329–40.
2. Winsor T. Influence of arterial disease on the systolic blood pressure gradients of the extremity. Am J Med Sci. 1950 Aug; 220(2):117–26. PMID:15432446
3. Grenon SM, Gagnon J, Hsiang Y. Video in clinical medicine. Ankle-brachial index for assessment of peripheral arterial disease. N Engl J Med. 2009 Nov 5; 361(19):e40.https://doi.org/10.1056/ NEJMvcm0807012PMID:19890121
4. Gerhard-Herman MD, Gornik HL, Barrett C, Barshes NR, Corriere MA, Drachman DE, et al. 2016 AHA/ ACC Guideline on the Management of Patients With Lower Extremity Peripheral Artery Disease: A Report of the American College of Cardiology/American Heart Association Task Force on Clinical Prac-tice Guidelines. Circulation. 2016 Nov 13;
5. Ouriel K, McDonnell AE, Metz CE, Zarins CK. Critical evaluation of stress testing in the diagnosis of peripheral vascular disease. Surgery. 1982 Jun; 91(6):686–93. PMID:7079971
6. Mahe G, Pollak AW, Liedl DA, Cohoon KP, Mc Carter C, Rooke TW, et al. Discordant Diagnosis of Lower Extremity Peripheral Artery Disease Using American Heart Association Postexercise Guidelines. Medicine (Baltimore). 2015 Aug; 94(31):e1277.
7. Abraham P, Picquet J, Vielle B, Sigaudo-Roussel D, Paisant-Thouveny F, Enon B, et al. Transcutane-ous oxygen pressure measurements on the buttocks during exercise to detect proximal arterial ische-mia: comparison with arteriography. Circulation. 2003 Apr 15; 107(14):1896–900.https://doi.org/10. 1161/01.CIR.0000060500.60646.E0PMID:12668524
8. Koch C, Chauve E, Chaudru S, Le Faucheur A, Jaquinandi V, Mahe´ G. Exercise transcutaneous oxy-gen pressure measurement has good sensitivity and specificity to detect lower extremity arterial steno-sis assessed by computed tomography angiography. Medicine (Baltimore). 2016 Sep; 95(36):e4522. 9. Chaudru S, de Mu¨llenheim P-Y, Le Faucheur A, Kaladji A, Jaquinandi V, Mahe´ G. Training to Perform
Ankle-Brachial Index: Systematic Review and Perspectives to Improve Teaching and Learning. Eur J Vasc Endovasc Surg. 2016 Feb; 51(2):240–7.https://doi.org/10.1016/j.ejvs.2015.09.005PMID: 26602321
10. Aboyans V, Criqui MH, Abraham P, Allison MA, Creager MA, Diehm C, et al. Measurement and inter-pretation of the ankle-brachial index: a scientific statement from the American Heart Association. Circu-lation. 2012 Dec 11; 126(24):2890–909.https://doi.org/10.1161/CIR.0b013e318276fbcbPMID: 23159553
11. Mahe´ G, Kaladji A, Le Faucheur A, Jaquinandi V. Internal Iliac Artery Stenosis: Diagnosis and How to Manage it in 2015. Front Cardiovasc Med. 2015; 2:33.https://doi.org/10.3389/fcvm.2015.00033PMID: 26664904
12. Mahe G, Kalra M, Abraham P, Liedl DA, Wennberg PW. Application of exercise transcutaneous oxygen pressure measurements for detection of proximal lower extremity arterial disease: a case report. Vasc Med Lond Engl. 2015 Jun; 20(3):251–5.
13. Poulin A, Guilcher A, Omarjee L, Jaquinandi V, Gandon Y, Mahe G, et al. Validation of a software to per-form exercise oximetry to diagnose arterial stenosis of the lower limbs. Atherosclerosis. 2018 Aug 25; 14. Mahe´ G, Jaquinandi V. [Diagnosis of lower limb peripheral artery disease]. Presse Medicale Paris Fr
1983. 2018 Jan; 47(1):47–55.
15. Gerhard-Herman MD, Gornik HL, Barrett C, Barshes NR, Corriere MA, Drachman DE, et al. 2016 AHA/ ACC Guideline on the Management of Patients With Lower Extremity Peripheral Artery Disease: A Report of the American College of Cardiology/American Heart Association Task Force on Clinical Prac-tice Guidelines. J Am Coll Cardiol. 2017 Mar 21; 69(11):e71–126.https://doi.org/10.1016/j.jacc.2016. 11.007PMID:27851992
16. Xu Dachun, Li Jue, Zou Liling, Xu Yawei, Hu Dayi, Pagoto SL, et al. Sensitivity and specificity of the ankle—brachial index to diagnose peripheral artery disease: a structured review. Vasc Med. 2010 Oct; 15(5):361–9.https://doi.org/10.1177/1358863X10378376PMID:20926495
17. Laing S, Greenhalgh RM. The detection and progression of asymptomatic peripheral arterial disease. Br J Surg. 1983 Oct; 70(10):628–30. PMID:6626925
18. Hoogeveen EK, Mackaay AJC, Beks PJ, Kostense PJ, Dekker JM, Heine RJ, et al. Evaluation of the one-minute exercise test to detect peripheral arterial disease. Eur J Clin Invest. 2008 May; 38(5):290–5. https://doi.org/10.1111/j.1365-2362.2008.01946.xPMID:18380796
19. Laing SP, Greenhalgh RM. Standard exercise test to assess peripheral arterial disease. Br Med J. 1980 Jan 5; 280(6206):13–6.https://doi.org/10.1136/bmj.280.6206.13PMID:7357254
20. Mahe´ G, Kaladji A, Le Faucheur A, Jaquinandi V. Internal Iliac Artery Disease Management: Still Absent in the Update to TASC II (Inter-Society Consensus for the Management of Peripheral Arterial Disease). J Endovasc Ther Off J Int Soc Endovasc Spec. 2016 Feb; 23(1):233–4.
21. Mahe´ G, Kaladji A, Le Faucheur A, Jaquinandi V. Internal Iliac Artery Stenosis: Diagnosis and How to Manage it in 2015. Front Cardiovasc Med. 2015; 2:33.https://doi.org/10.3389/fcvm.2015.00033PMID: 26664904
22. Abraham P, Chevalier J-M, Leftheriotis G, Saumet J-L. Lower Extremity Arterial Disease in Sports. Am J Sports Med. 1997 Jul; 25(4):581–4.https://doi.org/10.1177/036354659702500424PMID:9240995 23. Ouedraogo N, Feuilloy M, Mahe G, Leftheriotis G, Saumet J-L, Abraham P. Chest tcpO2 changes
dur-ing constant-load treadmill walkdur-ing tests in patients with claudication. Physiol Meas. 2011 Feb; 32 (2):181–94.https://doi.org/10.1088/0967-3334/32/2/003PMID:21178246
24. Bruneau A, Feuilloy M, Dussaussoy C, Gagnadoux F, Leftheriotis G, Abraham P. The walking-induced transient hack concept is valid & relies on a transient early-exercise hypoxemia. PloS One. 2013; 8(5): e62651.https://doi.org/10.1371/journal.pone.0062651PMID:23658759
25. Aday AW, Kinlay S, Gerhard-Herman MD. Comparison of different exercise ankle pressure indices in the diagnosis of peripheral artery disease. Vasc Med. 2018 Jul 11;1358863X1878172.
26. Donnou C, Chaudru S, Stivalet O, Paul E, Charasson M, Selli J-M, et al. How to become proficient in performance of the resting ankle–brachial index: Results of the first randomized controlled trial. Vasc Med. 2017 Nov 10;1358863X1774099.
27. Hopkins WG. Measures of reliability in sports medicine and science. Sports Med Auckl NZ. 2000 Jul; 30 (1):1–15.
28. van Langen H, van Gurp J, Rubbens L. Interobserver variability of ankle–brachial index measurements at rest and post exercise in patients with intermittent claudication. Vasc Med. 2009 Aug; 14(3):221–6. https://doi.org/10.1177/1358863X08101017PMID:19651671
29. Henni S, Sempore´ YW, Le Meliner T, Ouedraogo N, Hamel J-F, Abraham P. Intra-test and test-retest reliability of exercise oximetry in arterial claudication. Microvasc Res. 2018 May; 117:44–9.https://doi. org/10.1016/j.mvr.2018.01.003PMID:29325705
30. Romano M, Mainenti PP, Imbriaco M, Amato B, Markabaoui K, Tamburrini O, et al. Multidetector row CT angiography of the abdominal aorta and lower extremities in patients with peripheral arterial occlu-sive disease: diagnostic accuracy and interobserver agreement. Eur J Radiol. 2004 Jun; 50(3):303–8. https://doi.org/10.1016/S0720-048X(03)00118-9PMID:15145492
31. Gardner AW, Montgomery PS. Comparison of three blood pressure methods used for determining ankle/brachial index in patients with intermittent claudication. Angiology. 1998 Sep; 49(9):723–8. https://doi.org/10.1177/000331979804901003PMID:9756423