Deep-lake carbonates and speleothems as high-resolution archives of paleohydrology in the Bonneville Basin, UT
By
Elena Anne Steponaitis
B.A. Environmental Science
Barnard College of Columbia University, 2010
MASSACHUSETTS INSTITUTE OF TECHNOLOGY
MAR
01
2016
LIBRARIES
ARCHIVES
Submitted to the Department of Earth, Atmospheric and Planetary Sciences in partial fulfillment of the requirements for the degree of
Doctor of Philosophy at the
MASSACHUSETTS INSTITUTE OF TECHNOLOGY
February 2016
0 2016 Massachusetts Institute of Technology. All rights reserved.
Signature of Author
Signature redacted
Department of Earth, Atmospleric and Planetary Sciences December 17, 2015
Certified by
Signature redacted
David McGee Kerr-McGee Career Development Assistant Professor
7I Thesis Supervisor
Accepted by
Signature redacted
Robert D. van der Hilst
Schlumberger Professor of Earth Sciences Chair, Department of Earth, Atmospheric and Planetary Sciences
Deep-lake carbonates and speleothems as high-resolution archives of
paleohydrology in the Bonneville Basin, UT
By
Elena Anne Steponaitis
Submitted to the Department of Earth, Atmospheric and Planetary Sciences on December 17, 2015 in partial fulfillment of the requirements for the degree of
Doctor of Philosophy in Geology
Abstract
Precisely dated terrestrial paleoclimate records are indispensable for understanding how different regions respond to global-scale climate variability. Here, we focus on
developing precisely dated records from the Bonneville Basin, a large basin in the eastern
U.S. Great Basin. This region is known to have been highly sensitive to hydroclimate
changes during the past glacial period; closed-basin lakes in this region have been studied for over a century. We present lake and speleothem records from the Bonneville Basin that are anchored by high-precision U-Th ages. Deep-lake carbonates are deposits that form beneath the surface of lakes in crevices and protected spaces. We explore these deposits as an archive of past hydrological change in the Bonneville Basin. Deep-lake carbonates deposits were collected from varying elevations in the basin and
microsampled for U-Th dating. The results of this work improve constraints on existing lake level information for Lake Bonneville. Additionally, we present 6234U data from
these carbonates that records changes in weathering, and by extension, hydrology, in the Bonneville Basin. 87Sr/86Sr ratios of deep-lake carbonates reflect relative changes in fluvial input between the northern and southern sub-basins of the Bonneville Basin, allowing for the reconstruction of past precipitation patterns. This record shows that there were distinctly different patterns of atmospheric circulation over the Bonneville Basin during Heinrich Event 2 and the Last Glacial Maximum. Finally, we present records Mg/Ca ratios and 613C values of speleothems from Lehman Caves, NV, located on the
western edge of the Bonneville Basin. These records suggest that the onset of mid-Holocene drying in the Great Basin was at 8.2 ka, coincident with the collapse of the Laurentide Ice Sheet.
Thesis Supervisor: David McGee
Acknowledgements
First and foremost, I thank my adviser, David McGee, for guiding me through my work in the Bonneville Basin and beyond. David has been an outstanding and inspiring adviser and I will always be grateful for his mentorship. I am also immensely thankful for the guidance and vision of our collaborator, Jay Quade, who helped me through my first field season in Lake Bonneville and who has been a constant source of intellectual support and creativity.
I thank the members of my thesis committee: Taylor Perron, Kristin Bergmann,
and Ed Boyle, for their support and guidance. I am also very grateful for the mentorship of Sam Bowring and Tim Grove early in my Ph.D. Many individuals and organizations have contributed to this exciting project: Guleed Ali, Alexandra Andrews, Alan Hsieh, Christine Chen, Francis 0. Dudas, Adam Hudson, David Rhode, David Dettman, Wally Broecker, Bryan Shuman, Stephen Burns, Hai Cheng, and Larry Edwards have all contributed enormously. I was lucky to spend extended periods of time in the field with Guleed, Alex, and Christine; thank you for teaching me so much and putting up with me for so long! I am also very grateful for the help of the rangers and staff of Great Basin National Park, particularly Ben Roberts and Gretchen Baker; without their assistance and facilitation, much of this work would not have been possible. I thank the funding
organizations that have supported this work at various stages: NSF, the MIT EAPS Student Research Fund, the GSA Student Research Grant, and the Comer Science Foundation.
I have been fortunate over the last five and a half years to share this experience
with members of the McGee lab and the EAPS community. It has been a pleasure working with Alan Hsieh, Irit Tal, Christine Chen, and Ben Hardt. A special thank you goes to my officemate, Christopher Kinsley. I have greatly enjoyed getting to know my fellow EAPS graduate students both as scientists and as friends. Thanks to Mike S., Ben
M., Bram, Eva, Aimee, Annie, Mike E., Arthur, Niya, Yodit, Ruel, Steve, Deepak, Kate,
Ross, Claire, Roger, Ben K., Paul, Dino, and many others for your friendship and support. Vicki McKenna, Roberta Allard, and Melody Abedinejad were incredibly helpful with so many things and a pleasure to interact with. Additionally, thanks to Erin Shea, Seth Burgess, Mike Krawczynski, Noah McLean, and Terry Blackburn, who were all important mentors to me early in my Ph.D.
My family has been the most important source of support and motivation
throughout this process. I thank my parents, my sister Lily, and Jaap, as well as my extended family in the Boston area and beyond for their unwavering support.
Finally, I thank Sidney Hemming, who got me started on the right foot as an undergraduate and for whose mentorship I will always be grateful.
Table of Contents
A bstract ... 3
Table of Contents ... 5
1 Introduction... 7
1.1 R eferences... 12
2. High-resolution paleoclimate records from tufas and deep-lake carbonates in the Bonneville Basin, UT ... 14
2.1 A bstract... 14
2.2 Introduction... 14
2.3 Setting, M aterials, and M ethods... 19
2.3.1 Lake Bonneville ... 19
2.3.2 Tufa Deposits ... 22
2.3.3 D eep-Lake Carbonates... 24
2.3.4 Sam ple Collection... 27
2.3.5 Drilling Sam ples ... 27
2.3.6 U -Th D ating ... 27
2.4 R esults ... 28
2.4.1 Sam ple D escription... 28
2.4.2 U -Th ages and 6234U ... 31
2.5 D iscussion ... 35
2.5.1 Carbonate D eposition... 35
2.5.2 Stansbury Island Carbonate Record... 35
2.5.3 6234U record... 37
2.5.4 M IS 6 Lake ... 41
2.6 C onclusions... 42
2.7 R eferences... 43
3. 8 7Sr/86Sr ratios in Lake Bonneville carbonates record atmospheric circulation changes, 26-13 ka ... 47
3.1 A bstract... 47
3.2 Introduction... 48
3.2.1 Lake Bonneville Setting and H istory... 52
3.2.2 D ense Lacustrine Carbonates... 56
3.2.3 Sr isotopes and 6180 as hydroclim ate tracers... 57
3.3 M aterials and M ethods... 60
3.3.1 Sam ple Collection... 60
3.3.2 Sr isotope analyses... 60
3.3.3 Stable isotope analyses ... 61
3.3.4 U -Th analyses ... 61
3.3.5 Fluvial Input M odels... 62
3.4 R esults ... 63
3.4.2 Sr analyses, fluvial input m odels ... 63
3.4.3 6180 values... 64
3.5 D iscussion ... 67
3.5.2 Last Glacial M axim um ... 71
3.5.3 H einrich Events... 71
3.5.4 Post-Provo Lake Bonneville ... 78
3.6 Conclusions... 79
3.7 R eferences... 80
4 Mid-Holocene drying of the U.S. Great Basin recorded in Nevada speleothems .. 85
4.1 A bstract... 85
4.2 Introduction... 85
4.3 R egional setting ... 86
4.3.1 Lehm an Caves... 86
4.4 M aterials and M ethods... 86
4.4.1 Sam ple collection... 86
4.4.2 U -Th D ating of Speleothem s ... 87
4.4.3 Speleothem major and trace element measurements ... 87
4.4.4 Stable isotope analysis ... 87
4.4.5 Cave w ater and soil analyses ... 87
4.4.6 Lake level com pilation... 88
4.5 R esults ... 88
4.5.1 Sam ple description... 88
4.5.2 U -Th dating of speleothem s... 88
4.5.3 Elemental and stable isotope composition of speleothems... 88
4.6 D iscussion ... 88
4.6.6 Interpretation of elem ental records ... 88
4.6.2 Interpretation of d13C and d180 values in Lehman Caves stalagmites... 90
4.6.3 Regional hydroclimate changes from 16.4 to 3.8 ka inferred from these results ... 9 1 4.0.4 Mid-Holocene drying: comparison with regional records ... 92
4.6.5 Mechanisms for wet early Holocene conditions and mid-Holocene drying.... 93
4.7 Conclusions... 94
4.8 R eferences... 94
4.9 Supplem entary Figures ... 97
5 C onclusions... 99
6 R eferences... 101
1 Introduction
This thesis explores past hydroclimate of the Bonneville Basin, the largest sub-basin of the U.S. Great Basin. The U.S. Great Basin is a large, internally drained region of the western U.S. that covers over half a million square kilometers. Today, this region is arid; large areas of the Great Basin receive less than 20 cm of rainfall per year (DRI). Within this vast desert, there are clues pointing to a very different climatic past. For over a century, geologists have been fascinated by the abandoned lake shorelines visible all
over the Great Basin. Early scientific work in the Great Basin, including studies by G.K. Gilbert (1890) and Israel Cook Russell (1889, 1885), produced detailed accounts of these shorelines and the lakes that occupied them. However, until relatively recently, the timing of these changes in Great Basin lake levels was unclear.
The dominant source of precipitation in the Great Basin today is the westerly winter storm track (Lall and Mann, 1995). Attempts to understand how hydroclimate has changed in the Great Basin between ~30 ka and the present have focused on changes in the position of the winter storm track over North America. The dominant viewpoint is that that the Laurentide Ice Sheet deflected the storm track southward, resulting in increased precipitation and the development of large pluvial lakes (Antevs, 1952;
Bromwich et al., 2004; COHMAP Members, 1988). However, many important questions remain about this mechanism. What was the nature of storm track changes that increased precipitation in the basin during the last glacial period? How did Great Basin
hydroclimate change in response to abrupt global-scale shifts, like Heinrich Events? How much spatial variation was there in precipitation patterns within the Great Basin, and what mechanism controlled this variability? What were the mechanisms for and
timing of the large-scale drying of the Great Basin at the end of the last glacial period? At the crux of many of these questions is the ability to precisely date the hydrological shifts observed in these records, as dating allows comparison between records from around the world. Precisely dated records are crucial for establishing causal relationships and teleconnections in studies of global climate. Building on a century of rigorous
scientific inquiry into Great Basin hydroclimate, improved dating techniques have allowed scientists to better address these questions using records from closed-basin lakes and speleothems.
Closed-basin lakes are excellent indicators of past hydroclimate because lake level is controlled by the balance of evaporation and precipitation within a basin. Many of the closed sub-basins of the Great Basin contained lakes in the past. The abundant closed-basin lakes, combined with the known shift in the region's hydrology, have made the Great Basin a very exciting target for paleoclimate studies. The goal of many
paleoclimate studies in the Great Basin has heen to date the rise and fall of these
paleo-lakes. Starting in the 1950s, scientists used 14C and U-Th dating of lake deposits to
establish early lake level chronologies in for the two largest lakes in the Great Basin, Lakes Lahontan and Bonneville (e.g. Broecker and Kaufman, 1965; Broecker and Orr,
1958; Kaufman and Broecker, 1965a, 1965b). Since then, improvements in both
radiometric techniques and our understanding of lake deposits themselves has allowed these Great Basin lake level chronologies to be refined and extended (e.g. Benson, 1991,
1978; Currey, 1990; Currey et al., 1984; Oviatt, 2015; Oviatt et al., 2015, 1992; Stine, 1990, and many others).
The Bonneville Basin is located in western UT, on the eastern side of the Great Basin. Today, this basin contains the Great Salt Lake and Utah Lake in the northern portion of the basin. The southern portion of the basin hosted the smaller Sevier Lake prior to extensive water diversion for agriculture. The rise of the large Pleistocene lake known as Lake Bonneville started around 30 ka, with most of its rise occurring after 24 ka; by 19 ka, the lake had submerged much of western Utah and reached its highest level, known as the Bonneville shoreline (Currey et al., 1984; Oviatt et al., 2015, 1992, and others). At this level the lake had a surface area of ~50,000 km2 (Nelson et al., 2005), a
factor of 10 greater than the preindustrial extent of lakes in the basin. Modeling of the lake's water balance suggests that the Lake Bonneville itself may have generated considerable local precipitation within its own basin (Hostetler et al., 1994)
Sometime after 18.2 ka (Oviatt, 2015) the lake dropped ~100 m when an alluvial fan damming the basin at its highest threshold failed (Malde, 1968), dropping to what is known as the Provo shoreline. The lake may have fallen from the Provo shoreline as early as 16 ka (McGee et al., 2012; Oviatt, 2015), though the exact timing of drying remains a matter of debate (Godsey et al., 2011, 2005; Miller et al., 2013; Oviatt, 2015;
Oviatt et al., 1992). Through the Holocene, Lake Bonneville was low and fluctuations were small compared to the large lake level changes of the Pleistocene (Currey et al.,
1984; Murchison, 1989; Oviatt et al., 2015).
To date, the majority of Lake Bonneville studies have relied on interpretations of lake sediments and shoreline deposits. These existing chronologies (e.g. Oviatt, 2015) are crucial for understanding the lake's history, but precise dating of these records can be very challenging. Many events in Lake Bonneville's history that have been extensively
studied from geomorphological and sedimentological angles lack precise age control on the events themselves. This thesis explores a relatively new method for constraining the timing of paleohydrological events in the Bonneville Basin. Recently, McGee et al. (2012) introduced a new lacustrine archive: deep-lake carbonates. These deposits, which consist of crystalline aragonite and calcite, precipitate in crevices and protected spaces beneath the surface of the lake. In Lake Bonneville, McGee et al. (2012) showed that deep-lake carbonate deposits could be precisely U-Th dated and were viable recorders of lake geochemistry. Though they do not directly track shoreline ages, they are useful as they can give precisely dated constraints on minimum shoreline elevations. Additionally, deep-lake carbonates can be used to develop high-resolution geochemical records that reflect hydrologic changes in the basin. Here, we expand the scope of applications for deep-lake carbonate and apply them to the Lake Bonneville record.
The first data chapter of this thesis explores how deep-lake carbonates can be
used as a palenelimate indieatnr. The deposits~ studied1 in this chaper range in ag fri-mn
29-13 ka, spanning much of the rise and fall of Lake Bonneville. Paired U-Th analyses of
deep-lake carbonates and shoreline tufa from a variety of elevations and locations in the basin give insights into both lake level and the complex depositional histories of the deep-lake deposits. We also present a deposit that indicates a high lake level at the end of
MIS (Marine Isotope Stage) 6. In addition to constraining the timing of features of the
established Lake Bonneville hydrograph and extending existing geochemical records from the lake, this chapter represents the first study of its kind in the Great Basin and serves as a case study for future work in other lakes. Broadly, this study seeks to test the
idea that paired analyses of deep-lake carbonates and tufas can be used as robust indicators of past lake level changes.
In the next chapter, this thesis explores how isotopic records from deep-lake carbonates can be used to understand regional responses to global-scale abrupt climate
events. In this chapter, 8 7Sr/86Sr ratios and 6180 values of deep-lake carbonate reveal
large-scale changes in atmospheric circulation during Heinrich Events - pronounced coolings of the Northern Hemisphere high latitudes related to sea ice expansion in the North Atlantic - and the Last Glacial Maximum (23-19 ka). The chapter expands on previous research by Hart et al. (2004) on 87Sr/86Sr ratios of both modern surface waters
and Lake Bonneville carbonates.
The final data chapter of this thesis moves forward in time from the previous chapters, into the Holocene. In the Bonneville Basin, Holocene lake level changes were small and difficult to detect due to a very low lake (Currey et al., 1984; Murchison, 1989; Oviatt et al., 2015). However, many paleoclimate and paleoenvironmental records from the Great Basin point to important hydrologic changes during this time, including a major drying event in the mid-Holocene (see further discussion in Chapter 4). To understand
and date hydrologic changes in this region, we turn to speleothems from Lehman Caves,
NV. Speleothems are powerful tools for studying terrestrial paleoclimate because they
provide continuous geochemical records that can be precisely U-Th dated. Using speleothems from Lehman Caves, this chapter sheds light on the timing and possible causes of regional drying during the Holocene.
Precisely dated hydroclimate records allow us to understand large-scale patterns and mechanisms of climate change in the Great Basin. Together, many of these records
have just begun to shed light on the response of the western U.S. winter storm track to global-scale climate events (e.g. Munroe and Laabs, 2013; Oster et al., 2015; Putnam, 2015). The development and integration of precisely dated climate records is crucial not only for understanding the complexities of past climate, but also revealing possible hydrological responses of this highly sensitive region to future climate change.
1.1 References
Antevs, E., 1952. Cenozoic climates of the great basin. Geol. Rundschau 40, 94-108. Benson, L.V., 1991. Timing of the last highstand of Lake Lahontan. J. Paleolimnol. 5,
115-126. doi:10.1007/BF00176873
Benson, L. V., 1978. Fluctuation in the level of pluvial Lake Lahontan during the last 40,000 years. Quat. Res. 9, 300-318. doi:10.1016/0033-5894(78)90035-2
Broecker, W.S., Kaufman, A., 1965. Radiocarbon Chronology of Lake Lahontan and Lake Bonneville II, Great Basin. Geol. Soc. Am. Bull. 76, 537.
doi:10.1130/0016-7606(1965)76[537:RCOLLA]2.0.CO;2
Broecker, W.S., Orr, P.C., 1958. Radiocarbon Chronology of Lake Lahontan and Lake Bonneville. Geol. Soc. Am. Bull. 69, 1009.
doi:10.1130/0016-7606(1958)69[1009:RCOLLA]2.0.CO;2
Bromwich, D.H., Toracinta, E.R., Wei, H., Oglesby, R.J., Fastook, J.L., Hughes, T.J., 2004. Polar MM5 Simulations of the Winter Climate of the Laurentide Ice Sheet at the LGM*. J. Clim. 17, 3415-3433.
doi:10.1175/1520-0442(2004)017<3415:PMSOTW>2.0.CO;2
COHMAP Members, 1988. Climatic changes of the last 18,000 years: observations and model simulations. Science 241, 1043-52. doi:10.1l126/science.241.4869.1043 Currey, D.R., 1990. Quaternary palaeolakes in the evolution of semidesert basins, with
special emphasis on Lake Bonneville and the Great Basin, U.S.A. Palaeogeogr. Palaeoclimatol. Palaeoecol. doi:10.1016/0031-0182(90)90113-L
Currey, D.R., Atwood, G., Mabey, D.R., 1984. Major levels of Great Salt Lake and Lake Bonneville. Utah Geological Survey, Map 73.
Gilbert, G.K., 1890. Lake Bonneville. USGS.
Godsey, H.S., Currey, D.R., Chan, M.A., 2005. New evidence for an extended occupation of the Provo shoreline and implications for regional climate change, Pleistocene Lake Bonneville, Utah, USA. Quat. Res. 63, 212-223.
doi:10.1016/j.yqres.2005.01.002
Godsey, H.S., Oviatt, C.G., Miller, D.M., Chan, M. a., 2011. Stratigraphy and chronology of offshore to nearshore deposits associated with the Provo shoreline, Pleistocene Lake Bonneville, Utah. Palaeogeogr. Palaeoclimatol. Palaeoecol. 310, 442-450. doi:10.1016/j.palaeo.2011.08.005
Hart, W.S., Quade, J., Madsen, D.B., Kaufman, D.S., Oviatt, C.G., 2004. The 87Sr/86Sr ratios of lacustrine carbonates and lake-level history of the Bonneville paleolake
Hostetler, S.W., Giorgi, F., Bates, G.T., Bartlein, P.J., 1994. Lake-Atmosphere Feedbacks Associated with Paleolakes Bonneville and Lahontan. Science (80-. ). 263, 665-668. doi:10.1 126/science.263.5147.665
Kaufman, A., Broecker, W., 1965a. Comparison of Th 230 and C 14 ages for carbonate materials from lakes Lahontan and Bonneville. J. Geophys. Res. 70, 4039-4054. doi: 10.1029/JZ070iO16p04039
Kaufman, A., Broecker, W.S., 1965b. Radiocarbon Chronology of Lake Lahontan and Lake Bonneville II, Great Basin. GSA Bull. 76, 537-566.
Lall, U., Mann, M., 1995. The Great Salt Lake: A Barometer of Low-Frequency Climatic Variability. Water Resour. Res. 31, 2503-2515. doi:10.1029/95WR01950
Malde, H.E., 1968. The Catastrophic Late Pleistocene Bonneville Flood in the Snake River Plain, Idaho. USGS Prof. Pap. p. 52.
McGee, D., Quade, J., Edwards, R.L., Broecker, W.S., Cheng, H., Reiners, P.W., Evenson, N., 2012. Lacustrine cave carbonates: Novel archives of paleohydrologic change in the Bonneville Basin (Utah, USA). Earth Planet. Sci. Lett. 351-352,
182-194. doi:10.1016/j.epsl.2012.07.019
Miller, D.M., Oviatt, C.G., Mcgeehin, J.P., 2013. Stratigraphy and chronology of Provo shoreline deposits and lake-level implications, Late Pleistocene Lake Bonneville, eastern Great Basin, USA. Boreas 42, 342-361. doi:10.1
111/j.1502-3885.2012.00297.x
Murchison, S.B., 1989. Fluctuation History of Great Salt Lake, Utah During the Last
13,000 Years. University of Utah.
Nelson, S.T., Wood, M.J., Mayo, A.L., Tingey, D.G., Eggett, D., 2005. Shoreline tufa and tufaglomerate from Pleistocene Lake Bonneville, Utah, USA: stable isotopic and mineralogical records of lake conditions, processes, and climate. J. Quat. Sci.
20, 3-19. doi:10.1002/jqs.889
Oviatt, C.G., 2015. Chronology of Lake Bonneville, 30,000 to 10,000 yr B.P. Quat. Sci. Rev. 110, 166-171. doi:10.1016/j.quascirev.2014.12.016
Oviatt, C.G., Currey, D.R., Sack, D., 1992. Radiocarbon chronology of Lake Bonneville, Eastern Great Basin, USA. Palaeogeogr. Palaeoclimatol. Palaeoecol. 99, 225-241.
doi:10.1016/0031-0182(92)90017-Y
Oviatt, C.G., Madsen, D.B., Miller, D.M., Thompson, R.S., McGeehin, J.P., 2015. Early Holocene Great Salt Lake, USA. Quat. Res. 84, 57-68.
doi:10.1016/j.yqres.2015.05.001
Russell, I.C., 1889. The Quaternary history of Mono Valley, California. U.S. Government Printing Office.
Russell, I.C., 1885. Geological history of Lake Lahontan, a Quaternary lake in northwestern Nevada. USGS Monograph 11.
Stine, S., 1990. Late holocene fluctuations of Mono Lake, eastern California. Palaeogeogr. Palaeoclimatol. Palaeoecol. 78, 333-381. doi:10.1016/0031-0182(90)90221-R
2. High-resolution paleoclimate records from tufas and
deep-lake carbonates in the Bonneville Basin, UT
2.1 Abstract
Precisely dated hydroclimate records from closed basin lakes are invaluable tools for understanding terrestrial paleoclimate. In this study, U-Th ages from shoreline tufas and deep-lake carbonates form the core of a powerful new approach for studying past lake level and lake chemistry. A U-Th-dated deep-lake carbonate record developed from samples from a range of elevations clearly shows the transgression of Lake Bonneville beginning around 30 ka, in agreement with existing records. In addition to showing broader-scale changes in lake level, our record improves existing constraints on the age of the Stansbury Oscillation. 6234U values of deep-lake carbonates and tufas agree with a
previously published record (McGee et al., 2012) and extend the record back in time, showing a possible early wet period in the lake at or just before 28 ka. Finally, we present evidence from a shoreline tufa of a large lake in the Bonneville Basin around 134 ka, corresponding to the penultimate deglaciation. Our records from deep-lake
carbonates and tufas show the importance of microsampling lake carbonate to reveal their complex depositional histories. Importantly, these results show that transgressional tufa deposits may contain deep-lake cements and should thus be treated with caution when sampled for radiometric dating.
2.2 Introduction
The Bonneville Basin of western Utah (Figure 1) is the largest sub-basin of the
parts of Utah, California, Nevada, Idaho, Wyoming, and Oregon. Between ~30 ka and 19 ka, Lake Bonneville grew to submerge a -55,000 km2 area of western UT (Oviatt et al.,
1992). This lake has long been the subject of study due to its potential as a
paleohydrology archive; in closed-basin lakes, lake level is directly related to the balance of evaporation and precipitation within a basin. The large meridional extent of the Bonneville Basin, over 5' latitude, makes it an excellent recorder of large-scale
precipitation changes in the Great Basin. Though the lake's past extent is relatively easy to measure because of well-preserved shorelines located throughout the basin,
exploration of the causes and rates of past lake level changes requires precise and accurate dating.
This study documents the rise of Lake Bonneville using a relatively new archive for studying lake hydrology changes: deep-lake carbonates. These deposits form deep beneath the surface of the lake in submerged caves, bedrock crevices, and other dark, protected spaces. Though they are not formed near the surface of the lake, deep-lake carbonates provide a minimum elevation of the lake surface and can record lake level oscillations (McGee et al., 2012). The deposits also provide nearly continuous, centennial-scale records of Lake Bonneville's chemistry (e.g., Mg/Ca, Ba/Ca) and isotopic (e.g., 0, Sr, U) composition. Previous characterization of crystalline deep-lake deposits is limited to a single study (McGee et al., 2012). The deposits studied by McGee et al. (2012) were the thickest, best deposits in the Bonnevile Basin and could only be found in two locations near the center of the basin at very similar elevations. Though they are extremely useful for developing precisely dated geochemical records, the thick (> 5 cm) deep-lake carbonates studied by McGee et al. (2012) are rare in the
basin and thus provide little information about the lake's elevation in the past. Existing data also leave open the question of whether records of the mineralogical, geochemical and isotopic changes recorded by these deposits are reproducible at other elevations and locations.
Here, we focus on the far more abundant thin deep-lake carbonate deposits that are distributed at a wide range of elevations and locations within the basin. The
abundance of these thinner deposits allows them to provide better constraints on the elevation of the lake over time. In this study, we focus on microsampling a large number of hand samples from different elevations rather than sampling thick samples
continuously along the growth axis as was done by McGee et al. (2012). Additionally, we explore the use of shoreline tufas to constrain the timing of shoreline occupations. In many cases, deep-lake deposits are deposited within tufas as the lake rises and submerges the tufas. Microsampling both tufa and deep-lake carbonate in the same hand sample can
reveal complex depositional histories that give insight into lake-level changes.
This study utilizes high-precision U-Th dating of tufas and deep-lake carbonates to constrain the lake level record and offer new geochemical insights into past
hydroclimate changes in the basin. Tufas give very good constraints on shoreline
elevation, but U-Th dating them can be challenging and requires careful sample selection (see discussion in section 2.3.2). U-Th dating has some advantages over 4C for dating tufas. High U concentrations in aragonite facilitate higher dating precision than is possible with 14C dating. Additionally, samples can be U-Th dated past the 40-50 kyr
limit of 14C dating. Additionally, unlike in 14C dating, U-Th methods do not require that
sample much easier by allowing for drilling. Finally, U-Th dating avoids the need for a reservoir correction. In addition to giving a very direct elevation-based record that constrains minimum lake elevation over time, we use these deep-lake carbonates to develop well-dated geochemical records that can be tied directly to elevation data. The exploration of this strategy in the Bonneville Basin provides a novel case study for using deep-lake carbonates to develop paleohydrological records.
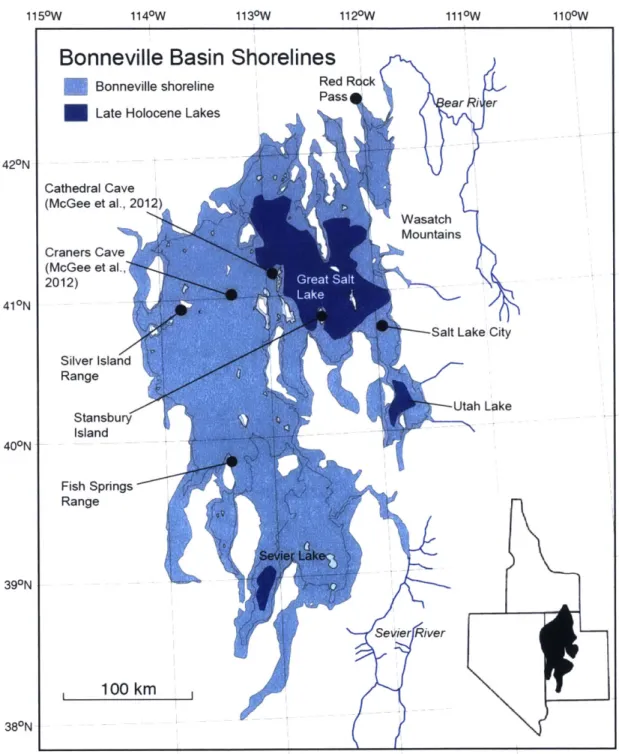
1150W 1140W 1130W 1120W 1110W 1 100W
Bonneville Basin Shorelines
Bonneville shoreline Red Rock
Late Holocene Lakes
Cathedral Cave (McGee et al., 2012) Craners Cave (McGee et al., 2012) Stansbury Island Stansbury Mountains Tule Valley ear Ri er Wasatch Mountains
Salt Lake City
Utah Lake SeVier River 420N 41ON 400N 390N 380N
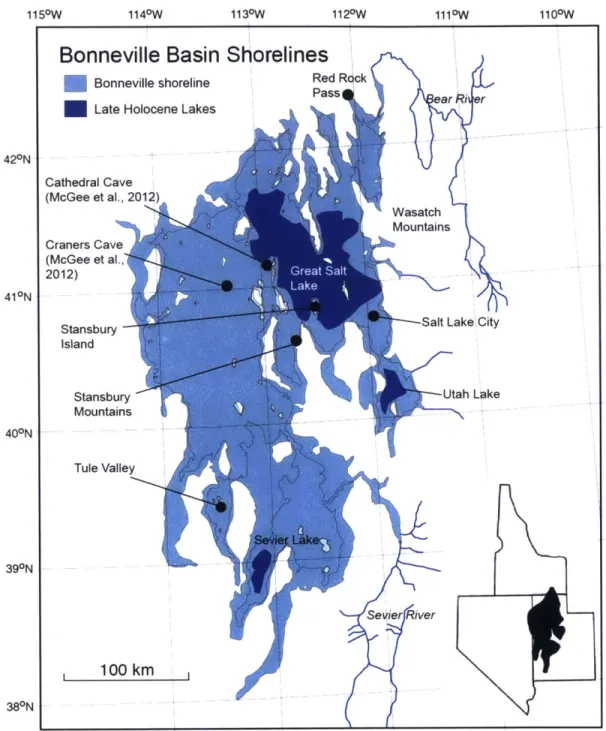
Figure 1: Map of Lake Bonnevile modified from McGee et al. (2012) and Currey et al.
(1984) showing the lake at its largest extent (- 18-19 ka) and sample locations for this
study. Lake Bonneville is shown in light blue and modem lakes in dark blue. Also labeled are the Bear River in the north and Sevier River in the south, the Great Salt Lake
(GSL), and Utah Lake. Sometime after 18.2 ka (Oviatt 2015), an alluvial fan damming
the lake at Red Rock Pass, ID failed, causing the lake to drop ~100 m (Malde 1968). The Provo shoreline formed after this event is shown by the thin black line within the larger
100 km
2.3 Setting, Materials, and Methods
2.3.1 Lake Bonneville
Lake Bonneville began rising to its highest shoreline starting around 30 ka (Currey, 1983; Oviatt et al., 1992; Scott et al., 1983; Fig. 2). A number of small oscillations of the lake have been documented in sedimentological records on its rise to the Bonneville shoreline (Currey, 1990; Nelson and Jewell, 2015; Oviatt, 2015; Oviatt et al., 1992, 1990;
Patrickson et al., 2010; Sack, 1999), though most are poorly dated (Oviatt 2015). The earliest of these known oscillations, the Stansbury Oscillation, was the most dramatic and is the best dated. The Stansbury Oscillation is associated with the development of a pronounced shoreline around 25 ka that is present in many locations in the basin (Oviatt,
2015; Oviatt et al., 1992, 1990). Studies of lake sediments multiple locations in the
Bonneville Basin (Old River Bed, Stansbury Island, Crater Island, Fish Springs Flat) have revealed a double oscillation (the lake fell twice in rapid succession as it rose to the Bonneville shoreline) around 25 ka (Oviatt, 1987; Oviatt et al., 1990; Patrickson et al., 2010). Three published 14C ages constrain the timing of the low lake level in this
oscillation to -25 ka; all have uncertainties >400 years (Currey et al., 1983; Nishizawa et al., 2013; Oviatt et al., 2015, 1990).
Lake Bonneville reached its highstand, marked by the Bonneville Shoreline (Fig. 2), at -18.6 ka (Oviatt, 2015; Oviatt et al., 1992). Around 18.2 ka (Miller et al., 2013; Oviatt, 2015), an alluvial fan damming the lake at Red Rock Pass in southern Idaho catastrophically failed and the lake began to flow into the Snake River Plain (Malde
the lake's fall from the Provo is unknown (Godsey et al., 2011, 2005; McGee et al., 2012; Miller et al., 2013; Oviatt, 2015).
1600
--- Oviatt 2015 Lake level
1550 -Bpnneville 14C Mollusks 155014C Organic Material 14C Tufa 1500 -M 1450 1400
-X
1350 - -1300 -1250 10 12 14 16 18 20 22 24 26 28 30 32 ka B.P.Figure 2: Calibrated 14C ages and 2a uncertainties constraining past lake level compiled by Oviatt (2015) from previously published works. Age compilation includes 14C ages from multiple sources compiled by Oviatt (2015). Dashed line indicates past Lake Bonneville level estimated by Oviatt (2015). According to this lake level record, the lake
began to rise around 30 ka and reached its highest level around 18-19 ka. The lake dropped -100 m to the Provo Shoreline sometime after 18.2 ka (see further explanation in text). Lake Bonneville's regression from the Provo shoreline began sometime after 16 ka. "SO" denotes the Stansbury Oscillation.
The Bonneville Basin has isostatically rebounded up to 70 m since the fall of Lake Bonneville (Currey, 1982); shorelines in the center of the basin have rebounded the most. An isostatic rebound correction is necessary to compare altitudes for samples collected from far-apart locations in the basin. To do this, we use an empirical equation developed by Currey and Oviatt (1985):
Za= Zr Zr 1200) X(Zb - 1552)
Z- (-1200
Z, is the measured sample elevation, Zb is the local elevation of the Bonneville shoreline, 1200 m is the elevation of the lowest point in the basin when the lake was at the
Bonneville shoreline, and 1552 m is the estimated "true" elevation of the Bonneville shoreline.
2.3.2 Tufa Deposits
A distinguishing feature of the relict shorelines of Lake Bonneville is the
abundant tufa, which can be found deposited on bedrock or beach gravels in the form of round "heads" of up to 5 m in diameter (Fig. 3). The modem GSL contains abundant biologically mediated carbonates, often described as stromatolites or bioherms (Baskin et al., 2012; Carozzi, 1962; Chidsey et al., 2015; Halley, 1976; Pedone and Folk, 1996), that are analogous to the tufa deposited in Lake Bonneville. Most modern microbialites in the Great Salt Lake occur in shallow areas, usually within 4m of the lake's surface (Eardley,
1938; Halley, 1976). Documented growth rates of modem tufas on Stansbury and
Antelope Islands are 10-40 im/year (Pedone and Folk, 1996).
Because tufa forms only in shallow areas of the lake, ancient tufa deposits can be used to constrain past elevation of the lake surface. Tufas, which are frequently high in initial Th due to the presence of detrital matter incorporated during their formation, can be challenging to date using the U-Th method (Garnett et al., 2004; Ibarra et al., 2014; Kaufman and Broecker, 1965; Placzek et al., 2006, and others). Careful selection of samples is crucial to successful dating of tufas, as well as consideration of possible detrital and hydrogenous Th inputs (Placzek et al., 2006). However, the power of tufa deposits as paleoshoreline markers has led many to attempt U-Th dating of tufas. In the
U.S. Great Basin, tufas from Lakes Lahontan (Kaufman and Broecker, 1965a; Lin et al., 1996; Szabo et al., 1996), Bonnevile (Kaufman and Broecker, 1965a), Surprise (Ibarra et
al., 2014), and Searles (Lin et al., 1998; Peng et al., 1978) have been U-Th dated. In the Bonneville Basin, tufa deposits have traditionally been a target of 14C dating to determine the timing of past lake level changes (Broecker and Orr, 1958; Burr and Currey, 1988; Currey and James, 1982; Currey et al., 1983; Godsey et al., 2005; Hart et al., 2004; Kaufman and Broecker, 1965b; Lifton et al., 2015; Nishizawa et al., 2013, 2012; Oviatt et al., 1990; Sack, 1999). The largest, best-developed deposits of tufa and shoreline gravels in the basin are found in association with the Provo shoreline, though abundant tufa is also present at other elevations.
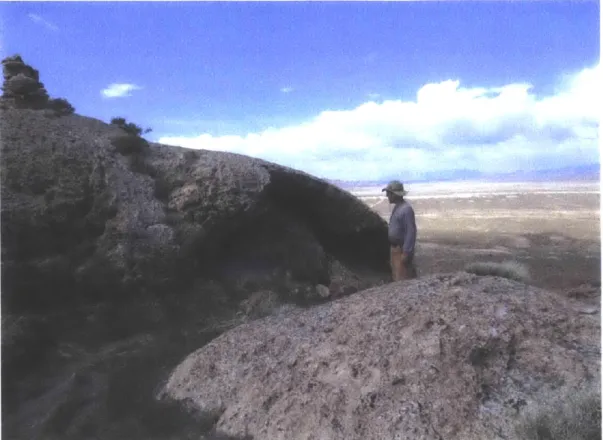
Figure 3: Tufa mounds deposited at Table Mountain, Tooele County, UT. These
deposits were formed in within 4 m of the surface of Lake Bonnevile when it existed at this elevation (see further discussion in text) (Eardley, 1938). Large-scale radiating of the tufa structure is evident in the cross-section visible in the center of the photograph.
2.3.3 Deep-Lake Carbonates
Deep-lake carbonate deposits have been previously documented in only two hillside cave localities in the Bonneville Basin and were referred to as "lacustrine cave carbonate" (McGee et al., 2012). McGee et al. (2012) described three phases of deep-lake carbonate deposition in Cathedral Cave (1351 m; Fig. 1). Aragonite deposition begins at Cathedral Cave at 26.07 0.8 ka and transitions to calcite at 18.83 0.05 ka
(Phase I). A depositional hiatus in the calcite begins at 18.3 0.3 ka and continues until
16.4 0.2 ka, when calcite deposition resumes (Phase II). Phase II calcite deposition ends at 14.7 0.2 ka (McGee et al.2012). The change from aragonite to calcite was the result of freshening of the lake water (McGee et al. 2012). A final layer of aragonite,
Phase III, was deposited between 13.8 0.1 and 13.6 0.1 ka. A sample from Craners
Cave, located ~50 km southwest of Cathedral Cave, shows a similar depositional history and equivalent mineralogical transitions.
Our findings show that these deposits form in places other than hillside caves, so here we refer to them as "deep-lake carbonates." In the Bonneville Basin, deep-lake carbonate deposits have been observed in shoreline gravels, bedrock crevices, and interstitial void spaces within tufa deposits (Fig. 4). These interstitial spaces in tufa provide dark, low-energy areas that are analogous to the depositional environment in submerged hillside caves and bedrock crevices. On Stansbury Island, deep-lake carbonates deposited within gravels and tufas (Fig. 5) are particularly common.
Tufa and shoreline gravels
near lake surface
Figure 4: Model for deposition of deep-lake carbonate in the Bonneville Basin. (A) Tufa
and shoreline gravels are deposited at the lake surface and deep-lake carbonate is deposited in submerged caves and crevices in bedrock. (B) The lake rises and deep-lake carbonate is deposited in void spaces within the submerged tufa and gravels. Deposition
continues in the submerged caves and crevices.
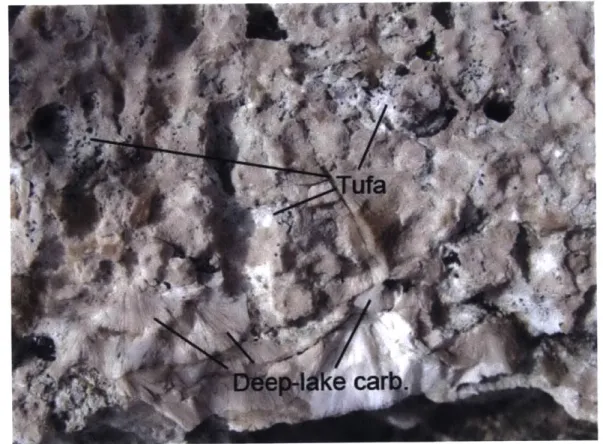
Figure 5: Deep-lake carbonate fans (cream-colored) cementing voids within a tufa
deposit (light colored with rough texture). Stansbury Island, UT. The fans were
2.3.4 Sample Collection
Tufa and deep-lake carbonate were collected from multiple elevations and locations in the Bonneville Basin (Fig. 1). Most samples from this study were collected from Stansbury Island, UT, from quartzite bedrock of the late Devonian Stansbury Formation (Moore and Sorensen, 1979). Other samples were collected from the
Stansbury Mountains, Tule Valley, and the Fish Springs Range (Fig. 1). Elevation, latitude, and longitude of sample collection were measured using either a handheld Garmin eTrex 30 (uncertainty approximately 10 m) or a Trimble differential GPS unit
(uncertainties 0.1-0.7 m) (Supplementary Table 1).
The Stansbury Island locality from which the majority of samples for this study were collected has an abundance of dateable tufa and crystalline deep lake deposits. Tufa deposits in this location can be found both on top of and within gravels and also directly to the quartzite bedrock.
2.3.5 Drilling Samples
Carbonate samples were cut using a brick saw and polished to make a clean, flat surface for drilling where variations in sample texture could be observed with the naked eye. Before drilling powders for U-Th analyses, samples were washed with deionized water and cleaned with compressed air. Different textures within hand samples were observed visually (e.g. tufa, deep lake carbonate) and individually sampled using a 0.5 mm carbide drill bit in a vertical milling machine. 1-10 mg samples for U-Th analyses were drilled for U-Th dating.
2.3.6 U-Th Dating
Samples were prepared for measurement following the methods of Edwards et al.
229Th-23U-23U tracer. The samples were dissolved and U and Th were isolated from the
dissolved sample solution by Fe co-precipitation. A total procedural blank was prepared with each set of 5-10 samples. U and Th were eluted separately through Biorad AGI-X8 resin.
U and Th fractions were measured on MIT's Nu Plasma II multicollector
ICP-MS. U samples were bracketed with 5 ppb CRM1 12a solution and Th samples bracketed
with an internally calibrated 2 29Th-23 0Th-212Th standard (MITh-1). All isotopes were
measured on the Faraday cups except for 2"Th and 214U, which were measured on the
secondary electron multiplier. Results were corrected for tailing, solution blanks, and total procedural blanks. Total procedural blanks ranged from 5 to 498 pg 2 3 8U (average
150 pg, standard deviation 187 pg) and 0.1 to 6 pg 2 32Th (average 2 pg, standard
deviation 2 pg). U-Th ages were calculated using decay constants for 238U (Jaffey et al.,
1971), 2 3 4U, and 23 0Th Cheng et al. (2013). A detrital 2 30Th/2 32Th correction of 8 2 ppm was used to correct U-Th ages fnr initial Th (McGee et al., 2012). For most famples, the detrital correction was a larger source of uncertainty than the blank. Uncertainty
propagation included measurement uncertainties, blank correction (assigned a 33% 1a uncertainty), SEM yield correction, spike calibration uncertainties, and tailing.
2.4 Results
2.4.1 Sample Description
Deep-lake carbonate typically presents in the lake as botryoidal, radiating fans of calcite and aragonite (Fig. 6). Depending on the depositional environment and growth rate, the size and texture of these aragonite and calcite fans can vary. In general, slower
growth of the crystals leads to larger, better-developed fans (Fig. 6). These larger, slower-growing fans can be seen particularly well in samples from Cathedral Cave (Fig. 6B). Larger fans are readily visible to the naked eye in hand samples and can be as large as 3-5 mm across. Smaller botryoidal fans resulting from higher growth rates (Fig. 6), such the <0.5 mm fans in BB13-117 (Fig. 6A), are less visible to the naked eye but can still be distinguished from tufa textures in hand samples. Tufas (Fig. 6C,D) are largely micritic and similar in texture to Bonneville Basin tufa samples described by Hart et al. (2004) and Chidsey et al. (2015). At Stansbury Island, the textures of biologically
mediated tufa are readily distinguishable from deep lake carbonate phases with the naked eye.
dee-ake cement
d ep-1ke r mnents
tufa IA
5 M"
Figure 6: Thin sections of Lake Bonneville Carbonates. (A) Crystalline fans in deep-lake carbonate from Stansbury Island reflecting a growth rate of~-8 [m/yr. (B) Large aragonite fans in deep-lake carbonate from Cathedral Cave (McGee et al. 2012), growth rate ~6 Vm/year. (C,D) Secondary cementation of micritic tufa by botryoidal fans of deep-lake aragonite cement.
2.4.2 U-Th ages and 623 4U
We report 62 U-Th ages and corresponding elevation information from deep lake carbonates and tufas from the Bonneville Basin (Supplementary Table 1, Fig. 7). Most reported ages were between 28 and 18 ka and record the transgression of lake Bonneville to its highest shoreline; propagated 2y uncertainties in these reported ages ranged from 40 to 1000 years. Samples with 2 30Th/2 3 2Th <50 ppm were excluded from the data set.
Initial 62 34U calculated for the measured samples ranged from 946 to 1221 %o (Fig. 8). Samples from this study closely replicate the 62 3 4U record from McGee et al. (2012).
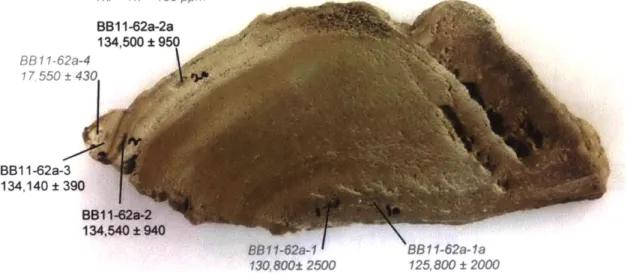
A basal tufa sample (BB13-62a) collected from the Provo shoreline (elevation
1484 m) at Stansbury Island yielded a suite of ~134 ka ages (Supplementary Table 1, Fig.
9), three of which had 23 Th/23 2Th >100 ppm and are thus deemed more reliable. 2a
uncertainties in this sample set ranged from 390 to 2500 years. A single sample in this set, taken from a thin veneer of carbonate on the outside of the sample, dated to the last Bonneville lake cycle.
1600 0 SI Tufa Bonneville SI Deep-lake 1550 SM Tufa SM Deep-Lake 1500
B
TV Tufa B V U CC Deep-Lake P 0 U SIR Deep-Lake E140U Provo '1- - - Oviatt 2015 Lake Level
j1400 1350 1300 -1250 ' 10 12 14 16 18 20 22 24 26 28 30 32 ka B.P.
Figure 7: U-Th ages of Lake Bonneville carbonates plotted at collection elevation adjusted for isostatic rebound. Dashed gray line is lake level estimation of Oviatt (2015). Location abbreviations are as follows: SI = Stansbury Island; SM = Stansbury Mountains, TV = Tule Valley, CC = Cathedral Cave; SIR = Silver Island Range. "SO" denotes the Stansbury Oscillation. All elevations are adjusted for isostatic rebound using equation described in Section 2.3.1.
900 950 1000 1050 0 to 1100 1150 1200 1250 -- in I -- ~I 'V ~
T
I
/ / / I / / I l- -I U' I' F- -i I' 10 12 14 16 18 20 22 24 26 28 30 ka B.P.Figure 8: Initial 62 34U of lacustrine carbonates from multiple locations in the Bonneville
Basin. Lake hydrograph (dashed gray line) is from Oviatt (2015). Location abbreviations are as follows: SI = Stansbury Island; SM = Stansbury Mountains, TV = Tule Valley, CC
= Cathedral Cave; SIR = Silver Island Range. Data from Cathedral Cave (gray squares)
are from McGee et al. (2012). 623 4U measurements on carbonates from throughout the
basin reproduce and extend the record from Cathedral Cave.
33 " Si Tufa SI Deep-Lake SM Tufa SM Deep-Lake " TV Tufa " FSR Deep Lake " CC Deep-Lake SIR Deep-Lake " CC McGee et al. 2012
-- - Oviatt 2015 Lake Level TI T--14U 1650 0 1550 1450 1350 1250 32
I
3ThM"Th < 100 ppm BB 1 1-62a-4 I7 550 430 BB11-62a-3 134,140 390 BB 1-62a-1 BB1 1-62a-la 130,800 2500 125,800 2000
Figure 9: U-Th ages of microsampling sites within BB13-62a from 1484 m on Stansbury
Island. Three of the six U-Th ages, in gray italic have 2"Th/ 2 Th < 100 ppm. There is a
depositional hiatus near the top of the sample where MIS 2 carbonate is deposited directly on top of MIS 6 carbonate.
2.5 Discussion
2.5.1 Carbonate Deposition
Our observations of samples collected from Stansbury Island and elsewhere in the
basin support the interpretation of McGee et al. (2012) that deposits form deep beneath the surface of the lake. Deep-lake carbonate deposition within tufa appears very common in multiple locations in the Bonneville Basin. This mechanism for deep lake carbonate deposition requires tufas to be formed in the photic zone and later submerged by deeper water (Fig. 4). At Stansbury Island, where deep-lake cements are otherwise abundant, we observe that tufas formed during Provo time do not contain deep-lake cements. This
empirical evidence, along with geochemical and dating evidence to be discussed in following sections, supports the theory that crystalline aragonite and calcite fans found cementing tufa and bedrock crevices are in fact deep-lake deposits.
2.5.2 Stansbury Island Carbonate Record
The lacustrine carbonate record from Stansbury Island demonstrates how complex information about lake level history can be recorded within tufa and other lacustrine carbonate deposits. Many sampled carbonate deposits from Lake Bonneville's
transgression follow a similar deposition pattern. Typically, basal deposition consists of shoreline tufa. Above the basal layer, the deposit transitions into dense, clean, deep-lake carbonate. This progression of deposits contains information about past lake level and can provide continuous records of lake chemistry. If ignored, secondary deep-lake
carbonate cementation of tufa deposits could lead to unintentional mixing of carbonate of different ages when sampling. To avoid this, it is important to microsample different textures within tufa deposits in order to not misinterpret a sample's context or age.
If the potential for multi-stage depositional histories within tufa deposits is taken
into account when sampling, these deposits can become a powerful tool for
understanding the lake's history. At Stansbury Island, individual hand samples from which both tufa and cementing deep-lake carbonate were sampled show a spread of U-Th ages consistent with tufa being deposited at the lake surface followed by deposition of deep-lake cements after the lake had submerged the tufa (Fig. 4).
Our record of U-Th ages of lacustrine carbonate agrees broadly with the latest compiled record of Oviatt et al. (2015) (Fig. 7). This record shows that, with high enough sample density from a single location (in this case, Stansbury Island), it is possible to constrain the timing of small-scale changes in lake level, such as the
Stansbury Oscillation. Though the deep-lake carbonates only provide a minimum lake level elevation, as they appear to form >5m below the surface of the lake, a "cloud" "of points in a given age/elevation range can give very good constraints on broader changes
in lake level. This technique is extremely useful bcause it can cover large ranges in
elevation and time in a single location, eliminating the issue of isostatic rebound corrections and other difficult comparisons between distant localities. Though this strategy does not replace studies of complex lake sediment stratigraphy, it offers a complementary approach.
Our record suggests that the rise in lake level in the center of the double Stansbury Oscillation (Fig. 2) occurred just before 25 ka. At Stansbury Island, the
Stansbury shoreline ranges in elevation between 1363 m and 1372 m (Oviatt et al., 1990). Two deep-lake carbonate samples from Stansbury Island constrain the age of this peak, or at minimum show that either of the two "troughs" of the oscillation did not occur at that
time. U-Th ages on deep-lake carbonates of 25300 100 years B.P. (1386 m local measured elevation) and 25180 150 years B.P. (1381 m local measured elevation) are well above the highest local elevation of Stansbury shoreline deposits, 1372 m
(Supplementary Table 1). Following this interpretation, our record agrees with the ~25 ka age in the center of the oscillation reported by Oviatt (2015). It is important to note the possibility that the Stansbury Oscillation could also have occurred before these
samples were deposited and that these samples represent the transgression of the lake following the Stansbury Oscillation. In this case, they would provide a minimum age for the rise from the second "trough" of the Stansbury Oscillation. In any case, the fine-scale
agreement on the timing of the "center" of the oscillation between the sedimentary (e.g. Oviatt et al. 1990) and lacustrine carbonate record show that thin deep-lake deposits can be powerful tools for lake level reconstructions.
2.5.3 634 U record
62 34U values of Lake Bonneville carbonates indicate the intensity of chemical
weathering in the Bonneville Basin, and by extension, the amount of precipitation in the basin (McGee et al., 2012). Because it is a product of alpha decay, 234U is typically
located in damaged sites within minerals and is more easily removed by weathering than
2 3 8U (Chabaux, 2003). In dry conditions, 234U is preferentially weathered; in wetter
conditions, 2 3 8U and 234U are weathered more congruently. Thus, wetter conditions in the
basin result in lower 62 34U values of lacustrine carbonates.
62 34U records from Cathedral and Craners Caves show that, on a broad scale, 62 34U tracks increases and decreases of precipitation in the basin (McGee et al., 2012).
Cathedral and Craners Cave decreased from -1 080%o to ~900%o, consistent with increased weathering as precipitation increased. The 6234U records from Cathedral and Craners Caves were collected from thick (~5 cm) deep lake carbonate samples that could be sampled at close intervals, producing a nearly continuous time series.
Unlike the McGee et al. (2012) cave carbonate records, our 234U record from
Stansbury Island is compiled from many different samples collected at different
elevations. The samples that make up the Stansbury island record include microsampled tufas and deep lake carbonates. The Stansbury Island record both replicates and extends the records from McGee et al. (Fig. 8). 6234U of carbonate samples from the Stansbury
Mountains, Fish Springs Range, and Tule Valley also replicate the major features of the record.
McGee et al. (2012) propose a temporal lag between 6180 and 6234U in response to changing hydroclimate due to a longer residence time for U in the lake than for 0.
This lag is recorded clearly in the onset of freshening of Lake Bonneville coincident with
Heinrich Stadial 2 (HS2) (Fig. 10). The 6234U records from Cathedral and Craners caves
demonstrate such a lag after a pulse of lake freshening recorded in the corresponding
6180 record. In the Cathedral Cave 6180 record, freshening associated with Heinrich
Stadial 2 begins around 24.5 ka, peaks around 24 ka, and returns to pre-event values by
~23.8 ka.
This pulse of lake freshening described by McGee et al. (2012) is rapid.
However, there is no conclusive shoreline-based lake level evidence suggesting an abrupt rise of the lake during HS2, possibly due to the short duration of the event. Similarly, there is little existing shoreline-based evidence for a period of high or increasing lake
level during Heinrich Stadial 3 (HS3; 30.0-3 1.1 ka after Wang et al. (2001). Nishizawa et al. (2013) and Oviatt (2015) present 14C evidence from around and just before 30 ka showing a rising lake at that time. However, 14C ages older than 30 ka may be infinite because more than 5 14C half lives (~5730 years) have elapsed; these ages are therefore unreliable (Oviatt et al., 2014).
So far, there are no existing U-Th-dated deposits that suggest a higher lake level during Heinrich Stadial 3. However, the beginning of the record at 29.7 ka shows a similar feature to the lagged change in 62 3 4U values after HS2 described by McGee et al.
(Fig. 10). In Cathedral and Craners Caves, near the end of HS2 (~23.9 ka), 6234U values
drop ~50%o and then increase again to near previous values by -22.8 ka. Though HS3 is not recorded by samples directly dated to the duration of the event itself, we speculate that very beginning of the Stansbury Island record may capture a lagged 6234U response
to a similar freshening event as was recorded in HS2.
The broad reproducibility of 62 3 4U within the lake shows that this could be a widely applied technique for constraining age models in sequences of lake sediments. Indeed, any well-dated isotopic records from tufas and deep lake carbonates where the lake is well-mixed with respect to the element (in this case, U, but also Sr (Chapter 3)) could be useful for anchoring records from sediment cores.
HS1
A
HS2 HS3 U I.Cf
S,.,D/
I I I I I I I I -12 14 16 18 20 22 ka B.P. 24 26 28 30 32Figure 10: Records from Lake Bonneville and Hulu Cave monsoon record showing
Heinrich Events. (A) 8234U record from Cathedral Cave, Craners Cave (McGee et al.,
2012) and this study (B) Hulu Cave record showing duration of Heinrich Stadials (Wang et al., 2001) (C) Cathedral Cave 6180 record (McGee et al., 2012). (D) Lake Bonneville hydrograph showing change in lake level over time (Oviatt, 2015).
-9.50 -- 7.50 o -5.50
9
-3.50 -1.50 900 1000 1100 1200 1550 E 1450 0 1350 0 1250 Cathedral Cave -Hulu Cave MSD -Hulu Cave PID % , f... P , 4 ' ' . ". f. . "O2.5.4 MIS 6 Lake
A basal tufa sample, BB I 3-62a, collected from the Provo Shoreline (1480 m,
uncorrected elevation) on Stansbury Island yielded U-Th ages around -135 ka (Supplementary Table 1, Fig. 9). This sample indicates the presence of a large lake during Heinrich Stadial 11 (HS1 1) and is consistent with proximal speleothem records (Cross et al., 2015) that suggest wet conditions during this time. The existence of a large
lake during HS 11 is broadly consistent with observations of wetter conditions throughout the Great Basin during later Heinrich events and points to atmospheric circulation
patterns during MIS (Marine Isotope Stage) 6 (Lisiecki and Raymo, 2005) that are
analogous to what is observed during MIS 2. Previous sedimentary evidence for pre-MIS 2 lakes exists but is sparse and poorly dated (Eardley et al., 1973; McCoy, 1987;
Morrison, 1966; Oviatt and Currey, 1987; Scott et al., 1983, and others).
Three of the six U-Th dates obtained for BB13-62a had 230Th/23 2Th ratios of <100
ppm (Fig. 9), making them highly sensitive to the detrital Th correction used to calculate the dates. Preliminary U-Th isochrons calculated for these samples indicate that the detrital 234Th/2 3 2Th value used to calculate the U-Th ages is plausibly correct for these
samples, however, there is most likely some variation in detrital 230Th/23 2Th contributions
within the sample because the U-Th ages fall out of stratigraphic order. Future work on this sample will involve more U-Th analyses to determine a more precise age.
This MIS 6 sample shows the importance of microsampling tufa to understand nuances of its depositional history. Two 14C dates were obtained from near the outside of
this sample: 33,870 230 and 23,740 270 14C years B.P (Jay Quade, personal
suite of~-135 ka ages (Supplementary Table 1). Also revealed by microsampling was a thin veneer of Provo-aged carbonate on the outer surface of the sample (Fig 10). Alone and not critically examined, the radiocarbon dates could suggest deposition during late
MIS 3 and early MIS 2. The 14C dates of BB13-62a likely reflect mixing the radiocarbon-dead MIS 6 carbonate that comprises most of the sample with the thin veneer of MIS 2-aged material dated near the top of the sample and do not accurately reflect when the sample was deposited. Notably, the depositional hiatus between the MIS 6 and MIS 2 carbonate in BB 13-62a suggests, though does not conclusively prove, that the lake did not rise to Provo level between its MIS6 and MIS2 cycles.
2.6 Conclusions
If carefully sampled, deep-lake carbonates and tufas can be powerful climate
archives. Our data show that these types of deposits can be used to construct robust hydroclimate records. Transgressive tufa deposits may contain deep-lake cements, which can provide useful geochemical information if sampled carefully. Our records constrain the timing of the Stansbury Oscillation either to 25 ka, as proposed by Oviatt et al. (2009,
2015), or to sometime before 25 ka. Additionally the 62 34U record from lake Bonneville carbonates suggests a possible wet period during HS3. The 6234U is well replicated in
samples throughout the Bonneville Basin, showing that even very thin deep-lake
carbonate samples can be used to construct larger-scale isotopic records. Finally, U-Th dates of ~134 ka on Provo-elevation shoreline tufa indicate a large MIS 6 lake in the Bonneville Basin.