HAL Id: hal-00295732
https://hal.archives-ouvertes.fr/hal-00295732
Submitted on 30 Aug 2005
HAL is a multi-disciplinary open access
archive for the deposit and dissemination of
sci-entific research documents, whether they are
pub-lished or not. The documents may come from
teaching and research institutions in France or
abroad, or from public or private research centers.
L’archive ouverte pluridisciplinaire HAL, est
destinée au dépôt et à la diffusion de documents
scientifiques de niveau recherche, publiés ou non,
émanant des établissements d’enseignement et de
recherche français ou étrangers, des laboratoires
publics ou privés.
Characterization of aerosol particle episodes in Finland
caused by wildfires in Eastern Europe
J. V. Niemi, H. Tervahattu, H. Vehkamäki, J. Martikainen, L. Laakso, M.
Kulmala, P. Aarnio, T. Koskentalo, M. Sillanpää, U. Makkonen
To cite this version:
J. V. Niemi, H. Tervahattu, H. Vehkamäki, J. Martikainen, L. Laakso, et al.. Characterization of
aerosol particle episodes in Finland caused by wildfires in Eastern Europe. Atmospheric Chemistry
and Physics, European Geosciences Union, 2005, 5 (8), pp.2299-2310. �hal-00295732�
Atmos. Chem. Phys., 5, 2299–2310, 2005 www.atmos-chem-phys.org/acp/5/2299/ SRef-ID: 1680-7324/acp/2005-5-2299 European Geosciences Union
Atmospheric
Chemistry
and Physics
Characterization of aerosol particle episodes in Finland caused by
wildfires in Eastern Europe
J. V. Niemi1, H. Tervahattu2,3, H. Vehkam¨aki4, J. Martikainen4, L. Laakso4, M. Kulmala4, P. Aarnio5, T. Koskentalo5, M. Sillanp¨a¨a6, and U. Makkonen6
1Department of Biological and Environmental Sciences, University of Helsinki, P.O. Box 27, FIN-00014 Helsinki, Finland 2Nordic Envicon Ltd., Koetilantie 3, FIN-00790 Helsinki, Finland
3Cooperative Institute for Research in Environmental Sciences, University of Colorado, Campus Box 216, Boulder, CO 80309, USA
4Department of Physical Sciences, University of Helsinki, P.O. Box 64, FIN-00014 Helsinki, Finland 5Helsinki Metropolitan Area Council (YTV), Opastinsilta 6 A, FIN-00520 Helsinki, Finland
6Finnish Meteorological Institute, Sahaajankatu 20 E, FIN-00880 Helsinki, Finland Received: 31 January 2005 – Published in Atmos. Chem. Phys. Discuss.: 22 April 2005 Revised: 18 July 2005 – Accepted: 16 August 2005 – Published: 30 August 2005
Abstract. We studied the sources, compositions and size distributions of aerosol particles during long-range transport (LRT) PM2.5episodes which occurred on 12–15 August, 26– 28 August and 5–6 September 2002 in Finland. Backward air mass trajectories, satellite detections of fire areas and dis-persion modelling results indicate that emissions from wild-fires in Russia and other Eastern European countries arrived in Finland during these episodes. Elemental analyses using scanning electron microscopy (SEM) coupled with energy dispersive X-ray microanalyses (EDX) showed that the pro-portions of S-rich particles and agglomerates (agglomeration was caused partly by the sampling method used) increased during the episodes, and they contained elevated fractions of K, indicating emissions from biomass burning. These aerosols were mixed with S-rich emissions from fossil fuel burning during transport since air masses came through pol-luted areas of Europe. Minor amounts of coarse Ca-rich par-ticles were also brought by LRT during the episodes, and they probably originated from wildfires and/or from Esto-nian and Russian oil-shale-burning industrial areas. Ion chro-matography analysis showed that concentrations of sulphate (SO2−4 ), total nitrate (NO−3+HNO3(g)) and total ammonium (NH+4+NH3(g)) increased during the episodes, but the ratio of the total amount of these ions to PM10concentration de-creased, indicating unusually high fractions of other chemi-cal components. Particle number size distribution measuments with differential mobility particle sizer (DMPS) re-vealed that concentrations of particles 90–500 nm increased
Correspondence to: J. V. Niemi
(jarkko.v.niemi@helsinki.fi)
during the episodes, while concentrations of particles smaller than 90 nm decreased. The reduction of the smallest parti-cles was caused by suppressed new particle formation due to vapour and molecular cluster uptake of LRT particles. Our results show that emissions from wildfires in Russian and other Eastern European countries deteriorated air quality of very large areas, even at distances of over 1000 km from the fire areas.
1 Introduction
Large amounts of fine particles (PM2.5)are emitted from var-ious sources and transported long distances due to their slow removal from the atmosphere. Thus, in areas with low local emissions, the major proportion of the PM2.5mass is usually long-range transported. Fine particles are associated with ad-verse health effects (Dockery and Pope, 1994; Laden et al., 2000; Pope et al., 2002; WHO, 2002, 2003), and no thresh-old concentration has been identified below which they have no impact on health (WHO, 2003).
The properties and sources of long-range transport (LRT) particles in Finland have been studied in conjunction with several short-term campaigns and long-term monitoring measurements. The emissions and mass concentrations of PM2.5are generally quite low compared with more polluted regions of Europe (EMEP, 2001, 2002; Ruuskanen et al., 2001). Even in the urban areas of Helsinki, 50–70% of PM2.5 mass is caused by LRT (Vallius et al., 2003; Karppinen et al., 2004). In general, high concentrations of LRT PM2.5 mass and typical chemical components of LRT particles,
2300 J. V. Niemi et al.: Aerosol episodes in Finland caused by wildfires
18
Finland Imatra -20 0 20 40 60 80 100 120 2/8 6/8 10 /8 14 /8 18 /8 22 /8 26 /8 30 /8 3/9 7/9 11 /9 15 /9 Date of year 2002 M a s s c o n c en tr at ion ( µ g m -3 ) Helsinki PM10Helsinki PM2.5 Imatra PM10 Helsinki PM2.5 - PM10EPI-1 EPI-2 EPI-3
Fig.
1.
Fig.
2.
Romania Ukraine Baltic Sea Belarus Russia Black Sea Estonia Poland Finland Romania Black Sea Sweden Ukraine Belarus Russia Estonia Poland FinlandFig.
3.
Fig.
4.
0 500 1000 1500 2000 2500 3000 3500 2/8 6/8 10/8 14/8 18/8 22/8 26/8 30/8 3/9 7/9 11/9 15/9 Date of year 2002 N u m ber c o nc e n tr ati on ( c m -3 ) AccumAitken Nucl EPI-1 EPI-2 EPI-3Fgi.
5.
Fig.
6a.
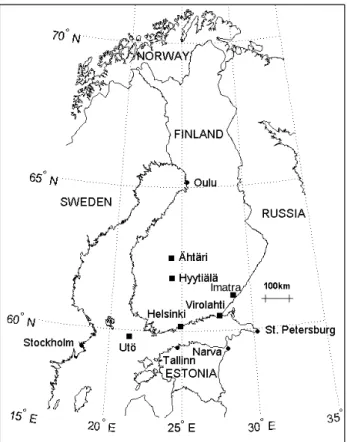
Fig. 1. Locations of the measurement and sampling sites (marked
with squares).
such as sulphate and nitrate, are observed in Finland when air masses arrive from Eastern and Central Europe (Pakka-nen et al., 2001; Ruoho-Airola et al., 2004). In northern Fin-land, the emissions from the Arctic Ocean and from the Kola Peninsula industrial areas in northern Russia also increase LRT particle mass concentrations (Virkkula et al., 1999; Yli-Tuomi et al., 2003). However, the sources and properties of aerosols during the strongest LRT periods are still poorly known in Finland, and only a few LRT episodes have been examined in detail to date. The main sources of these LRT episodes have been marine aerosols from the Atlantic Ocean (Tervahattu et al., 2002a, b), emissions from oil-shale burn-ing industrial areas in Estonia and Russia (Tervahattu et al., 2004) and emissions from spring-time agricultural field burn-ing and fossil fuel burnburn-ing in Russia and other Eastern Euro-pean countries (Niemi et al., 2004).
In this article, we describe three LRT PM2.5episodes that occurred in Finland in August and September 2002. We studied mass and number concentrations of PM as well as its chemical composition using bulk and individual particle methods. Backward air mass trajectories, fire satellite ob-servations, dispersion modelling results and emission source data were also used to identify origin and to characterize the dispersion of LRT emissions. The main sources of the
episodes were emissions from forest and peat fires mixed with emissions from fossil fuel burning. A comparison with an earlier LRT PM2.5 episode occurring during the spring-time agricultural field burning period (Niemi et al., 2004) was also carried out.
2 Materials and methods
We used several measurement and sampling sites in this study and their locations are shown in Fig. 1. Summary of the measurements and samplings performed at these sites is given in Table 1.
2.1 Meteorological and emission data
The meteorological conditions were derived from data col-lected by the Finnish Meteorological Institute at Kaisaniemi, Helsinki, and the Helsinki Metropolitan Area Council at Pasila, Helsinki. Backward air mass trajectories were produced using the vertical motion model in the HY-brid Single-Particle Lagrangian Integrated Trajectory (HYS-PLIT4) model (Draxler and Rolph, 2003) with the Final Analyses (FNL) meteorological database at NOAA Air Re-sources Laboratory’s web server (Rolph, 2003). For detec-tion of fire areas, we used Web Fire Mapper (http://maps. geog.umd.edu), which is part of the MODerate-resolution Imaging Spectroradiometer (MODIS) Rapid Response Sys-tem (Justice et al., 2002). The Navy Aerosol Analysis and Prediction System (NAAPS) model results were used to de-termine the distribution of smoke, dust and sulphate aerosols. Details of the model and model results are available at the internet pages (http://www.nrlmry.navy.mil/aerosol/) of the Naval Research Laboratory, Monterey, California. Using data of the European Monitoring and Evaluation Programme (EMEP), we searched for information on trace gas and parti-cle emissions in the areas along the air mass routes (EMEP, 2001, 2002).
2.2 Particle mass and number size distributions
Particle mass and number size distributions are measured at a rural background station (SMEAR II) in Hyyti¨al¨a (Kulmala et al., 2001) by the University of Helsinki (Department of Physical Sciences). The particle mass fractions were mea-sured with a Dekati PM103-stage impactor with a backup fil-ter. The duration of sample collection was 2–3 days. The in-let was located 2 m above ground level, and the flow rate was 29.2 L min−1. The cut-off diameters (D
50)of the impactor stages were 10, 2.5 and 1 µm. The collection substrates for impaction stages were polycarbonate membranes (Nuclepore 800 203, diameter 25 mm) with no holes, and the backup fil-ter was made of Teflon (Gelman Teflo R2P J047, diamefil-ter 47 mm) with a diameter pore size of 2 µm. The smearing of substrates to prevent particles from bouncing back from the substrates and the gravimetric analysis are described in
J. V. Niemi et al.: Aerosol episodes in Finland caused by wildfires 2301
Table 1. Description of measurement and sampling sites for different analyses.
Location Environment Particle mass Particle number Samples for ion Samples for
fraction size distribution chromatography SEM/EDX
measurement measurements measurements measurements
Hyyti¨al¨a Rural background Size fractionsa x
Virolahti Rural background PM10 x
Ut¨o Rural background x
¨
Aht¨ari Rural background x
Helsinki at Kallio Urban background PM10, PM2.5 x
Helsinki at Luukki Rural background PM10 x
Imatra at Mansikkala Urban PM10 x
aD
p<1 µm, 1–2.5 µm, 2.5–10 µm and >10 µm
detail by Laakso et al. (2003). The PM10 mass monitoring measurements performed in Virolahti, Helsinki (also PM2.5), and in Imatra are briefly described in Sects. 2.3 and 2.4.
Particle number size distributions were measured in the diameter range between 3 and 500 nm using a twin differ-ential mobility particle sizer (DMPS) in Hyyti¨al¨a. DMPS consists of a differential mobility analyser (DMA) and a con-densation nucleus counter (CNC). It classifies particles into size classes depending on the electrical mobility of the par-ticles. The different size classes are separated by changing the voltage difference inside the DMA. The size distribution of the sampled aerosol population is then determined in the CNC, which counts the number concentration of every size class. The twin DMPS system used consisted of two differ-ent DMPSs: the first classified particles from 3 to 10 nm and the second particles from 10 to 500 nm. Both systems used Hauke-type DMAs (Winklmayr et al., 1991) and a closed loop sheath flow arrangement (Jokinen and M¨akel¨a, 1997). The CNCs used were TSI Model 3025 and TSI Model 3010 in the first and second systems, respectively. Before the size characterization, the incoming aerosol was neutralized with a 2 mCi Krypton-85 beta source. The sampling height was 2 m above ground level. The time resolution was 10 min. The details of the DMPS sampling protocol are provided in Aalto et al. (2001).
2.3 Ion analyses
Rural background air quality is monitored at several mea-surement stations in Finland by the Finnish Meteorological Institute (FMI). We present ion measurement results from the EMEP stations in ¨Aht¨ari, Virolahti and Ut¨o. Daily total sus-pended particle (TSP) samples were collected using open-faced 2-stage filter packs (NILU Products AS) containing cellulose filters (Whatman 40, diameter 47 mm). Sulphate (SO2−4 ), total nitrate (NO−3+HNO3(g)) and total ammonium (NH+4+NH3(g)) were analysed with ion chromatography (IC, Dioine DX-500 and Waters). Details of the sampling and IC methods are described in Paatero et al. (2001). We also
com-pared the ion masses with the PM10masses measured in Vi-rolahti. The PM10mass was monitored with Eberline FH 62 I-R (Eberline Instruments), which is based on β-attenuation. 2.4 SEM/EDX analyses
Air quality is monitored at several measurement stations in the Helsinki metropolitan area by the Helsinki Metropolitan Area Council, and in Imatra by the Environment Office of Imatra. We selected particle samples for individual particle analyses collected at Kallio and Luukki in the Helsinki area during all three episodes studied, and at Mansikkala in Ima-tra during the last episode. Particle samples were collected with Eberline FH 62 I-R samplers (Eberline Instruments) on fibreglass filter tape. In all, 17 particle samples (9 PM2.5and 8 PM10 samples) collected during the episodes (13, 27, and 28 August, 5 and 6 September 2002) and on reference days (8, 10, and 16 March, 18 and 22 August, 17 and 22 Septem-ber 2002) were selected for the analyses.
The elemental compositions of individual particles and ag-glomerates were studied using scanning electron microscopy (SEM – ZEISS DSM 962) coupled with energy dispersive X-ray microanalyses (EDX – LINK ISIS with the ZAF-4 measurement program). The SEM/EDX samples were pre-pared by pressing a tape (Scotch Ruban Adhesive) attached to an aluminium plate onto the filter surface covered with particles. Then samples were coated with carbon (Agar SEM Carbon Coater) to make the sample surfaces conductive. The SEM/EDX was operated at accelerating voltage of 20 kV, and the counting time of the X-ray spectrum was 15 s. The elemental compositions of 100 randomly selected particles or agglomerates (minimum diameter 1 µm) were analysed from each sample. Submicron-sized particles had formed abundant large agglomerates during sampling and sample preparation for SEM/EDX analysis, enabling us to also ob-tain elemental information from the submicron size range by analysing these agglomerates. However, this agglomeration complicated detailed classification of fine particle types, and thus, only major differences in fine aerosols between episode
2302 J. V. Niemi et al.: Aerosol episodes in Finland caused by wildfires
18
Finland Imatra -20 0 20 40 60 80 100 120 2/8 6/8 10 /8 14 /8 18 /8 22 /8 26 /8 30 /8 3/9 7/9 11 /9 15 /9 Date of year 2002 M a s s c o n c en tr at ion ( µ g m -3 ) Helsinki PM10Helsinki PM2.5 Imatra PM10 Helsinki PM2.5 - PM10EPI-1 EPI-2 EPI-3
Fig.
1.
Fig.
2.
Romania Ukraine Baltic Sea Belarus Russia Black Sea Estonia Poland Finland Romania Black Sea Sweden Ukraine Belarus Russia Estonia Poland FinlandFig.
3.
Fig.
4.
0 500 1000 1500 2000 2500 3000 3500 2/8 6/8 10/8 14/8 18/8 22/8 26/8 30/8 3/9 7/9 11/9 15/9 Date of year 2002 N u m ber c o nc e n tr ati on ( c m -3 ) AccumAitken Nucl EPI-1 EPI-2 EPI-3Fgi.
5.
Fig.
6a.
Fig. 2. Daily PM10and PM2.5concentrations at Kallio in Helsinki and daily PM10concentration at Mansikkala in Imatra on 2 August– 15 September 2002. The three strong LRT episode periods (EPI-1, EPI-2 and EPI-3) are indicated with vertical lines. Note that the concentrations of coarse particles are depicted for figure clarity as the subtraction PM2.5-PM10which gives negative values.
18
Finland Imatra -20 0 20 40 60 80 100 120 2/8 6/8 10 /8 14 /8 18 /8 22 /8 26 /8 30 /8 3/9 7/9 11 /9 15 /9 Date of year 2002 M a s s c o n c en tr at ion ( µ g m -3 ) Helsinki PM10Helsinki PM2.5 Imatra PM10 Helsinki PM2.5 - PM10EPI-1 EPI-2 EPI-3
Fig.
1.
Fig.
2.
Romania Ukraine Baltic Sea Belarus Russia Black Sea Estonia Poland Finland Romania Black Sea Sweden Ukraine Belarus Russia Estonia Poland FinlandFig.
3.
Fig.
4.
0 500 1000 1500 2000 2500 3000 3500 2/8 6/8 10 /8 14 /8 18 /8 22 /8 26 /8 30 /8 3/9 7/9 11 /9 15 /9 Date of year 2002 N u m ber c o nc e n tr ati on ( c m -3 ) AccumAitken Nucl EPI-1 EPI-2 EPI-3Fgi.
5.
Fig.
6a.
Fig. 3. Backward air mass trajectories (72 h) to Helsinki during the
strongest stage of the EPI-1 (13 August 2002). Vertical heights at the start were 10 m (green circles), 100 m (blue squares) and 500 m (red triangles) above ground level.
and reference days could be observed. The relative elemen-tal weight percentages (normalized to 100%) were calculated using ZAF-4 corrections for the following elements: Na, Mg, Al, Si, S, Cl, K, Ca, Ti and Fe. While the ZAF-corrected ele-mental results are semiquantitative, the accuracy is sufficient to identify different particle types and to compare differences
18
Finland Imatra -20 0 20 40 60 80 100 120 2/8 6/8 10/8 14/8 18/8 22/8 26/8 30/8 3/9 7/9 11/9 15/9 Date of year 2002 M a s s c o n c en tr at ion ( µ g m -3 ) Helsinki PM10Helsinki PM2.5 Imatra PM10 Helsinki PM2.5 - PM10EPI-1 EPI-2 EPI-3
Fig.
1.
Fig.
2.
Romania Ukraine Baltic Sea Belarus Russia Black Sea Estonia Poland Finland Romania Black Sea Sweden Ukraine Belarus Russia Estonia Poland FinlandFig.
3.
Fig.
4.
0 500 1000 1500 2000 2500 3000 3500 2/8 6/8 10/8 14/8 18/8 22/8 26/8 30/8 3/9 7/9 11/9 15/9 Date of year 2002 N u m ber c o nc e n tr ati on ( c m -3 ) AccumAitken Nucl EPI-1 EPI-2 EPI-3Fgi.
5.
Fig.
6a.
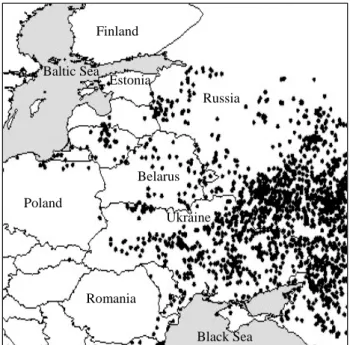
Fig. 4. MODIS fire detections in Eastern Europe during EPI-1 (10–
15 August 2002).
in elemental ratios of the same particle type in different sam-ples (Kupiainen et al., 2003; Niemi et al., 2004).
3 Results and discussion
3.1 General description of LRT episodes
PM10and PM2.5 concentrations rose to extraordinarily high levels in Finland during three periods in August and Septem-ber 2002. We focus on the strongest periods of these episodes; the first episode (EPI-1) was on 12–15 August, the second (EPI-2) on 26–28 August and the third (EPI-3) on 5–6 September (Fig. 2). These episodes were also ob-served in Estonia and Sweden (Niemi et al., 2003; R¨ais¨anen et al., 2004). In Finland, the episodes were strongest in the south, but they were observed, albeit more weakly, over a wide area, including as far north as Oulu, 600 km from the southern coast of Finland. The maximum hourly PM10 concentrations in southern Finland during the episodes were 70–90 µg m−3, whereas the typical values in this area are ∼15–20 µg m−3(Anttila et al., 2003). EPI-3 was especially strong in southeastern Finland, where the maximum hourly PM10 concentrations were 200–220 µg m−3. Most of the particle mass was in the PM2.5 size range, and PM2.5 val-ues observed during the episodes were multifold compared with long-term mean values. At Kallio in Helsinki, for ex-ample, the maximum hourly PM2.5 values (maximum 24-h mean values in parentheses) were 45 (33), 54 (42) and 81 (29) µg m−3 during EPI-1, EPI-2 and EPI-3, respectively, whereas the three-year (1999–2001) summer-autumn mean
J. V. Niemi et al.: Aerosol episodes in Finland caused by wildfires 2303
Table 2. Mass and number size fractions in Hyyti¨al¨a during episodes (12–15 August, 26–27 August and 6–8 September 2002) and on
reference days (2 August–15 September 2002, excluding episode days). Sample change time was 05:00 UTC. We also show three-year (1999–2001) mean summer-autumn values (Laakso et al., 2003) and values measured during an episode in March (17–19 March 2002) (Niemi et al., 2004).
PM1 PM1−2.5 PM2.5−10 PM>10 Nucl. Aitken Accum. Total
(3–25 nm) (25–90 nm) (90–500 nm) (3–500 nm) µg m−3 µg m−3 µg m−3 µg m−3 # cm−3 # cm−3 # cm−3 # cm−3 Reference days 5.3 1.2 1.2 0.6 489 1138 591 2219 *343 *2072 Episode days 15.9 3.7 2.3 0.7 226 588 1067 1880 *174 *1828 Summer-autumn mean 4.6 1.2 1.3 – *365 1065 710 *2130 (Laakso et al., 2003) March episode 15.4 6.9 2.3 0.3 273 955 2703 3924 (Niemi et al., 2004) *211 *3867
* Denotes the concentration calculated with nucleation mode limits 10–25 nm, as in Laakso et al. (2003).
was only 7.9 µg m−3(Laakso et al., 2003). The concentra-tions of coarse particles (low PM2.5-PM10 values in Fig. 2) also increased slightly during the episodes, especially during EPI-1.
August and the beginning of September 2002 were ex-ceptionally warm and dry in Finland and in the neighbour-ing areas. For example, the monthly mean temperature at Kaisaniemi in Helsinki was 19.4◦C in August, whereas the long-term (1971–2002) mean value was 15.8◦C. The total monthly precipitation values were 6 and 5 mm in August and September, respectively, while the corresponding long-term (1971–2000) mean values were 78 and 66 mm. August 2002 was the warmest August and September 2002 the dri-est September of a 100-year period. During the episodes at Pasila in Helsinki the wind speed (hourly mean) was 2–6 m s−1, relative humidity 40–90% and temperature 15–28◦C.
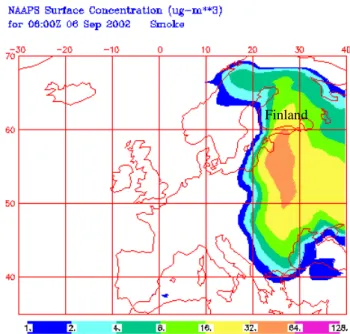
The backward trajectories showed that air masses during EPI-1 arrived in Helsinki from eastern Estonia, Russia and Ukraine (Fig. 3). During EPI-2 the trajectories curved along a more western route, and air masses arrived in Helsinki from Russia via the Baltic Sea and the Baltic countries (Estonia, Latvia and Lithuania). EPI-3 was strongest in southeastern Finland, and air masses arrived over Virolahti and Imatra from the direction of Russia and eastern Estonia. The satel-lite observations of potential fire areas indicated that there were many wildfires in Russia, Ukraine, Belarus and the Baltic countries during the episodes. The number of fires near Finland was high before and during EPI-1 (Fig. 4). High emissions from large forest and peat fires led to accumulation of large smoke plumes over Eastern Europe (Goldammer, 2003). The NAAPS model results indicated that the strongest smoke plumes reached Finland during EPI-2 and especially during EPI-3 (Fig. 5).
18
Finland Imatra -20 0 20 40 60 80 100 120 2/8 6/8 10 /8 14 /8 18 /8 22 /8 26 /8 30 /8 3/9 7/9 11 /9 15 /9 Date of year 2002 M a s s c o n c en tr at ion ( µ g m -3 ) Helsinki PM10Helsinki PM2.5 Imatra PM10 Helsinki PM2.5 - PM10EPI-1 EPI-2 EPI-3
Fig.
1.
Fig.
2.
Romania Ukraine Baltic Sea Belarus Russia Black Sea Estonia Poland Finland Romania Black Sea Sweden Ukraine Belarus Russia Estonia Poland FinlandFig.
3.
Fig.
4.
0 500 1000 1500 2000 2500 3000 3500 2/8 6/8 10 /8 14 /8 18 /8 22 /8 26 /8 30 /8 3/9 7/9 11 /9 15 /9 Date of year 2002 N u m ber c o nc e n tr ati on ( c m -3 ) AccumAitken Nucl EPI-1 EPI-2 EPI-3Fgi.
5.
Fig.
6a.
Fig. 5. NAAPS model results showing surface smoke
concentra-tions for the strongest stage of EPI-3 (6 September 2002).
3.2 Particle mass and number size distributions
We compared the particle mass and number size fractions at the Hyyti¨al¨a measurement station during the three episodes (12–15 August, 26–27 August and 6–8 September 2002) with reference periods surrounding the episodes (2 August– 15 September 2002) (Table 2). Because the sample collec-tion times for mass concentracollec-tion measurements were 2–3 days, we had to select slightly different periods for EPI-2 and EPI-3 in this section compared with other sections of this paper. Most of the particle mass was in the submicrometre
2304 J. V. Niemi et al.: Aerosol episodes in Finland caused by wildfires
18
Finland Imatra -20 0 20 40 60 80 100 120 2/8 6/8 10 /8 14 /8 18 /8 22 /8 26 /8 30 /8 3/9 7/9 11 /9 15 /9 Date of year 2002 M a s s c o n c en tr at ion ( µ g m -3 ) Helsinki PM10Helsinki PM2.5 Imatra PM10 Helsinki PM2.5 - PM10EPI-1 EPI-2 EPI-3
Fig.
1.
Fig.
2.
Romania Ukraine Baltic Sea Belarus Russia Black Sea Estonia Poland Finland Romania Black Sea Sweden Ukraine Belarus Russia Estonia Poland FinlandFig.
3.
Fig.
4.
0 500 1000 1500 2000 2500 3000 3500 2/8 6/8 10/8 14/8 18/8 22/8 26/8 30/8 3/9 7/9 11/9 15/9 Date of year 2002 N u m ber c o nc e n tr ati on ( c m -3 ) AccumAitken Nucl EPI-1 EPI-2 EPI-3Fgi.
5.
Fig.
6a.
(a)
19
0 20 40 60 80 100 120 0 5 10 15 20 25 Ion sum (µg m -3 ) P M 10 ( µ g m -3 ) Reference EPI-3 EPI-2 EPI-10.0 0.5 1.0 1.5 2.0 2.5 3.0 3.5 2/8 6/8 10 /8 14 /8 18 /8 22 /8 26 /8 30 /8 3/9 7/9 11 /9 15 /9 Date of year 2002 N u m ber c o nc en tr ati on r a tio Accum/Aitken Accum/Total Nucl/Total
EPI-1 EPI-2 EPI-3
0 2 4 6 8 10 12 2/ 8 6/ 8 10 /8 14 /8 18 /8 22 /8 26 /8 30 /8 3/9 7/9 11 /9 15 /9 Date of year 2002 M a s s c o nc e n tr ati o n ( µ g m -3 ) SO4 HNO3 + NO3 NH3 + NH4
EPI-1 EPI-2 EPI-3
Fig.
6b.
Fig.
7.
0 10 20 30 40 50 60 70 80 90 100 Ref. 13/8 EPI-1 27/8 EPI-2 28/8 EPI-2 Ref. 6/9 EPI-3 R e la tiv e fr ac tio n ( % ) Low -Z Na or Cl Fe Ca Si or Al S PM10 Imatra PM2.5 HelsinkiFig.
8.
Fig.
9.
0 10 20 30 40 50 60 S Na Si K Ca Al Fe Mg Cl ZA F-c o rr e c te d re la tiv e w e ig h t-%Reference EPI-1 EPI-2 EPI-3
C Ca K S Si Na O
Fig. 10.
(b) Fig. 6. (a) 24-h mean number concentrations of nucleation mode (Nucl, diameter 3–25 nm), Aitken mode (Aitken, 25–90 nm) andaccumu-lation mode (Accum, 90–500 nm) particles, and (b) selected ratios of different modes and total amount (3–500 nm) of particles in Hyyti¨al¨a on 2 August–15 September 2002. Sample change time was 05:00 (UTC).
19
0 20 40 60 80 100 120 0 5 10 15 20 25 Ion sum (µg m -3 ) P M 10 ( µ g m -3 ) Reference EPI-3 EPI-2 EPI-10.0 0.5 1.0 1.5 2.0 2.5 3.0 3.5 2/8 6/8 10 /8 14 /8 18 /8 22 /8 26 /8 30 /8 3/9 7/9 11 /9 15 /9 Date of year 2002 N u m ber c o nc en tr ati on r a tio Accum/Aitken Accum/Total Nucl/Total
EPI-1 EPI-2 EPI-3
0 2 4 6 8 10 12 2/ 8 6/ 8 10 /8 14 /8 18 /8 22 /8 26 /8 30 /8 3/9 7/9 11 /9 15 /9 Date of year 2002 M a s s c o nc e n tr ati o n ( µ g m -3 ) SO4 HNO3 + NO3 NH3 + NH4
EPI-1 EPI-2 EPI-3
Fig.
6b.
Fig.
7.
0 10 20 30 40 50 60 70 80 90 100 Ref. 13/8 EPI-1 27/8 EPI-2 28/8 EPI-2 Ref. 6/9 EPI-3 R e la tiv e fr ac tio n ( % ) Low -Z Na or Cl Fe Ca Si or Al S PM10 Imatra PM2.5 HelsinkiFig.
8.
Fig.
9.
0 10 20 30 40 50 60 S Na Si K Ca Al Fe Mg Cl ZA F-c o rr e c te d re la tiv e w e ig h t-%Reference EPI-1 EPI-2 EPI-3
C Ca K S Si Na O
Fig. 10.
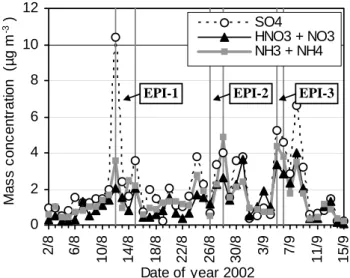
Fig. 7. 24-h mean total suspended particle (TSP) concentra-tions of SO2−4 , total nitrate (NO−3+HNO3(g)) and total ammo-nium (NH+4+NH3(g)) in Virolahti on 2 August–15 September 2002. Sample change time was 06:00 (UTC).
size range during all episodes as well as on reference days. During the episodes the particle mass increased on average by a factor of 3 for the size classes PM1and PM1−2.5 and by a factor of 2 for the size class PM2.5−10, but for the size class exceeding PM10 the concentration remained at about reference levels. During the three episodes all of these PM concentrations were close to those observed during the LRT episode in March 2002, which originated from agricultural
field burning emissions mixed with fossil fuel burning emis-sions (Niemi et al., 2004).
The particle number concentration increased on average by a factor of 1.8 in the accumulation mode and decreased by a factor of 0.5 in the Aitken and nucleation modes (Ta-ble 2 and Fig. 6a). The decrease of the smallest particles was expected since small molecular clusters and particles are scavenged efficiently by a large number of bigger particles (see e.g. M¨onkk¨onen et al., 2004). Abundant surface area of larger particles also consumes condensable vapours, pre-venting particle formation and growth. The total concentra-tion of particles with a diameter less than 500 nm was fairly unaffected since the decrease in nucleation and Aitken mode concentrations was balanced by the increase in accumulation mode concentrations.
Figure 6b shows how big a fraction of particles smaller than 500 nm in diameter belong to accumulation and nucle-ation modes. The ratio of accumulnucle-ation mode concentrnucle-ation to Aitken mode concentration (Accum/Aitken) is also shown. The Aitken mode particles can not be transported in the at-mosphere as far as accumulation mode particles The depo-sition efficiency of Aitken mode particles is high, they dis-appear by colliding and sticking to the accumulation mode particles, and they grow fast due to condensation of vapours (Seinfeld and Pandis, 1998, p. 100, 662, 971, 1020). Fur-thermore, the sources of Aitken mode particles are scarce in the areas around Hyyti¨al¨a. Thus, Aitken mode concentra-tions in Hyyti¨al¨a normally exceed those of the accumulation mode, and an Accum/Aitken ratio greater than one is typical of polluted air masses transported over long distances. High values (>1) of Accum/Aitken might thus be an indicator of
J. V. Niemi et al.: Aerosol episodes in Finland caused by wildfires 2305
19
0 20 40 60 80 100 120 0 5 10 15 20 25 Ion sum (µg m -3 ) P M 10 ( µ g m -3 ) Reference EPI-3 EPI-2 EPI-10.0 0.5 1.0 1.5 2.0 2.5 3.0 3.5 2/8 6/8 10 /8 14 /8 18 /8 22 /8 26 /8 30 /8 3/9 7/9 11 /9 15 /9 Date of year 2002 N u m ber c o nc en tr ati on r a tio Accum/Aitken Accum/Total Nucl/Total
EPI-1 EPI-2 EPI-3
0 2 4 6 8 10 12 2/ 8 6/ 8 10 /8 14 /8 18 /8 22 /8 26 /8 30 /8 3/ 9 7/ 9 11 /9 15 /9 Date of year 2002 M a s s c o nc e n tr ati o n ( µ g m -3 ) SO4 HNO3 + NO3 NH3 + NH4
EPI-1 EPI-2 EPI-3
Fig.
6b.
Fig.
7.
0 10 20 30 40 50 60 70 80 90 100 Ref. 13/8 EPI-1 27/8 EPI-2 28/8 EPI-2 Ref. 6/9 EPI-3 R e la tiv e fr ac tio n ( % ) Low -Z Na or Cl Fe Ca Si or Al S PM10 Imatra PM2.5 HelsinkiFig.
8.
Fig.
9.
0 10 20 30 40 50 60 S Na Si K Ca Al Fe Mg Cl ZA F-c o rr e c te d re la tiv e w e ig h t-%Reference EPI-1 EPI-2 EPI-3
C Ca K S Si Na O
Fig. 10.
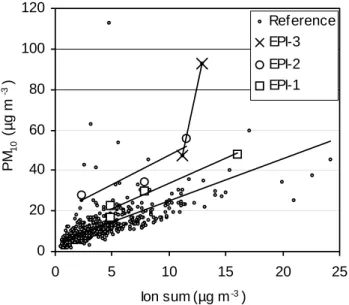
Fig. 8. Scatter plot and linear trend lines between 24-h mean ion
sum and PM10 concentrations in Virolahti during EPI-1 (12–15 August 2002), EPI-2 (26–28 August 2002), EPI-3 (5–6 September 2002) and reference days (3 July 2002–31 December 2003).
different LRT episodes in general. This concept is also sup-ported by the observations made during the LRT episode in March 2002.
3.3 Ion analyses
The 24-h mean TSP concentrations of sulphate, total nitrate and total ammonium increased strongly at the rural EMEP station of Virolahti during the episodes (Fig. 7). The ion sums (total amounts) of these chemical components were 8.2, 7.2 and 12.1 µg m−3during EPI-1, EPI-2 and EPI-3, respec-tively. The ion sums in Ut¨o were about the same level as in Virolahti, whereas those in ¨Aht¨ari, a more northern station (see Fig. 1), were clearly lower (factor of 2/3). The values during the episodes were 3–4 times higher than those usu-ally observed at these three stations at this time of the year (Leinonen, 2001).
We compared ion sums and PM10 concentrations mea-sured in Virolahti during the episodes and the reference pe-riod (Fig. 8). The ion sum to PM10 ratios were lower than usual during the episodes; the means were 0.28, 0.18, 0.17 and 0.33 during EPI-1, EPI-2, EPI-3 and the reference pe-riod, respectively, and the differences between episodes and reference period were statistically significant (p<0.001, One Sample T-test, SPSS 10.0 statistical program). This indi-cates that the particle matter during the episodes contained unusually high fractions of chemical components other than sulphate, nitrate and ammonium. The ion sum to PM10 ra-tio was especially low (0.14) during the peak stage of EPI-3 (6 September 2002), when the strongest smoke plume from wildfires reached southeastern Finland. Large emissions of
19
0 20 40 60 80 100 120 0 5 10 15 20 25 Ion sum (µg m -3 ) P M 10 ( µ g m -3 ) Reference EPI-3 EPI-2 EPI-10.0 0.5 1.0 1.5 2.0 2.5 3.0 3.5 2/8 6/8 10 /8 14 /8 18 /8 22 /8 26 /8 30 /8 3/9 7/9 11 /9 15 /9 Date of year 2002 N u m ber c o nc en tr ati on r a tio Accum/Aitken Accum/Total Nucl/Total
EPI-1 EPI-2 EPI-3
0 2 4 6 8 10 12 2/ 8 6/ 8 10 /8 14 /8 18 /8 22 /8 26 /8 30 /8 3/ 9 7/ 9 11 /9 15 /9 Date of year 2002 M a s s c o nc e n tr ati o n ( µ g m -3 ) SO4 HNO3 + NO3 NH3 + NH4
EPI-1 EPI-2 EPI-3
Fig.
6b.
Fig.
7.
0 10 20 30 40 50 60 70 80 90 100 Ref. 13/8 EPI-1 27/8 EPI-2 28/8 EPI-2 Ref. 6/9 EPI-3 R e la tiv e fr ac tio n ( % ) Low -Z Na or Cl Fe Ca Si or Al S PM10 Imatra PM2.5 HelsinkiFig.
8.
Fig.
9.
0 10 20 30 40 50 60 S Na Si K Ca Al Fe Mg Cl ZA F-c o rr e c te d re la tiv e w e ig h t-%Reference EPI-1 EPI-2 EPI-3
C Ca K S Si Na O
Fig. 10.
Fig. 9. Abundance of particle groups (%) in reference samples and
episode samples collected at Kallio station in Helsinki during EPI-1 (13 August 2002) and EPI-2 (27 August and 28 August 2002), and at Mansikkala station in Imatra during EPI-3 (6 September 2002).
organic and black carbon and other chemical components from wildfires were probably the main reason for the re-duction in the relative fraction of the ion sum during the episodes, as will be discussed below.
3.4 SEM/EDX analyses
We analysed the elemental composition of single particles and agglomerates with SEM/EDX from samples collected during the episodes and the reference days. The particles and agglomerates were classified into six different groups based on the most abundant element in each particle or agglomer-ate: (1) S, (2) Si or Al, (3) Ca, (4) Fe, (5) Na or Cl, (6) low-Z. Particles and agglomerates in the low-Z class contained only elements with an atomic number lower than 11 (Na), such as C, N and O, which could not be analysed quantitatively with the SEM/EDX used. We also classified particles and agglomerates with hierarchical cluster analysis (SPSS 10.0 statistical program) using Ward’s method with squared Eu-clidean measures, which is well-suited to grouping different particle types (Bernard and Van Grieken, 1992). However, the elemental composition of the main fine particle group (S-rich) during the episodes proved to be so homogeneous (presumably partly due to agglomeration of particles during sampling) that we show only a few details of the clustering classification for coarse particles.
The amount of S-rich particles and agglomerates was ex-traordinarily high during the episodes (Fig. 9). The PM2.5 samples of the urban background station at Kallio contained 65% and 71% S-rich particles and agglomerates during the
2306 J. V. Niemi et al.: Aerosol episodes in Finland caused by wildfires
19
0 20 40 60 80 100 120 0 5 10 15 20 25 Ion sum (µg m -3 ) P M 10 ( µ g m -3 ) Reference EPI-3 EPI-2 EPI-10.0 0.5 1.0 1.5 2.0 2.5 3.0 3.5 2/8 6/8 10/8 14/8 18/8 22/8 26/8 30/8 3/9 7/9 11/9 15/9 Date of year 2002 N u m ber c o nc en tr ati on r a tio Accum/Aitken Accum/Total Nucl/Total
EPI-1 EPI-2 EPI-3
0 2 4 6 8 10 12 2/ 8 6/ 8 10 /8 14 /8 18 /8 22 /8 26 /8 30 /8 3/ 9 7/ 9 11 /9 15 /9 Date of year 2002 M a s s c o nc e n tr ati o n ( µ g m -3 ) SO4 HNO3 + NO3 NH3 + NH4
EPI-1 EPI-2 EPI-3
Fig.
6b.
Fig.
7.
0 10 20 30 40 50 60 70 80 90 100 Ref. 13/8 EPI-1 27/8 EPI-2 28/8 EPI-2 Ref. 6/9 EPI-3 R e la tiv e fr ac tio n ( % ) Low -Z Na or Cl Fe Ca Si or Al S PM10 Imatra PM2.5 HelsinkiFig.
8.
Fig.
9.
0 10 20 30 40 50 60 S Na Si K Ca Al Fe Mg Cl ZA F-c o rr e c te d re la tiv e w e ig h t-%Reference EPI-1 EPI-2 EPI-3
C Ca K S Si Na O
Fig. 10.
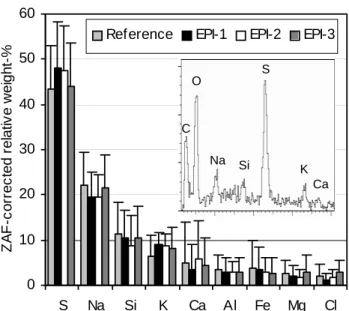
Fig. 10. Average weight percentages of selected elements in
S-rich particles and agglomerates (typical SEM/EDX spectrum also shown) in PM2.5 samples collected at Kallio in Helsinki during EPI-1, EPI-2 and reference days, and in PM10samples collected in Helsinki and in Imatra during EPI-3. Error bars represent standard deviation (SD). Results are semiquantitative and weight percentages of selected elements are normalized to 100%.
peak days of EPI-1 and EPI-2, respectively, but only on av-erage 10% (range 7–13%) during reference days. EPI-3 was clearly strongest in southeastern Finland, but unfortunately no PM2.5 samples were collected there during this period. We therefore studied PM10samples collected at urban station in Imatra. The fraction of S-rich particles and agglomerates was also very high (55%) during the peak day of EPI-3 in Imatra compared with the value (3%) for the reference day.
In addition to S, S-rich particles and agglomerates con-tained large amounts of C and O as well as some Na, Si and K (EDX spectra shown in Fig. 10). The presence of C was confirmed by analysing some S-rich particles and agglomer-ates directly on the gold-coated surface of (C-free) fibreglass filters. Particles and agglomerates also contained ammonium and nitrate (see IC results in previous section), but N could not be analysed with the EDX used. The fractions of other elements were usually quite low, but some of the particles and agglomerates contained also elevated concentrations of Ca.
The elemental ratios of S-rich particles and agglomerates in different samples were compared (Fig. 10). K was the only element for which the relative weight percentage had statisti-cally significant (p<0.01, Mann-Whitney U-test, SPSS 10.0 statistical program) differences between episode and refer-ence samples. The relative weight percentages (sum of all analysed elements normalized to 100%) of K in S-rich parti-cles and agglomerates were higher during all episodes (8.9% EPI-1, 8.9% EPI-2 and 8.2% EPI-3) than on reference days
(6.3%). The median S/K ratios of S-rich particles showed the same change; S/K ratios were lower during EPI-1 (5.5), EPI-2 (5.4) and EPI-3 (6.0) compared with reference days (7.8). The increased fraction of K is an indication of emis-sions from biomass burning (Andreae, 1983; Andreae et al., 1998). S-rich particles also contained some Na and Si, which may have originated partly from biomass burning but also from many other sources, e.g. marine aerosols, fossil fuel burning and refuse incineration (Watson et al., 2001; Ooki et al., 2002).
The relative weight percentages of K in S-rich particles did not rise (range 8.2–8.9%) as high as during the LRT PM2.5 episode in March 2002 (range 11.4–19.3%), which originated from agricultural field burning emissions mixed with fossil fuel burning emissions (Niemi et al., 2004). The median S/K ratios of S-rich particles were also higher dur-ing EPI-1 (5.5), EPI-2 (5.4) and EPI-3 (6.0) than durdur-ing the March episode (range 2.1–5.2). Smouldering burning condi-tions are more dominant in boreal forest fires and peat fires than in grass, shrub or cereal waste fires, which mainly burn in flaming conditions (Echalar et al., 1995; Lavoue et al., 2000; Ortiz de Z´arate et al., 2000; Soja et al., 2004). Thus, it seems likely that aerosols from forest and peat fires were less enriched with K than aerosols from agricultural field burning since the fraction of K is lower in the emissions from smoul-dering fires than in those from flaming fires (Echalar et al., 1995; Gaudichet et al., 1995; Robinson et al., 2004). An-other reason for the relatively low proportion of K was prob-ably the mixing of emissions from fossil fuel burning since air masses arrived from the regions of Eastern Europe with high S emissions (EMEP, 2001). However, the fraction of fossil fuel burning emissions in LRT particle mass was prob-ably smaller during the wildfire episodes than in the March 2002 episode because the relative weight ratio of S in S-rich particles did not rise as high as during the peak stage of the March episode (61%) (Niemi et al., 2004).
The PM measurements in Helsinki showed that mass con-centrations of coarse (PM2.5−10) particles also increased slightly during the episodes (see Fig. 2). Since Si-Al-rich particles are usually clearly the dominating group of PM10 particles in Helsinki and other Finnish cities (Haapala, 1999; R¨ais¨anen et al., 2004), we compared the relative fractions of the Si-Al-rich group with the other groups. The ratio of Ca-rich to Si-Al-Ca-rich particle groups proved to be exceptionally high during all three episodes in Helsinki, and also in Imatra during EPI-3 (Table 3). The ratios were 0.24–0.53, which are 3–7 times higher than the values of the reference days and the long-term averages in Helsinki and Lappeenranta (Haapala, 1999; R¨ais¨anen et al., 2004).
The increased proportions of Ca-rich particles in PM10 samples indicate that coarse Ca-rich particles were also brought by LRT during the episodes. Their mode and me-dian sizes (geometric diameter) were 2 and 3 µm, respec-tively. The elemental combinations of Ca-rich particles were investigated with cluster analysis, and typical combinations
J. V. Niemi et al.: Aerosol episodes in Finland caused by wildfires 2307
Table 3. Number ratio of particles in the Ca-rich particle group and in the Si-Al-rich particle group during episodes (13 August EPI-1, 28
August EPI-2 and 5–6 September 2002 EPI-3) and on reference days (Helsinki 22 August 2002 and Imatra 17 September 2002). We also show mean long-term values of the same ratio calculated from Haapala (1999) and from R¨ais¨anen et al. (2004).
EPI-1 EPI-2 EPI-3 EPI-3 Reference Haapala (1999)a R¨ais¨anen et al. (2004)b
Sampling location Helsinki Helsinki Helsinki Imatra Helsinki Helsinki Lappeenranta
and Imatra
Number of analysed Ca-rich 77 81 91 35 107 700 1270
and Si-Al-rich particles
Ratio of Ca-rich and 0.24 0.53 0.45 0.49 0.08 0.07 0.11
Si-Al-rich groups (SD) (0.07) (0.07)
a18 samples collected between March and April 1998
b13 samples collected between March and June 2003; Lappeenranta is a small town located ∼35 km southwest of Imatra
were Ca, Ca-S-(Si-Na), Ca-(S-Si-Al) and Ca-Mg-(Si) (minor elements in parentheses). The elemental combinations sug-gest that major components of Ca-rich particles might have been CaCO3, CaSO4and CaMg(CO3)2.
Forest and peat fires were probably one of the major sources of Ca-rich particles during the episodes since Ca-rich particles are emitted from incomplete burning of biomass and most of their mass is in the coarse (Dp>1 µm) size frac-tion (Allen and Miguel, 1995; Osan et al., 2002; Li et al., 2003; Pagels et al., 2003). Intensive fires also mobilize par-ticles from the surfaces of plants and the ground (Allen and Miguel, 1995; Gaudichet et al., 1995; Pereira et al., 1996). The injection heights of particles from forest fires are in mod-erate surface fires usually ∼2.3 km or less and in intensive crown fires ∼5–12 km (Lavoue et al., 2000). The smallest particles of the coarse size fraction may therefore be trans-ported from the wildfire areas to Finland.
Ca-rich particles are also emitted from many other sources, including fossil fuel burning and the cement and metal industries (Hoornaert et al., 1996; Lee and Pacyna, 1999). The trajectories indicated that air masses arrived in Helsinki during EPI-1 and in Imatra during EPI-3 via Esto-nian and Russian oil-shale-burning industrial areas located in Narva (see Figs. 1 and 3) and Slantsy (∼25 km south of Narva). This area is one of the strongest particle sources in Northern Europe (EMEP, 2002), and the Ca content of emis-sions is high (H¨as¨anen et al., 1997; Jalkanen et al., 2000; Tervahattu et al., 2004). These large emissions occasionally increase particle concentrations, even in southern Finland un-der suitable meteorological conditions (Jalkanen et al., 2000; Tervahattu et al., 2004). Thus, it is likely that Ca-rich par-ticles may also have been transported from the regions of Narva and Slantsy to Helsinki during EPI-1 and to Imatra during EPI-3.
4 Summary and conclusions
Strong LRT PM2.5episodes occurred on 12–15 August, 26– 28 August and 5–6 September 2002 over large areas of Fin-land. Backward air mass trajectories, satellite detections of fire areas and dispersion modelling results indicate that emis-sions from wildfires in Russia and other Eastern European countries arrived in Finland during the episodes. The com-position of individual particles and agglomerates was stud-ied using scanning electron microscopy (SEM) coupled with energy dispersive X-ray microanalyses (EDX), and the bulk chemical concentrations of sulphate (SO2−4 ), total nitrate (NO−3+HNO3(g)) and total ammonium (NH+4+NH3(g)) were studied using ion chromatography (IC). SEM/EDX analy-sis showed that the proportion of S-rich particles and ag-glomerates (agglomeration was caused partly by the sam-pling method used) increased strongly during the episodes and that the relative weight percentage (all analyzed elements normalized to 100%) of K was unusually high in these par-ticles. Median S/K ratios, for instance, were clearly lower during EPI-1 (5.5), EPI-2 (5.4) and EPI-3 (6.0) than on ref-erence days (7.8). The high proportion of K indicates emis-sions from biomass burning. These aerosols were mixed with S-rich emissions from fossil fuel burning during the trans-port since air masses came through polluted areas of Eu-rope. Minor amounts of coarse Ca-rich particles were also long-range transported during the episodes, and they proba-bly originated from wildfires and/or from Estonian and Rus-sian oil-shale-burning industrial areas. The concentrations of sulphate, total nitrate and total ammonium increased dur-ing the episodes, but the ratio of total concentrations of these ions to PM10concentration decreased. This also confirms the presence of high amounts of particles originating from un-usual (the above mentioned) emission sources. The compo-sition of particles during the episodes was compared with an earlier LRT PM2.5episode originating from spring-time agri-cultural field burning, and the relative fraction of K was lower during the wildfire episodes, probably due to the dominance
2308 J. V. Niemi et al.: Aerosol episodes in Finland caused by wildfires
of smouldering burning conditions during boreal forest and peat fires.
The particle mass fractions were measured using a 3-stage impactor with a backup filter. Most of the LRT particle mass was in the submicrometre size fraction, and the mass of the submicrometre particles increased on an average by a fac-tor of 3 during the episodes. The particle number size dis-tributions were measured with differential mobility particle sizer (DMPS), and the number concentration of particles 90– 500 nm increased by a factor of 1.8 during the episodes, but the concentrations of particles smaller than 90 nm were re-duced. The reduction of the smallest particles was caused by suppressed new particle formation due to the small vapour and molecular cluster uptake of LRT particles. These results show how strongly the LRT of particles affect not only the fine particle mass but also the number size distributions of submicron particles. The high values (>1) of accumulation mode to Aitken mode number concentration ratios might be an indicator of different LRT episodes in general because Aitken mode particles can not be transported in the atmo-sphere as far as accumulation mode particles.
Our results show that the emissions from wildfires in Rus-sian and other Eastern European substantially affected PM2.5 concentrations over very large areas, even at distances of over 1000 km from the fire areas. The wildfire season in 2002 was exceptionally severe in Eastern Europe. How-ever, the measurements by fire-monitoring satellites (http: //firemaps.geog.umd.edu) and NAAPS model results (http: //www.nrlmry.navy.mil/aerosol/) indicate that smoke from uncontrolled fires (and from agricultural field burning) is generally an important factor in the deterioration of air qual-ity locally and occasionally even regionally in eastern and southern parts of Europe.
Acknowledgements. We thank the Helsinki University
Environ-mental Research Centre, the Finnish Cultural Foundation, the Helsinki Metropolitan Area Council and the Academy of Finland for funding this study. The Cooperative Institute for Research in Environmental Sciences, University of Colorado at Boulder, is gratefully acknowledged for a Visiting Fellowship (HT). We thank our colleagues at the following institutes for their collaboration during the work: P. Aalto and V. Hiltunen (Division of Atmospheric Sciences, University of Helsinki), R. Hillamo, J. Kukkonen and T. Salmi (Finnish Meteorological Institute), M. R¨ais¨anen (The Geological Survey of Finland), K. Kupiainen (Nordic Envicon Ltd.), K. Lounatmaa (Helsinki University of Technology) and O. H¨anninen (Department of Environmental Health, National Public Health Institute). The authors gratefully acknowledge the NOAA Air Resources Laboratory (ARL) for the provision of the HYSPLIT transport and dispersion model and READY website (http://www.arl.noaa.gov/ready.html) used in this publication. The Naval Research Laboratory is acknowledged for the NAAPS model results (http://www.nrlmry.navy.mil/aerosol) used in this article. Edited by: A. Petzold
References
Aalto, P., H¨ameri, K., Becker, E., Weber, R., Salm, J., M¨akel¨a, J. M., Hoell, C., O’Dowd, C. D., Karlsson, H., Hansson, H. C., V¨akev¨a, M., Koponen, I. K., Buzorius, G., and Kulmala, M.: Physical characterization of aerosol particles during nucleation events, Tellus, 53B, 344–358, 2001.
Allen, A. G. and Miguel, A. H.: Biomass burning in the Amazon – Characterization of the ionic component of aerosols generated from flaming and smoldering rain-forest and savanna, Environ. Sci. Technol., 29, 486–493, 1995.
Andreae, M. O.: Soot carbon and excess fine potassium: Long-range transport of combustion derived aerosols, Science, 220, 1148–1151, 1983.
Andreae, M. O., Andreae, T. W., Annegarn, H., Beer, J., Cachier, H., le Canut, P., Elbert, W., Maenhaut, W., Salma, I., Wienhold, F. G., and Zenker, T.: Airborne studies of aerosol emissions from savanna fires in southern Africa: 2. Aerosol chemical composi-tion, J. Geophys. Res., 103, 32 119–32 128, 1998.
Anttila, P., Alaviippola, B., and Salmi, T.: Air quality in Fin-land – monitoring results in relation to the guideline and limit values and comparision with European concentration levels (in Finnish with an English abstract) Finnish Meteorological Insti-tute, Helsinki, 2003.
Bernard, P. C. and Van Grieken, R. E.: Comparison and evaluation of hierarchical cluster techniques applied to automated electron probe x-ray microanalysis data, Anal. Chim. Acta, 267, 81–93, 1992.
Dockery, D. W. and Pope, C. A.: Acute respiratory effects of par-ticulate air-pollution, Annu. Rev. Public Health, 15, 107–132, 1994.
Draxler, R. R. and Rolph, G. D.: HYSPLIT (HYbrid Single-Particle Lagrangian Integrated Trajectory), Model access via NOAA ARL READY Website (http://www.arl.noaa.gov/ready/ hysplit4.html). NOAA Air Resources Laboratory, Silver Spring, MD, 2003.
Echalar, F., Gaudichet, A., Cachier, H., and Artaxo, P.: Aerosol Emissions by Tropical Forest and Savanna Biomass Burning – Characteristic Trace-Elements and Fluxes, Geophys. Res. Lett., 22, 3039–3042, 1995.
EMEP: Transboundary acidification and eutrophication and ground level ozone in Europe, Joint CIAM & CCC & MSC-W report, 2001.
EMEP: Transboundary particulate matter in Europe: Status Report 2002, pp. 89, EMEP Report 5/2002, 2002.
Gaudichet, A., Echalar, F., Chatenet, B., Quisefit, J. P., Malin-gre, G., Cachier, H., Buatmenard, P., Artaxo, P., and Maenhaut, W.: Trace-elements in tropical African savanna biomass burning aerosols, J. Atmos. Chem., 22, 19–39, 1995.
Goldammer, J. G.: The wildland fire season 2002 in the Russian Federation: An assessment by the Global Fire Monitoring Center (GFMC), International Forest Fire News (IFFN), 28, 2–14, 2003. Haapala, H.: Studies of inhalable particles of aerosol samplers, (Finnish report includes an abstract in English), pp. 37, Helsinki Metropolitan Area Council, Helsinki, 1999.
H¨as¨anen, E., AunelaTapola, L., Kinnunen, V., Larjava, K., Mehto-nen, A., Salmikangas, T., Leskel¨a, J., and Loosaar, J.: Emission factors and annual emissions of bulk and trace elements from oil shale fueled power plants, Sci. Total Environ., 198, 1–12, 1997. Hoornaert, S., Van Malderen, H., and Van Grieken, R.: Gypsum and
J. V. Niemi et al.: Aerosol episodes in Finland caused by wildfires 2309
other calcium-rich aerosol particles above the North Sea, Envi-ron. Sci. Technol., 30, 1515–1520, 1996.
Jalkanen, L., Makinen, A., H¨as¨anen, E., and Juhanoja, J.: The ef-fect of large anthropogenic particulate emissions on atmospheric aerosols, deposition and bioindicators in the eastern Gulf of Fin-land region, Sci. Total Environ., 262, 123–136, 2000.
Jokinen, V. and M¨akel¨a, J. M.: Closed loop arrangement with crit-ical orifice for DMA sheath/excess flow system, J. Aerosol Sci., 28, 643–648, 1997.
Justice, C. O., Giglio, L., Korontzi, S., Owens, J., Morisette, J. T., Roy, D., Descloitres, J., Alleaume, S., Petitcolin, F., and Kauf-man, Y.: The MODIS fire products, Remote Sens. Environ., 83, 244–262, 2002.
Karppinen, A., H¨ark¨onen, J., Kukkonen, J., Aarnio, P., and Kosken-talo, T.: Statistical model for assessing the portion of fine partic-ulate matter transported regionally and long range to urban air, Scandinavian Journal of Work, Environment & Health, 30, 47– 53, 2004.
Kulmala, M., H¨ameri, K., Aalto, P. P., M¨akel¨a, J. M., Pirjola, L., Nilsson, E. D., Buzorius, G., Rannik, ¨U., Dal Maso, M., Seidl, W., Hoffman, T., Janson, R., Hansson, H. C., Viisanen, Y., Laak-sonen, A., and O’Dowd, C. D.: Overview of the international project on biogenic aerosol formation in the boreal forest (BIO-FOR), Tellus, 53, 324–343, 2001.
Kupiainen, K., Tervahattu, H., and R¨ais¨anen, M.: Experimental studies about the impact of traction sand on urban road dust com-position, Sci. Total Environ., 308, 175–184, 2003.
Laakso, L., Hussein, T., Aarnio, P., Komppula, M., Hiltunen, V., Viisanen, Y., and Kulmala, M.: Diurnal and annual characteris-tics of particle mass and number concentrations in urban, rural and Arctic environments in Finland, Atmos. Environ., 37, 2629– 2641, 2003.
Laden, F., Neas, L. M., Dockery, D. W., and Schwartz, J.: Associ-ation of fine particulate matter from different sources with daily mortality in six US cities, Environ. Health Perspect., 108, 941– 947, 2000.
Lavoue, D., Liousse, C., Cachier, H., Stocks, B. J., and Goldammer, J. G.: Modeling of carbonaceous particles emitted by boreal and temperate wildfires at northern latitudes, J. Geophys. Res., 105, 26 871–26 890, 2000.
Lee, D. S. and Pacyna, J. M.: An industrial emissions inventory of calcium for Europe, Atmos. Environ., 33, 1687–1697, 1999. Leinonen, L.: Air quality measurements 2000, Finnish
Meteorolog-ical Institute, Helsinki, 2001.
Li, J., P´osfai, M., Hobbs, P. V., and Buseck, P. R.: Individual aerosol particles from biomass burning in southern Africa: 2, Compo-sitions and aging of inorganic particles, J. Geophys. Res., 108, 8484, doi:10.1029/2002JD002310, 2003.
M¨onkk¨onen, P., Koponen, I. K., Lehtinen, K. E. J., Uma, R., Srini-vasan, D., H¨ameri, K., and Kulmala, M.: Death of nucleation and Aitken mode particles: observations at extreme atmospheric conditions and their theoretical explanation, J. Aerosol. Sci., 35, 781–787, 2004.
Niemi, J., Tervahattu, H., Koskentalo, T., Sillanp¨a¨a, M., Hillamo, R., Kulmala, M., and Vehkam¨aki, H.: Studies on the long-range transport episodes of particles in Finland in March and August 2002 (Finnish report includes an abstract in English), pp. 58, Helsinki Metropolitan Area Council, Helsinki, 2003, avail-able also from internet URL: http://www.ytv.fi/ilmanl/aineisto/
kaukokulkeumaepisodi 2003.pdf.
Niemi, J. V., Tervahattu, H., Vehkam¨aki, H., Kulmala, M., Kosken-talo, T., Sillanp¨a¨a, M., and Rantam¨aki, M.: Characterization and source identification of a fine particle episode in Finland, Atmos. Environ., 38, 5003–5012, 2004.
Ooki, A., Uematsu, M., Miura, K., and Nakae, S.: Sources of sodium in atmospheric fine particles, Atmos. Environ., 36, 4367– 4374, 2002.
Ortiz de Z´arate, I., Ezcurra, A., Lacaux, J. P., and Van Dinh, P.: Emission factor estimates of cereal waste burning in Spain, At-mos. Environ., 34, 3183–3193, 2000.
Osan, J., Alfoldy, B., Torok, S., and Van Grieken, R.: Characteri-sation of wood combustion particles using electron probe micro-analysis, Atmos. Environ., 36, 2207–2214, 2002.
Paatero, J., Valkama, I., Makkonen, U., Laur´en, M., Salminen, K., Raittila, J., and Viisanen, Y.: Inorganic components of the ground-level air and meteorological parameters at Hyyti¨al¨a, Fin-land during the BIOFOR project 1998–1999, Finnish Meteoro-logical Institute, Helsinki, 2001.
Pagels, J., Strand, M., Rissler, J., Szpila, A., Gudmundsson, A., Bohgard, M., Lillieblad, L., Sanati, M., and Swietlicki, E.: Char-acteristics of aerosol particles formed during grate combustion of moist forest residue, J. Aerosol. Sci., 34, 1043–1059, 2003. Pakkanen, T. A., Loukkola, K., Korhonen, C. H., Aurela, M.,
Makela, T., Hillamo, R. E., Aarnio, P., Koskentalo, T., Kousa, A., and Maenhaut, W.: Sources and chemical composition of at-mospheric fine and coarse particles in the Helsinki area, Atmos. Environ., 35, 5381–5391, 2001.
Pereira, E. B., Setzer, A. W., Gerab, F., Artaxo, P. E., Pereira, M. C., and Monroe, G.: Airborne measurements of aerosols from burning biomass in Brazil related to the TRACE a experiment, J. Geophys. Res., 101, 23 983–23 992, 1996.
Pope, C. A., Burnett, R. T., Thun, M. J., Calle, E. E., Krewski, D., Ito, K., and Thurston, G. D.: Lung cancer, cardiopulmonary mortality, and long-term exposure to fine particulate air pollu-tion, Jama-Journal of the American Medical Associapollu-tion, 287, 1132–1141, 2002.
R¨ais¨anen, M., Niemi, J. V., Tervahattu, H., and Kupiainen, K.: Composition of aerosol particles in the region of Lappeenranta in 2002–2003 (in Finnish), pp. 57, City of Lappeenranta, 2004. Robinson, M. S., Chavez, J., Velazquez, S., and Jayanty, R. K. M.:
Chemical speciation of PM2.5 collected during prescribed fires of the Coconino national forest near Flagstaff, Arizona, J. Air Waste Manage. Assoc., 54, 1112–1123, 2004.
Rolph, G. D.: Real-time Environmental Applications and Dis-play sYstem (READY) Website (http://www.arl.noaa.gov/ready/ hysplit4.html), NOAA Air Resources Laboratory, Silver Spring, MD, 2003.
Ruoho-Airola, T., Anttila, P., and Salmi, T.: Airborne sulfur and ni-trogen in Finland – trends and exposure in relation to air transport sector, J. Environ. Monit., 6, 1–11, 2004.
Ruuskanen, J., Tuch, T., Ten Brink, H., Peters, A., Khlystov, A., Mirme, A., Kos, G. P. A., Brunekreef, B., Wichmann, H. E., and Buzorius, G.: Concentrations of ultrafine, fine and PM2.5 particles in three European cities, Atmos. Environ., 35, 3729– 3738, 2001.
Seinfeld, J. H. and Pandis, S. N.: Atmospheric Chemistry and Physics: From Air Pollution to Climate Change, John Wiley & Sons Inc, New York, 1998.
2310 J. V. Niemi et al.: Aerosol episodes in Finland caused by wildfires
Soja, A. J., Cofer, W. R., Shugart, H. H., Sukhinin, A. I., Stack-house, P. W., McRae, D. J., and Conard, S. G.: Estimating fire emissions and disparities in boreal Siberia (1998–2002), J. Geo-phys. Res., 109, D14S06, doi:10.1029/2004JD004570, 2004. Tervahattu, H., Hartonen, K., Kerminen, V. M., Kupiainen, K.,
Aarnio, P., Koskentalo, T., Tuck, A. F., and Vaida, V.: New evi-dence of an organic layer on marine aerosols, J. Geophys. Res., 107, 4053, doi:10.1029/2000JD000282, 2002a.
Tervahattu, H., Juhanoja, J., and Kupiainen, K.: Identification of an organic coating on marine aerosol particles by TOF-SIMS, J. Geophys. Res., 107, 4319, doi:10.1029/2001JD001403, 2002b. Tervahattu, H., Hongisto, M., Aarnio, P., Kupiainen, K., and
Sil-lanp¨a¨a, M.: Composition and origins of aerosol during a high PM10 episode in Finland, Boreal Env. Res., 9, 335–345, 2004. Vallius, M., Lanki, T., Tiittanen, P., Koistinen, K., Ruuskanen, J.,
and Pekkanen, J.: Source apportionment of urban ambient PM2.5 in two successive measurement campaigns in Helsinki, Finland, Atmos. Environ., 37, 615–623, 2003.
Virkkula, A., Aurela, M., Hillamo, R., Makela, T., Pakkanen, T., Kerminen, V. M., Maenhaut, W., Francois, F., and Cafmeyer, J.: Chemical composition of atmospheric aerosol in the European subarctic: Contribution of the Kola Peninsula smelter areas, cen-tral Europe, and the Arctic Ocean, J. Geophys. Res., 104, 23 681– 23 696, 1999.
Watson, J. G., Chow, J. C., and Houck, J. E.: PM2.5chemical source profiles for vehicle exhaust, vegetative burning, geological mate-rial, and coal burning in Northwestern Colorado during 1995, Chemosphere, 43, 1141–1151, 2001.
WHO: World health report, Reducing risks, promoting healthy life, World Health Organization, Geneva, 2002.
WHO: Health aspects of air pollution with particulate matter, ozone and nitrogen dioxide, World Health Organization, Bonn, 2003. Winklmayr, W., Reischl, G. P., Lindner, A. O., and Berner, A.: A
new electromobility spectrometer for the measurement of aerosol size distributions in the size range from 1 to 1000 nm, J. Aerosol Sci., 22, 289–296, 1991.
Yli-Tuomi, T., Hopke, P. K., Paatero, P., Basunia, M. S., Lands-berger, S., Viisanen, Y., and Paatero, J.: Atmospheric aerosol over Finnish Arctic: source analysis by the multilinear engine and the potential source contribution function, Atmos. Environ., 37, 4381–4392, 2003.