Bursting bubbles and water-to-air-transfer:
Interplay between underlying physics and microbial
contamination
byStephane Poulain
Submitted to the Department of Civil and Environmental Engineering in partial fulfillment of the requirements for the degree of
Master of Science
at the
MASSACHUSETTS INSTITUTE OF TECHNOLOGY September 2019
@
Massachusetts Institute of Technology 2019. All rights reserved.Author... ...
Signatureredacted
Department of Civil and Environmental Engineering August 16, 2019
Certifiedby...
Signature
redacted,
Lydia Bourouiba Associate Professor Thesis Supervisor
Signature redacted
A ccepted by ... ...
MASSACHUSETTSINSTITUTE Colette L. Heald
OF TECHNOLOGY rofessor of Civil and Environmental Engineering
Bursting bubbles and water-to-air-transfer: Interplay
between underlying physics and microbial contamination
by
Stephane Poulain
Submitted to the Department of Civil and Environmental Engineering on August 16, 2019, in partial fulfillment of the
requirements for the degree of Master of Science
Abstract
Surface bubbles are very efficient at transporting microorganisms and chemicals from water bodies to the atmosphere: upon burst, they release a multitude of droplets known to shape climate and to participate to airborne disease transmission. In this thesis, we combined controlled laboratory experiments with theoretical modelling to study the environmental and in-situ factors that control the droplet population emitted by large surface bubbles. First, we showed that a global Marangoni flow on bubbles cap due to temperature differences, evaporation, and presence of chemicals such as in saltwater can significantly alters the thinning and lifetime of bubbles. This Marangoni dynamics shapes the drainage and thickness evolution of bubbles, until they eventually rupture by nucleation of a hole in their cap. Second, we then proposed a physical picture that explains how and why micrometer-thick bubbles puncture naturally: we showed how local perturbations due to minute contaminants or intrusions can lead to hole nucleation. These findings explain the evolution of the cap thickness and the lifetime of bubbles in relatively clean water. We then studied the influence of microorganism contamination. We discovered that bacterial secretions can make bubbles live longer and indirectly enhance their thinning. As a consequence, bubbles in contaminated water emit smaller, faster, and more numerous droplets than in clean water: microorganisms can alter the physics of bubble ageing and burst to enhance their own water-to-air transfer.
Thesis Supervisor: Lydia Bourouiba Title: Associate Professor
Acknowledgments
I gratefully acknowledge support from the MIT-Lincoln Laboratory, the
USDA-NIFA, the NSF, the MIT Ferry and Edgerton Funds, the MIT MISTI-France
pro-gram, the MIT Presidential Fellowship, and the Agence Nationale de la Recherche and the Fondation AMU.
I am thankful to W. Lawrence, Y. Joung, B. Phillips, J. Buongiorno, N.
Van-denberghe, M. T. Brandl and H. Lhuissier for valuable exchanges, to B. Cameron, T. Pleasant and J. Su for assistance in early data collection, to the MIT Edgerton Center and M. Belanger for help with experimental setups, and to E. Villermaux for his valuable contributions on part of this study.
I would like to thank all the current and prior students and postdocs of the Fluid
Dynamics of Disease Transmission Laboratory. This thesis would not have been successful without their help and the positive atmosphere of our group.
Finally, I am particularly grateful to Lydia for having introduced me to this fascinating area of research and for her valuable and continuous support. Her com-mitment to the professional growth and personal development of her students is truly remarkable and made a strong impact on me.
Contents
1 Introduction 13
1.1 Families of bubbles and their droplets . . . . 14
1.2 O utline . . . . 16
2 Bubble lifetime, cap thickness, and generalized drainage model 19 2.1 Lifetime. water. and environment . . . . 19
2.2 Observations: effects of temperature on ageing . . . . 24
2.2.1 Bubble lifetime measurements . . . . 25
2.2.2 Temperature and lifetime . . . . 27
2.2.3. Bubble thickness . . . . 28
2.2.4 Air saturation and hot bubbles . . . . 33
2.3 Physical picture and generalized model of drainage . . . . 35
2.3.1 Curvature-driven drainage . . . . 35
2.3.2 Effect of Marangoni flows on ageing: a generalized drainage m odel . . . . 37
2.3.3 Validity of the generalized drainage model . . . . 40
2.4 Analog experiments . . . . 41
3.1 Death: ultimate film rupture . . . . 47
3.1.1 Extrinsic perturbations . . . . 51 3.1.2 Localized intrinsic perturbations: particles and microbubbles . 51 3.1.3 Localized Marangoni-driven violent death . . . . 54
3.2 Criteria for puncture . . . . 59 3.2.1 Physical picture . . . . 59 3.2.2 Transverse contamination: tiiescale competition in cap versus
fo ot . . . . 60 3.2.3 Marangoni-induced condition of film rupture . . . . 63
3.2.4 Mixing on the cap . . . . 65 3.2.5 Robustness of burst physical picture and thickness at burst 66
4 Bacterial contamination 71
List of Figures
1-1 (a. b) Water bubbles in ambient water temperature and bursting at different lifetimes. (c) Example of experimental measurement of the Taylor-Culick speed. (d) Observation of Marginal regeneration plumes. 15
2-1 (a) Schematic of the main experimental setup used to produce bubbles and measure their lifetime and thickness. (b) Plot of bubble cap radius showing the low variability with water temperature. . . . . 22
2-2 (a-g) Examples of lifetime distributions and probability distribution functions. (h-i) Unimodal and statistically stationary normalized prob-ability distribution functions from experiments at different water tem-perature and (i) with different waters. . . . . 26
2-3 (a) Measured mean lifetimes (tb) of bubbles as function of water tem-perature. (b) Tabulated evolution of water density. surface tension, and viscosity , with T ,. . . . . 28
2-4 (a) Bubble cap thickness at room temperature and ambient humid-ity in deionized water. tap water, and water from the Massachusetts
Charles River. (b) Cap thickness in various fluids at room temperature and ambient humidity. probing the effects of viscosity and volatility.. 30
2-5 Bubble cap thickness measurements for different water temperatures
in ambient air conditions. . . . . 31
2-6 Comparison of temporal thickness evolution of bubbles in saturated
atmosphere and unsaturated ambient for water temperatures from 15 to 77 °C . . . . 32
2-7 Comparison of patterns observed on bubbles in water at room tem-perature and on bubbles in hot water or in a more volatile liquid (isopropanol). . . . . 34
2-8 Sketch representing the physical picture of temperature-induced Marangoni
flows on surfaces bubbles. . . . . 35
2-9 Inferred magnitude of the influence of the Marangoni component of the bubble cap drainage flow. . . . . 38
2-10 (a) Inferred values of the thinning at the bubble cap foot using exper-imental measurements and the proposed model. (b) Best-fit exponent for the thickness power-law evolution with time as function of the water tem perature. . . . . 41
2-11 Observation of patterns on a bubble made in 2% isopropanol solution. 42
2-12 Comparison of thickness evolution between bubbles in fresh water and bubbles in salt water. . . . . 43
2-13 Patterns observed on bubble caps made in saltwater. . . . . 44
3-1 Observation of mist and droplet impact on bubbles. . . . . 48
3-2 Observation of nicrobubbles on larger surface bubble caps. sometimes
inducing cap rupture . . . . . . . 49
3-4 Microbubbles produced by electrosis are observed on the cap of a larger bubble, and have a strong lifetime on bubble lifetime statistics. . . . . 52 3-5 Burst of a water bubble in cold water as soon as it emerges from the
surface. . . . . 54
3-6 Observation of the effect of (a. b) a needle. (c) a hot stick. and (d)
isopropanol vapor on a bubble cap. . . . . 55 3-7 Natural two-stage burst at the foot of a thick bubble in ambient
tei-p erature. . . . . 55
3-8 Comparison of the measured thickness evolution for natural rupture of
the bubble cap and punctures triggered by a fast stainless steel needle
at room temperature for various water temperatures. . . . . 56
3-9 Observation of bubble rupture at the foot of the cap from a contami-nant that came from the top of the cap. . . . . 58 3-10 Schematic of shear-enhanced mixing of contaminant from surface
de-position to film depth at the bubble foot. . . . . 60
3-11 Observation and quantification of mixing on a bubble cap. . . . . 64
4-1 Bubbles bursting after (a) 4 s and (b) 55 s at the surface of water with 0.61 and 0.21 ms between frames, respectively. The burst of the older bubble produces many more and smaller droplets. Scale bars are 1 mm. 72 4-2 50s-old bubble observed using monochroinatic light (sodium lamp. 589
nm) at the surface of water contaminated with E. coli . . . . 72 4-3 Thickness evolution and lifetime probability distributions of bubbles
in water contaminated with E. coli. . . . . 74 4-4 Thickness evolutions of bubbles in SDS andC1 4 TAB solutions:
Chapter 1
Introduction
Air bubbles are ubiquitous at water surfaces
[12,
83] of pools, hot tubs, recreationalfacilities [1, 3, 27], toilets [6, 38, 74], and wastewater plants [4]. They involve slosh-ing, impacts, and plunging jets
[40],
and are also the outcome of natural processes such as breaking waves and rain-drop impacts [11, 40], making them the main source of sea spray aerosols. Surface bubbles eventually burst and fragment into droplets which contain chemicals and pathogens that have important consequences on climate [45, 22, 79, 62] and air contamination, indoor and outdoor. In particular, bubbles are a major public health concern: the droplets they generate in contaminated water carry infectious payloads [35] that can remain suspended in the air and cause airborne disease transmission [10]. A direct link between health hazards and bursting bub-bles was first reported for the transport of aerosols containing neurotoxins associated with algal blooms [86, 87, 17, 29]. Inhalation of droplets from bubbles containing bacteria is also a recognized route of infectious disease transmission [85], including for heavy burden pathogens such as Clostridium difficile16,
43], Legionella [60] and nontuberculous Mycobacteria [54, 28]. Droplets from bubbles also contribute to thelarge scale dispersal of marine viruses [5, 641. Yet, despite their significance for cli-mate, ecology, and public health, the interplay between bubbles and microorganisms remains largely unknown. Understanding the fundamental physics governing this important source of contaminated droplets starts by understanding the formation, ageing, and death of bubbles at the air-water interface.
1.1
Families of bubbles and their droplets
At the end of its travel through a water bulk, a bubble reaches the air-water interface forming a thin liquid film, a bubble cap, which encapsulates the air cavity. Competing gravitational and interfacial forces select the bubble equilibrium shape
172,
59]. Thecapillary length fc = /-/pg, on the order of the millimeter for air-water interfaces, is the length scale at which these forces balance; with - the water surface tension,
p the water density, and g the gravitational acceleration. For small Bond number
Bo = (R/tc)2 , with R the bubble cap radius (Figure 1-la), bubbles remain mostly
submerged and spherical, while buoyancy drives larger bubbles to extend further into the air against surface tension.
All bubbles eventually burst. Their cap radius R, which measures their cap
shape and extension above the water surface, selects the mechanisms of their ageing, burst, and the outcome of such burst. Upon puncture, the cavity of a small bubble collapses and produces an upward water jet which may fragment into so-called jet drops [67]. Typically, less than a dozen droplets of comparable size are produced. Larger bubbles do not produce jet drops, instead their fragmentation occurs during the rupture of the cap film [41]. Figure 1-1(a, b) illustrates how, upon the nucleation of a hole in the cap, water accumulates in the rim surrounding the hole as it expands. Due to the important extension of the cap above the water surface, the rim grows
A (a) tb~l4 1A b) tbl=8.6s77r C) 2.5 *t=4s 2 -V = 4.84 m s 0 tb = 18.6 s S1.5 -V = 8.36 m s-1 1 0.5 + 0 ---0 0.1 0.2 0.3 t (ms)
Figure 1-1: (a, b) Water bubbles of cap radius R 5.6 mm in ambient water tem-perature and bursting at different lifetimes tb: (a) tb = 1.4 s, and (b) tb = 18.6 s with 0.42 and 0.36 ms between frames, respectively. Scale bars are 1 mm. The thickness h of bubbles at burst is measured using the speed V of opening of the hole of radius r estimated to be the Taylor-Culick speed V = x2a/ph as shown in (c), leading to h = 6.2 and 2.1 pm for the bubble shown in (a) and (b), respectively. (d) Marginal
regeneration plumes separated by a wavelength A are revealed by iso-thickness lines
and destabilizes into ligaments, then drops. A single bursting surface bubble can generate hundreds of such film drops. While bubbles responsible for film drops are suspected to be less numerous than those responsible for jet drops at the surface of oceans [23], where 10" bubbles are estimated to burst every second [47], most sea surface droplets are nevertheless thought to originate from film drops [45, 22, 84].
For relatively clean water interfaces, and for bubbles for which gravitational drainage can be neglected (an assumption valid for R ;< 5f), the number N and mean diameter (d) of film drops are estimated to be controlled by the bubble cap radius R and film thickness at burst hb as N ~ (R/£c)2
(R/hb)7/8 and (d) ~ R3/sh
[46]. These results were validated for isolated bubbles in tap water and ambient air. Figure 1-1(a, b) compares the burst of bubbles of similar size bursting at differ-ent thicknesses hb, clearly showing different droplet numbers and sizes. Despite this understanding, the fundamental physics and the role of the myriad of entangled fac-tors (e.g., water contamination, air temperature and humidity) governing the ageing, lifetime, cap thickness, and the mechanisms triggering final rupture remain largely speculative.
1.2
Outline
In this thesis, we focus on the physical mechanisms selecting the properties of the droplets emitted by large surface bubbles, in particular their sizes, speeds, and num-ber. In Chapter 2, we derive and validate experimentally a model of bubble cap drainage, setting the bubble cap thickness evolution and lifetime distribution, that for the first time accounts for the air-water interactions and composition of the bulk water. In Chapter 3, we propose a mechanism for the origin of the burst of bub-bles, which eventually sets their thickness. This physical picture is supported by a
wide range of experimental observations and is consistent with theoretical consider-ations. Having focused on clean water in Chapters 2 and 3 in order to characterize a simplified yet still rich system, we show in Chapter 4 how bacterial contamination affects both the thickness evolution and lifetime distribution of bubbles, and discuss the consequences on microorganism transport through droplets. Chapters 2 and 3 are adapted from Poulain, S., Villermaux, E. and Bourouiba, L., 2018. Ageing and Burst of Surface Bubbles. Journal of Fluid Mechanics, 851, pp.636-671 [58] and §4 is adapted from Poulain, S. and Bourouiba, L., 2018. Biosurfactants Change the Thin-ning of Contaminated Bubbles at Bacteria-Laden Water Interfaces. Physical Review Letters, 121(20), p.204502 [57]. Chapters 1 and 5 are adapted from both articles.
-Chapter 2
Bubble lifetime, cap thickness, and
generalized drainage model
2.1
Lifetime, water, and environment
Figure 1-1(a, b) shows that understanding droplets produced by a bubble starts by understanding its ageing and death. Many factors influence the life of bubbles, including the water temperature, air humidity, and the water composition in chem-icals, particulate matter, or microorganisms. The basic role of each one of these in isolation, let alone their coupled role, on bubble life and production of droplets remain poorly understood. Therefore, it is important to disentangle the complex problem of bubble life and death in a range of environments one bubble at a time with controlled experiments. [88] reported that bubbles generated by capillary tips in a controlled laboratory environment have similar lifetimes as bubbles observed after wave-breaking events, providing support for this approach.
Cl
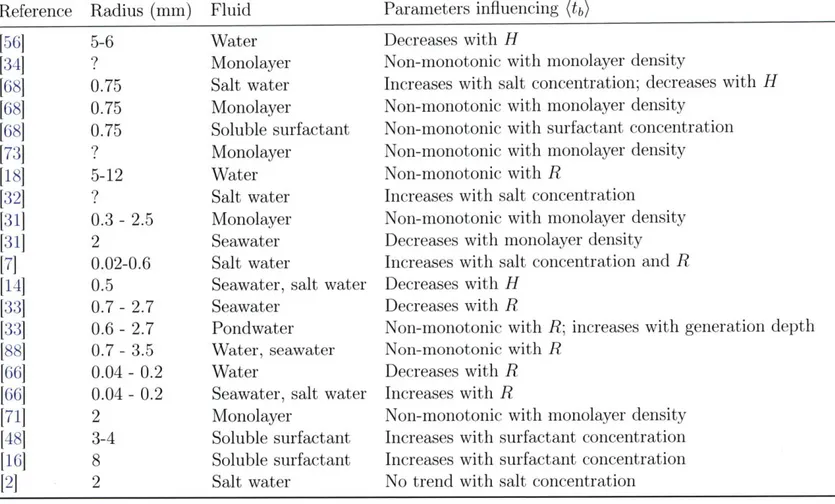
Reference Radius (mm) Fluid Parameters influencing (t)
[56] [34] [68] [68] [68] [73] [18] [32] [31] [31] [7] [14] [33] [331 [88] [66] [66] [71] [48] [16] [2] 5-6 0.75 0.75 0.75 5-12 0.3- 2.5 2 0.02-0.6 0.5 0.7- 2.7 0.6- 2.7 0.7- 3.5 0.04- 0.2 0.04- 0.2 2 3-4 8 2
Table 2.1: List of references reporting surface bubble mean lifetimes. We focus on studies with purified or tap water (water), water with a monolayer of surfactant (monolayer), solutions of water and soluble surfactants (soluble surfactant), and water with inorganic salts (salt water). H is the air relative humidity and R the bubble radius. Most early references on the influence of the atmosphere on bubbles have been reviewed by
Water Monolayer Salt water Monolayer Soluble surfactant Monolayer Water Salt water Monolayer Seawater Salt water
Seawater, salt water Seawater
Pondwater Water, seawater Water
Seawater, salt water Monolayer
Soluble surfactant Soluble surfactant Salt water
Decreases with H
Non-monotonic with monolayer density
Increases with salt concentration; decreases with H Non-monotonic with monolayer density
Non-monotonic with surfactant concentration Non-monotonic with monolayer density Non-monotonic with R
Increases with salt concentration
Non-monotonic with monolayer density Decreases with monolayer density Increases with salt concentration and R Decreases with H
Decreases with R
Non-monotonic with R; increases with generation depth Non-monotonic with R
Decreases with R Increases with R
Non-monotonic with monolayer density Increases with surfactant concentration Increases with surfactant concentration No trend with salt concentration
Table 2.1 summarizes prior works on mean lifetime of isolated bubbles. The role of soluble and insoluble surfactants were examined but remains unclear. A monolayer of surfactant was reported to have a nonmonotonic effect, increasing bubble lifetime at low monolayer density and decreasing it above a critical density [34, 68, 73, 31, 71]. Soluble surfactants were reported to increase the bubble lifetime [68, 48, 16]. Some studies reported that salt increases lifetime [68, 32, 7], while others reported no clear influence of salt [2]. [56] described a seemingly decreasing bubble lifetime with increasing humidity, however [14] later reported no influence of humidity on freshwater bubbles. In sum, no clear physical picture emerges from table 2.1. Note also that experimental protocols were not standardized, making comparisons difficult, and that datasets used in these studies are usually small as discussed further in §2.2.1. Some authors have considered the role of the bubble size, however, contradictory results prevail [18, 7, 33, 88, 66]. In particular,
[65]
showed that larger bubbles burst thicker than smaller ones. The dependence of the cap thickness at burst on its radius can be expressed as:hb = , (2.1)
where hb = h(tb) is the thickness at burst and tb is the bursting time of the bubble, which is broadly distributed as we shall see thereafter. This relationship, first es-tablished experimentally by [65], was formalized by [46] who introduced the fitting length 1 and found it to be much larger but proportional to the capillary length: L = f£c-1/2. There, e = O(10-4) was conjectured to be a constant rupture efficiency
factor without clear physical interpretation. In fact, nothing is known yet about the puncture mechanism per se: why do bubble caps spontaneously nucleate a hole even when they are thick? and why would their mean thickness at burst follow (2.1)?
(a) Enclosure H>90 T 23°C-~ 3 Surface bubble H 20 - 607 S b Air pump T --••...-....3 ••--n-40 cm
Hot or cold water recirculating pump
(b) 7 6 5 4 0 20 40 60 TW(OC)
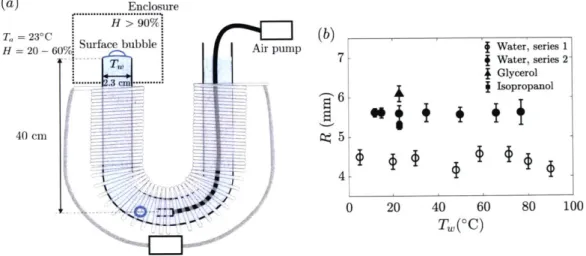
Figure 2-1: (a) Schematic of the main experimental setup used to produce bubbles and measure their lifetime and thickness. This setup was used with a range of imaging modalities discussed herein. Another reduced experimental setup with a smaller tube length of 15 cm instead of 40 cm was also used. This second setup had a thermal control via full tube (Rtube = 2.3 - 5 cm) immersion in a heated water
bath. An enclosure was used in some experiments to control the ambient moisture surrounding the bubble. (b) Bubble cap radius R with error bars representing one standard deviation, showing the controlled radius of bubbles with water temperature for two examples: R = 4.4 ± 0.2mm for series 1 and R = 5.6 ± 0.2 mm for series 2. Solutions exploring the role of viscosity and surface tension were also used with similar radii, here shown for water with 20%- and 40%-weight glycerol, and 1%-volume isopropanol. §Water, series 1 Water, series 2 Glycerol Isopropanol 80 100
One is deterministic and consists in a thinning of the bubble cap film with time down to a small enough thickness over which thermal fluctuations or van der Waals forces
[37] could suffice to rupture the film [82]. The other relies on the observation that
bubbles can burst even when they are micrometer-thick which rules out the role of van der Waals forces. [46] proposed a model associating weak film regions on the bubble cap with the center of marginal regeneration plumes raising from the bubble foot (figure 1-1d) [49]. The authors introduced a frequency of rise of the marginal regeneration plumes spaced by a wavelength A ~ R(h/R)3/2 . They coupled these weak regions with a constant rupture efficiency c, leading to a normalized lifetime probability density function (PDF) of bubble lifetime tb given by:
(tb
4 xl(7/4)4/3 to1/3 /t 4/3PDF - x Fl/4) - exp -(F(7/4)
)
(2.2)(tb) 3 tb) ( tb)
with mean lifetime (tb):
(tb) = F(7/4)(4) (1/ tV with t = , (2.3)
3e fc
o-the viscous-capillary timescale and F o-the gamma function with F(7/4) 0.92.
While (2.2) is in agreement with the experimental lifetime distributions obtained at ambient water and air conditions by [88], the parameter c remains ad-hoc and the physical mechanisms and dependencies governing it are unknown. Moreover, the role of the cap deterministic thinning is unclear and open questions remain:
* Is there a critical thickness - above the nanometer scale - below which bubbles are not stable regardless of marginal regeneration?
time?
" Are the mechanisms taking place in the final stages of film rupture affected by the history of the bubble thinning?
" Is the bubble cap ageing dynamics inherently and intrinsically responsible for the final rupture? Or are external effects, such as contaminants or impacts from external objects, responsible for the death of bubbles regardless of their age and thickness?
In this thesis, we address these fundamental questions. We use several comple-mentary imaging modalities, including Schlieren, interferometry, and high-speed in addition to developing algorithms of generation, detection, and control of bubbles to eliminate bubble-bubble interactions and ensure appropriate ensemble averaging. We start by examining the role of water temperature on lifetimes and thickness evo-lution in §2.2. Water temperature modifies surface tension and viscosity, but also the coupling of the bubble with its surrounding air, making it a multifaceted and insightful inquiry tool. We formalize the emerging physical picture in §2.3 and test its robustness in analog experiments discussed with salt water in §2.4. We investigate in §3.1-3.2 the mechanisms, inherently coupled with the thinning and ageing, which ultimately rupture the film.
2.2
Observations: effects of temperature on ageing
We examine the physics of drainage and burst one bubble at a time and construct the statistics of the bubble populations produced. To elucidate how the ageing and death of bubbles relate to air and water properties, we produce bubbles in a controlled setup with a range of liquid and air conditions. A capillary tip connected to an air pump
generates bubbles in a PTFE or stainless steel tube (figure 2-1a). A coiled tubing connected to a water heating or cooling recirculating pump is wrapped around the bubble tube and permits a non-intrusive control of the water temperature T" in the tube from 5 to 90 °C.' We ensured the control of bubble size for all our experiments, maintaining cap radii from 4 to 6 mm (figure 2-1b). This range was selected as it corresponds to bubbles producing film drops, and because it is large enough for clear visualization of features of the cap while small enough to neglect gravitational drainage
[46].
All experiments were performed at room temperature T = 23 °C. Theambient relative humidity H varied from 20 to 60%, and we tested the influence of a saturated atmosphere (H > 90%). In order to minimize bubble-bubble interactions, the air pump is automatically stopped once a bubble is detected at the surface, and is turned on again only after its burst.
2.2.1
Bubble lifetime measurements
Bubbles rise up the tube and are stabilized at the center of a meniscus, where a camera continuously films the water surface, detects the presence of a bubble, and records its lifetime to produce lifetime statistical distributions. The time t = 0
corresponds to the time at which the bubble is detected at the surface; it is measured with an error on the order of 0.05 - 0.1 s.
Extreme care in our experimental setup and protocol allowed us to shed light on the metrics involved in bubble lifetime statistics. Indeed, variability in lifetime is high: it has been reported that reproducibility in measurements of lifetime could only be attained after thorough protocols to prevent water contamination [32, 9, 7, 33].
However, none of the prior studies summarized in table 2.1 reported the temporal evolution of bubble lifetimes, and only one [88] gave distributions while others only
(a) (b) s (c)(d) 20 (e) (f)(d) 4 50. 10 30.
2*-A20
0 200 400 600 800 00 X0 .!0
100 200 300 400 500 0 100 200 300 400 0 100 200 300Bubblenumber Bubble number Bubble number Bubblenumber
(e) 10(f) (9).. 10 30 20,'* 50~ ::.* 10' 0030 No0 Eq. (2-1) 0 200 40(0 0 100 200 300 400 0 2 4
Bubble number Bubble number t./tb
0 2 4 6 tb/(tb) (i)10 W Deionized. (t' = 5.7 s a Deionized. (t) = 9.8 s A Filtered.(t4) =5.7 s .Filtered, - Y 2.1s -Eq. (2.1) 10 0 2 4 6 tb/(th)
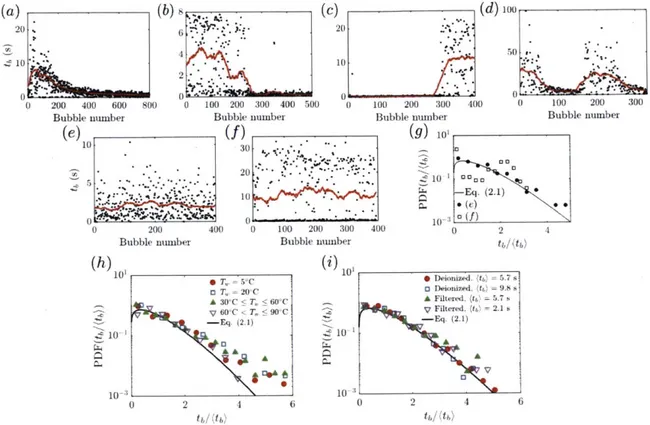
Figure 2-2: (a-f) Experiments are performed in the same experimental setup with deionized water and illustrate the inherent variability in bubble lifetime t
time series with a mean that can: (a) slowly decrease, (b) suddenly drop or (c) increase, and (d) evolve nonmonotonically, respectively. Solid lines are moving av-erages. (e-f) Statistically stationary time series of lifetime and (g) their normalized PDF. (e) is in agreement with (2.2) while (f) is bimodal with most bubbles ei-ther dying very quickly or living much longer than the mean. Datasets need to ensure statistical stationarity and unimodality to enable the study of mean lifetimes. (h-i) Unimodal and statistically stationary normalized PDF from: (h) experiments at different water temperature T from which we extract the means shown in figure 2-3(a); and (i) at ambient temperature with different water (filtered and deionized). Even though water temperature and composition, experimental setups, and mean lifetimes varied, these distributions collapse on a master curve in agreement with (2.2), showing the universality of the underlying physical mechanism across condi-tions and setups.
(h) 410' 10-' 10-3 o T,= 20'C A30°C 7T,5 60°C 60°C < T. <5 90'C -Eq. (2.1) #-A 8COA I
reported mean values. We show in figure 2-2(a - d) that it is important to carefully
consider temporal trends of lifetime to ensure a large enough ensemble of bubbles for convergence of statistics so that the underlying physics governing the distribution of lifetime is steady, or only slowly varies within the temporal window of averaging; and to ensure that the limit of dilute interface (low surface contamination) remains valid. Indeed, we observed that contamination is typically associated with bimodal distributions, with most bubbles bursting very quickly and others living much longer (figure 2-2f).
Despite the apparent variability of lifetimes, figure 2-2(h - i) shows that nor-malizing the steady lifetime PDFs can collapse data from a range of conditions and experimental setups. This collapse on a master curve, which is in good agreement with (2.2), shows the robustness of the underlying physics governing bubble lifetimes. We use the collapse of lifetime PDFs and steadiness as criteria to discriminate be-tween the dilute and heavy contamination limits. With this in mind, figure 2-2(e) shows a typical steady lifetime representative of the regimes on which statistical averaging used to extract a mean lifetime is actually valid.
2.2.2
Temperature and lifetime
Figure 2-3(a) shows the mean lifetime t) computed from stationary lifetime time series of bubbles generated at water temperature T in unsaturated air as illustrated in figure 2-2(e, h). The experimental setup was thoroughly rinsed between each series. (tb) increases with T, up to ~ 65 °C, above which it ceases to increase. The ageing of the bubble cap and its puncture jointly control such lifetime. The physical parameters controlling the ageing of water bubbles are viscosity P, surface tension a, and water density p. When temperature varies, variations of a and p are negligible
(a) A (b) 2
'1
3- 1.5. -- I --2 *, - (tb)/(tb)20 10.5 0 0 0 20 40 60 80 100 0 20 40 60 80 100 T,(0C) TW(°C)Figure 2-3: (a) Measured mean lifetimes (tb) of bubbles with each point corre-sponding to one series of experiment (typically 400 bubbles) with converged statis-tics (figure 2-2h). For each series, the standard deviation of the mean computed with bootstrap resampling is smaller than 10% of the mean value. (b) Tabulated evolution of water density p, surface tension o, and viscosity p with T, normalized
by their value at room temperature. Theoretical prediction of mean bubble lifetime
(tb) and cap thickness h from (2.3) and (2.4) are also represented: both quantities are expected to decrease with T.
compared to the evolution of p (figure 2-3b) so that (2.3) with a constant burst efficiency c cannot capture even the trend of (tb) in figure 2-3(a). We confirm in figure 2-1(b) that the radius of bubbles we generated in our experimental setups are stable with temperature, hence not influencing (tb). Other possibilities could explain a non-monotonic mean lifetime with temperature: 1) the dependence of (2.3) on viscosity is not robust to temperature-induced changes in fluid properties; or 2) the overall thickness drainage law requires fundamental revisiting. Next, we measure the bubble cap thickness evolution to better quantify the effect of temperature.
2.2.3
Bubble thickness
We systematically measured the evolution of the bubble cap thickness h with time and the influence of water temperature T, air relative humidity H, and water
com-P/Pm
-oiW
position using the Taylor-Culick speed: once the cap film punctures, the receding speed V of the hole is related to its thickness as h = 2o-/pV2 [69, 20]. To this end, natural bursting events of bubbles with cap radius R = 5.6 mm were recorded. The rim can be tracked and its radius r computed by finding the best-fit of the shape assumed by an opening receding with isotropic speed on the geometry defined by the bubble cap (figure 1-1c). While lifetime measurements can vary, as discussed in §2.2.1, robustness in measured thickness time-evolution is clear. In fact, changes in type of water, from the river of a metropolis such as Boston, to deionized and to tap water of Marseille [46] do not appear to affect the thickness evolution. This is illustrated in figure 2-4(a). At ambient air and water temperature, the bubble cap thickness time-evolution remains in agreement with:
h(t) c 2/3
(
)7/3
(2.4)This expression (2.4) was established for bubbles of large enough size to mostly produce film drops but small enough to neglect gravitational effects (R
<
5fc), andvalidated for ambient air and water conditions at 20°C [46].
As seen in §2.2.2 and figure 2-3(b), viscosity is the water property most affected by temperature. To verify that the basic dependency of (2.4) on viscosity is robust, we varied fluid viscosity at almost fixed surface tension and density using glycerol. Fig-ure 2-4(b) shows that, while the time dependence (h(t) ~ t- 2/3) of the cap thickness
evolution is independent of viscosity, the magnitude of the cap thickness increases with viscosity, as expected.
As temperature increases, water viscosity decreases. Assuming that (2.4) holds, it would predict that at a given age, hotter bubbles are thinner. Thinner bubbles would be more fragile to perturbations, hence, would live shorter. Yet, this rationale
(a)20 (b) 20
15 15
10 .0.010 ° •
3o* 3 o Wate
o Deionized %""92 Gyeo L0
2A Charles River A 2 4 0% Glycerol
. Tap ,A 4. . 1% Isopropanol
1 1
10 2, 3 00 2 0 2
t(s) t (s)
Figure 2-4: (a) Bubble cap thickness at room temperature T.= 23°C and ambient humidity in deionized water, tap water, and water from the Massachusetts Charles River. Despite changes in water composition and source, all else being equal, the bubble cap thinning temporal evolution is robust. (b) Cap thickness in various fluids at room temperature and ambient humidity, probing the effects of viscosity and volatility. The viscosity of the glycerol solutions are 1.5 and 3times that of pure water, respectively, and bubbles are thicker as predicted by (2.4): the solid lines show power laws inh ~ t-2 /3 in water, based on which the dashed and dotted lines are the expected thickness evolution for 20% and 40% glycerol, respectively. The changes of density and viscosity are negligible for the isopropanol solution, and its surface tension is67 mNm-1.
(a) (b) 10 10, . • 5 15 3 * 3 2 - 0C ** 2 -* 10 500 > 15°OC 1 -•23 °C 1 •50 °C-35 °C a66 °C • 50 °C,_,,_,_, ,_,_,,,,,,,, 77 °C 1 2 3 5 10 20 1 2 3 5 10 20 t (s) t (s)
Figure 2-5: Bubble cap thickness measurements for different water temperatures Tw in ambient air conditions. A nonmonotonic trend in thickness magnitude is observed:
(a) 5°C< T < 65C for which the bubble cap thickness increases with temperature; and (b) 65 °C < Tw < 900 C for which thicknesses fluctuations are important with a
loss of clear trend similar to the mean lifetime measurements in figure 2-3(a) for this
range of temperature. Solid lines are power laws h ~ t-2/3.
is in direct opposition to the mean lifetimes measured in figure 2-3(a). To parse out the mechanism in place, we focus on the temporal evolution of film thickness with
water temperatures in deionized water as shown in figure 2-5. A nonmonotonic trend
in cap thickness magnitude is observed: from T = 5 to 65C, the higher the water temperature, the thicker the cap of a bubble of a given age. Above 650C, scatter in
thickness measurement increases and is reminiscent of scatter in mean lifetime at the
same temperatures. In sum, the nonmonotonic trend in thickness magnitude with temperature revealed in this section is analogous to the nonmonotonic trend in mean lifetime with temperature discussed in §2.2.1; neither of which are rationalized by the thickness evolution (2.4).
T = 15°C 2 3 5 10 2 t (s) 500C '--'-6' a 0 a. 00 00 1 2 3 5 t (s) (b) 0 (e) 10 20 15 10' 5' 3 2 1 15 10 5 3 2 1 230C 6a 2 3 5 10 20 t (s) 660C 1 2 3 5 t (s) (c) 15 104 5 3 2 1 3500 0 S tO~% S °°° 1 2 3 5 t (s) 10 20 (f)1 770C 10 0 2 0 5-I 10 20 1 2 3 5 t (s) 10 20
Figure 2-6: Comparison of temporal thickness evolution of bubbles in saturated atmosphere and unsaturated ambient for different T: (a) 15C, (b) 23°C, (c) 35°C,
(d) 50°C, (e) 66°C, and (f) 77°C. Solid and dashed lines are -2/3 power law at
ambient and saturated humidity, respectively. A robust trend emerges: evaporation is associated with cap film thickening.
o ambient H 0 saturated '-*3 (a) 10 S5 3 2 1 (d) 1 10 -3 2 1 0 *~0 0 S. ** 0 ~m
-2.2.4
Air saturation and hot bubbles
To further assess the existence of additional factors controlling bubble thickness and lifetime, we compare cap thicknesses in ambient and saturated environments. Figure 2-6 shows that bubbles in ambient atmosphere (20% < H < 60%) are thicker than bubbles in saturated air (H > 90%), a result clear at room temperature and robust for other temperatures studied herein. This finding is counter-intuitive as evaporation is expected to continuously remove water from the cap, hence thinning its film. However, evaporation rates are estimated to be negligible on the timescale of the bubble lifetimes on the order of 1 to 20 seconds observed herein. Instead, we propose in next section a thermal-induced flow triggered by Marangoni stresses on the bubble cap to rationalize our observations.
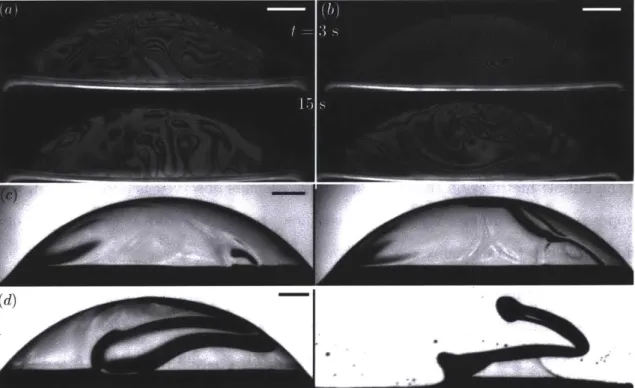
At water temperature higher than 65°C, both lifetime (figure 2-3a) and cap thick-ness measurements (figure 2-5b) are particularly scattered. The scatter in thickthick-ness measurements reflects inhomogeneities in cap thickness, which is seen clearly in the distinct patterns of marginal regeneration revealed by interferometry when compar-ing figures 2-7(a) and 2-7(b). This is associated with convection, and is particu-larly visible above 65°C as water saturation vapor pressure increases with associ-ated increase in air buoyancy and rise of thermals, notably resulting in mist that can be clearly seen emanating from the bulk water (figure 3-1(a), also discussed in
§3.1.1 thereafter). At high temperature, we also observe localized upward flow with
thick patches between the bubble foot and apex. Figure 2-7(c) shows a bubble at T, = 65°C with such a black region moving up to the apex from the foot. Similar
patterns are systematically observed on bubbles generated in highly volatile pure isopropanol: as soon as the bubble emerges, black regions appear, suggesting that the high evaporation rate of isopropanol drives such patterns. The burst of the
Figure 2-7: (a) At T = 23°C classical marginal regeneration is observed with inter-ferometry, while (b) at T, = 77°C the bubble cap is inhomogeneous in thickness and
without clearly defined marginal regeneration plumes. (c) Above a water tempera-ture of 50°C, thick regions on the cap can emerge spontaneously, here seen for an 8s-old bubble at T = 66°C. The adjacent frame, 23 ms later, shows that the bubble puncture is initiated in the thin region below the thick dark region. (d) Similar dark thick regions are systematically seen on bubbles made in volatile compounds such as pure isopropanol. The second frame, 0.89 ms later, shows the burst of the cap and reveals its extreme inhomogeneity. Scale bars are 1 mm.
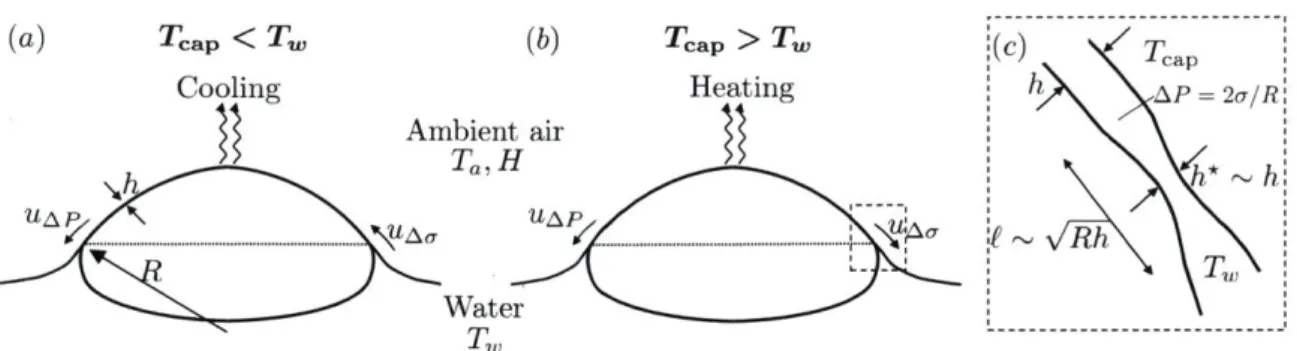
(a) Tcap < Tw (b) Tcap>Tw ( )aKC)
Tcap
Cooling Heating h AP= 2o/
Ambient air Ta,H h* h UAUA£ R -T TW Water T W ---~ ---~~ ~
----Figure 2-8: Surface bubbles with (a) water temperature T, higher than the ambient air temperature Ta (Tw > Ta) and (b) Tw < Ta. The pressure difference between
the cap and the bulk water leads to a drainage velocity UAp. The temperature of
the bubble capTap has an intermediate value between T and T,. Temperature differences induced by thermal equilibrium between the air and the bubble cap or
evaporative cooling induce an additional Marangoni flow uA, which can either reduce
(a) or enhance (b) the overall bubble cap drainage. (c) Schematic of the bubble foot connecting the bulk water and the bubble cap.
isopropanol bubble seen in figure 2-7(d) confirms that the dark patches are regions
of thick film. A small amount (1% volume fraction) of isopropanol in water also
increases scatter in thickness measurements (figure 2-4b), reflecting the cap inho-mogeneity induced by volatility. The above observations suggest that evaporation
introduces important flow patterns that alter the thinning, thickness, and lifetime of bubbles. We discuss next the physical picture that emerges.
2.3
Physical picture and generalized model of drainage
2.3.1
Curvature-driven drainage
We briefly review herein the derivation of the thickness evolution presented by [461. Once at the surface, a bubble continuously drains. This drainage is assumed to be controlled by the condition at the bubble foot, where a pinching region of thickness
h* continuously adjusts to a surfactant-induced gradient of surface tension over a length £ connecting the bubble cap to the bulk water (figure 2-8c). Indeed, viscous effects are only expected at the bubble foot: a no-slip boundary condition at the film interfaces is assumed in the rest of the bubble cap. Balance of viscous stresses in the pinching region and capillary pressure AP = 2o/R between the cap and the bulk
leads to: puAp/h*2 ~ -/Re. Assuming h* ~ h and using the geometric argument
f ~ v/5 yield the curvature-driven cap drainage velocity:
UAP ~ h) -- 3 (2.5)
pR
where a minus sign is used when fluid leaves the cap. Mass conservation reads Sh = PhuA, where S is the bubble cap surface area, P the foot perimeter, and
P/S ~ 1/E, with the cap half-perimeter E ~ R2
/c
for R/c < 5. Using (2.5), mass conservation leads to:h 1 E R2_
h- T -with -r ~ ~ (2.6)
h 7' nAP uAPfc
The time dependent (through uAp) flushing time r represents the mean residence time of a fluid particle in the bubble cap. Integration of (2.6) finally yields:
h
~ tc ) 2/3 ()7/3. (2.7)Figure 2-6 shows that the thickness evolution at ambient temperature and without evaporation matches very well the predicted h ~ t- 2/3. This is expected given
that the underlying assumptions of marginal regeneration (2.7) are satisfied in these conditions. Note that h ~ t-2/3 leads to a flushing time r- t, i.e., the older the
bubble, the slower it drains.
At ambient water temperature and in saturated air, when no additional effects are expected, we estimate the constant in (2.5) to be 1/3 from experimental data
(figure 2-6(b)), leading to:
-o (h (3/2
3 p R
which shall be used for the remainder of the paper.
2.3.2
Effect of Marangoni flows on ageing: a generalized drainage
model
At first order, the time dependence of thickness h ~ t-2/3 continues to describe the data well even in the presence of evaporation and temperature gradients (figures
2-5 and 2-6). Clearly, the level of noise of the data does increase as moisture and
temperature vary, but the overall trend at first order remains robust and consistent with the time dependency given by (2.8). However, this is not the case for the magnitude of the cap thickness, which increases with temperature in a manner not captured by (2.8) (see §2.2.3). The emerging physical picture able to reconcile the power law of drainage with an increasing thickness magnitude with temperature or in unsaturated air is the following: temperature-induced Marangoni stresses on the cap contribute to or act against curvature-driven drainage, as illustrated in figure
2-8. When exposed to air at a temperature different than that of the bulk water or
in unsaturated air in which evaporation and its localized cooling effect can occur, temperature gradients are generated on the cap. These gradients induce an additional flow uA, superposed to the cap drainage uAp. This flow can either strengthen the drainage if it points downward towards the bulk (figure 2-8b), or weaken the drainage
(a) (b) A ~ 35 100 200 300 IM U'N'15 S0 op, 1 10 _ Z -20 50 100 E 5
0
---- --- --- -0 - - -*ambient H -1 *saturated • • -5 0 20 40 60 80 100 0 20 40 60 80 I T( 0C) T,Figure 2-9: (a) Comparison of the magnitude of the additional Marangoni flow u, with the background curvature-driven drainage flow unp. Inset: uA, is for ambient
atmosphere and the values of speed taken at h = 5 pm, with uAp ranging from -0.4 to -1.8 mm s-1 and uA, from -0.8 to 1.3 mm s-'. (b) Difference of surface tension induced by a temperature difference (Ao- = u(23 °C) -(T.)) (solid line) or
by difference of NaCl concentration (Ao = u(c) - o-(35 g L-1 )) (dashed line). NaCl
water saturation occurs at approximately 360 g L-1 . Estimations from [76] and [53]
are used.
if it points upward towards the cap apex (figure 2-8a).
We can capture this effect via a generalized model of bubble cap drainage ac-counting for this mechanism. With thickness on the order of 1 to 20 pm, on average, we consider the cap to be relatively well mixed, except in a transition region at the foot of the bubble connected to the fluid bath (see §3.2.4). Over this scale, a fluid parcel heated by the bulk has a lower surface tension with respect to its fluid sur-rounding due to air-cap thermal equilibrium and evaporative cooling (figure 2-9b).
A local thermally-induced Marangoni stress generates a diverging flow if the patch
is warmer than the background or converging if the patch is colder. A diverging Marangoni flow leads to a local thinning of the patch, and a converging one leads to its thickening. This change in thickness is captured by Ah = h - k(Au)h, where
two flows have the same sign, both contributing to drainage of the cap into the bulk (figures 2-9a for T < 23 °C and 2-8b). The reverse is true for Tw > Tcap > Ta. A
positive k(a-) corresponds to local thinning, making the patch locally buoyant [19].
At first order, buoyancy sets the parcel in motion and is only balanced by drag, hence setting the magnitude of uN, similarly to the onset of the classical Rayleigh-Benard instability.
Considering a localized temperature gradient at the bubble foot of height f and
typical width A - R(h/R)3/2
, the width of a marginal regeneration plume [46], the buoyancy force acting on the patch is FB - pgAhfA. Assuming a low Reynolds
number Re = puAA/p, scaling analysis gives a drag force acting on the parcel which
is linear in uA,: FD - pAuA,. Balancing buoyancy and drag force yields:
a , ~k(Aao-) ha/
P
or
na ~ k(Ao)Bo --
,
(2.9)pR
where we have used f~ v0- Rh[46]. Considering uA, and uAp from (2.8), the
equation governing the bubble thickness becomes:
= (k(o)pR 1 /2 1_R-3/2 h5/2
S p3y
or
h= (k(L)Bo -
(h).
(2.10)S 3 y R
This model predicts h ~ t-2/3
similarly to (2.7), consistent with the slopes rep-resented in figures 2-5 and 2-6.
2.3.3
Validity of the generalized drainage model
We report the magnitude of the Marangoni driven drainage uA, needed to ratio-nalize our data in figures 2-5 and 2-6. Figure 2-9(a) shows A,/AP with varying water temperature for both ambient and saturated air. The curvature-driven and Marangoni flow contributions are of the same order of magnitude, both on the order of a few mm s-' (figure 2-9a inset), consistently with the physical picture presented in figure 2-8. These magnitudes lead to Re = 0(0.1 - 10) (figure 2-10a inset), in agreement with the viscous drag posited to derive (2.9).
Figure 2-10(a) shows the dependence of k(Au) = Ah/h on water for both satu-rated and unsatusatu-rated air: the magnitude and signs are consistent with the physical picture portraying the roles of temperature gradient and evaporation in figure 2-8. Indeed, for a Marangoni spreading induced by surfactants that leads to marginal regeneration in soap films [13], direct experimental measurements from [52] show
k ~ 0.2, the same order of magnitude as what we infer in our system, but from a
different origin.
Finally, note that although h ~ t-2 /3 is robust at first order for the range of
temperatures tested herein, we do observe an increase in noise in thickness data measurements. We can quantify the effect of increase in thickness fluctuations, in conditions in which evaporation and temperature gradients are present, with a higher order analysis of best-fit slope a in h ~ t-O. The mean and standard deviation of a are shown in figure 2-10(b). We observe a slight deviation of a from 2/3 in part due to the increase in cap thickness inhomogeneities visible in figures 2-5 and 2-6. In the next section we use an analog experiment free of temperature fluctuations to test further the robustness of the proposed physical picture and generalized drainage model presented herein.
--- J (a)0.1 (b) 1 -ambientH 8 f
8
saturated • H 0.8- -- 2/3 0 - -..- -... . 102 -- T.=10° c.- - ---101 -T.=65° Cf -0.1 100 -10-1. 100 h (pm -0.2 10. . (Im. 0.2 0 20 40 60 80 100 0 20 40 60 80 100 TW(°C) TW(°C)Figure 2-10: (a) k = Ah/h leading to uA,= k(zo-)Bo(o-/p)(h/R) 3/. The value of k
at steady state is (3Bo)-' (dashed line) and varies by less than 10% for the range of temperature and salt concentration studied herein. Inset: Reynolds number based on uA, and taking a representative value for A of 1 mm. (b) Values of a from best fit of h ~ t-c on data shown in figures 2-5 and 2-6.
2.4
Analog experiments
We now turn to analog experiments probing the robustness of the physical picture and model proposed in §2.3.2. To do so, we start by probing bubbles made of a fluid of higher volatility and lower surface tension than water. We expect that the higher the volatility, the higher the gradient of surface tension driving upward fluid motion towards the bubble apex due to surface tension gradients induced by difference of temperature and composition between the bulk and the cap induced by evaporation. Figure 2-11 shows a bubble generated in 2% isopropanol. The typical plumes of marginal regeneration observed on water bubbles are no longer visible, but are re-placed by narrow streams of upward flow. In the series of snapshots of figure 2-11(b), a particle following the flow allow us to estimate an upward velocity of 0.1 m s-1, which is two orders of magnitude higher than the typical velocity of curvature-driven drainage uAp ~ 0(10-3) m S-1 (figure 2-9(a) insert). This strikingly high upward
Figure 2-11: 11s-old bubble in a solution of water and 2% isopropanol volume frac-tion, at room temperature and humidity. (a) A particle initially present in the liquid is advected on the cap. (b) Zoom at the foot with 12.5 ms between frames showing that this particle was quickly advected towards the bubble apex after it encountered a strong localized upward flow. The maximal speed of this particle tracked along its rise is 0.1 m s-1 , two orders of magnitude larger than the speeds in figure 2-9(a).
flow strongly supports the physical picture proposed in 2 N-where a dramatic shift in the drainage dynamics is expected if evaporation-induced surface tension gradients dominate. This example of isopropanol bubbles is an extreme illustration of the role of volatility driving a uA, counter to uAp. Although smaller in magnitude due to smaller volatility, the comparison of UA,/UAp between bubbles in saturated versus unsaturated air (figures 2-6 and 2-9) shows clearly the same trend.
We now consider another analog experiment where we probe further the physical picture discussed in §2.3.2, using bubbles born from salt water. Figure 2-12 compares the temporal thickness evolution of bubbles emerging from salt water (deionized water with sodium chloride at 35 g L-1 ) with fresh water bubbles. The thinning law obtained in a saturated environment for salt water and fresh water are near identical. Yet, significant differences emerge between bubbles in saturated and unsaturated air. In unsaturated air, the cap of salt water bubbles is consistently thicker than that of fresh water bubbles. Moreover, a striking difference emerges beyond an age of about 20 s, after which a peculiar thickness plateau at h ~ 2 pm is reached for salt water in unsaturated air. This plateau is associated with longer lifetimes. Indeed, while most bubbles generated in fresh water were observed to die younger than 20 s,
o Water, saturated 10 V A Saltwater, saturated 10 o Water, ambient H 5' 0 , , Saltwater, ambient H5 2 V 3 1 % A 0.5 ° 1 10 100 0 50 100 150 200 t (s) t (s)
Figure 2-12: Thickness evolution of bubbles in fresh water and in water with
35 g L- NaCl showing that in unsaturated air, bubbles from the salt solution are
systematically thicker than fresh water bubbles, yet follow the same law of thinning up to a certain point (a). Their thickness reaches a plateaus at about 2 pm for t > 20 s, showing that they can live considerably longer. (b) Same data represented in a log-lin scale
salt water bubbles could live far longer immersed in unsaturated air: we report the thickness of bubbles as old as 3 mn in figure 2-12, and the oldest bubble we captured was 6 mn old.
These observations support further the robustness of the physical picture of evaporation-induced Marangoni convection and the modeling developed in §2.3. Here, the driver for surface tension gradient is both evaporative cooling and change in salt concentration due to evaporation. Both effects increase surface tension (figure 2-9b) and lead to a decrease in cap drainage (figure 2-8a). Figure 2-13 shows that the pat-terns of marginal regeneration observed on salt water bubbles in saturated ambient
- i.e., without evaporation - are the same as those observed on regular fresh water bubbles. However, they are significantly disrupted for salt bubbles in unsaturated environments in which evaporation occurs. In addition, the shift in thickness profile and inhomogeneity on the bubble cap are striking for bubbles older than 20 s and falling on the thickness plateau in figure 2-12. Inhomogeneity in the form of two
Figure 2-13: (a) Bubbles in salt water (35 g L- 1) in a saturated atmosphere (left) and at ambient humidity (right) both shown at t = 16 s. In a saturated atmosphere,
marginal regeneration patterns are similar to fresh water bubbles (figures 1-id and 2-7a). At ambient humidity evaporation strongly affect the cap dynamics. (b) Bubble in salt water (35 g L 1) and ambient humidity at t = 40 s on which small particles, assumed to be salt crystals and highlighted with circles, are observed. (c) 3mn-old bubble in higher concentration of salt water (300 g L- 1) and ambient humidity with
0.33 s between frames. The patterns observed are similar to those in (b). Here, one
particle, a salt crystal formed on the cap, is heavy enough to slide down. The insert shows that it is surrounded by a circular meniscus. Scale bars are 1 mm, ambient humidity is H = 30%.
-Am