HAL Id: hal-00329362
https://hal.archives-ouvertes.fr/hal-00329362
Submitted on 28 Feb 2005
HAL is a multi-disciplinary open access
archive for the deposit and dissemination of
sci-entific research documents, whether they are
pub-lished or not. The documents may come from
teaching and research institutions in France or
abroad, or from public or private research centers.
L’archive ouverte pluridisciplinaire HAL, est
destinée au dépôt et à la diffusion de documents
scientifiques de niveau recherche, publiés ou non,
émanant des établissements d’enseignement et de
recherche français ou étrangers, des laboratoires
publics ou privés.
dayside reconnection at the high- and low-latitude
magnetopause
J. A. Wild, S. E. Milan, S. W. H. Cowley, J. M. Bosqued, H. Rème, T. Nagai,
S. Kokubun, Y. Saito, T. Mukai, J. A. Davies, et al.
To cite this version:
J. A. Wild, S. E. Milan, S. W. H. Cowley, J. M. Bosqued, H. Rème, et al.. Simultaneous in-situ
observations of the signatures of dayside reconnection at the high- and low-latitude magnetopause.
Annales Geophysicae, European Geosciences Union, 2005, 23 (2), pp.445-460. �hal-00329362�
SRef-ID: 1432-0576/ag/2005-23-445 © European Geosciences Union 2005
Annales
Geophysicae
Simultaneous in-situ observations of the signatures of dayside
reconnection at the high- and low-latitude magnetopause
J. A. Wild1, S. E. Milan1, S. W. H. Cowley1, J. M. Bosqued2, H. R`eme2, T. Nagai3, S. Kokubun4, Y. Saito5, T. Mukai5, J. A. Davies6, B. M. A. Cooling7, A. Balogh8, and P. W. Daly9
1Dept. of Physics & Astronomy, University of Leicester, Leicester LE1 7RH, UK 2CESR/CNRS, 9 Avenue du Colonel Roche BP 4346, 31028 Toulouse, Cedex 4, France
3Dept. of Earth & Planetary Sciences, Tokyo Institute of Technology, 2-12-1 Ookayama, Meguro-ku, Tokyo 152-8551, Japan 4Solar-Terrestrial Environment Laboratory, Nagoya University, Toyokawa, Aichi 442, Japan
5Institute of Space & Astronautical Science, 3-1-1 Yoshinodai, Sagamihara, Kanagawa 229-8510, Japan 6Rutherford Appleton Laboratory, Didcot, Oxfordshire, OX11 0QX, UK
7Formerly at: Astronomy Unit, Queen Mary, University of London, UK 8Blackett Laboratory, Imperial College, London SW7 2BZ, UK
9Max Planck Institute for Solar System Research, Katlenburg-Lindau, D-37191 Katlenburg Lindau, Germany
Received: 19 March 2004 – Revised: 16 September 2004 – Accepted: 12 October 2004 – Published: 28 February 2005
Abstract. We present magnetic field and particle data recorded by the Cluster and Geotail satellites in the vicin-ity of the high- and low-latitude dayside magnetopause, re-spectively, on 17 February 2003. A favourable conjunction of these spacecraft culminated in the observation of a se-ries of flux transfer events (FTEs), characterised by bipolar perturbations in the component of the magnetic field normal to the magnetopause, an enhancement in the overall mag-netic field strength, and field tilting effects in the plane of the magnetopause whilst the satellites were located on the magnetosheath side of the boundary. Whilst a subset of the FTE signatures observed could be identified as being either normal or reverse polarity, the rapid succession of events ob-served made it difficult to classify some of the signatures un-ambiguously. Nevertheless, by considering the source region and motion of flux tubes opened by magnetic reconnection at low latitudes (i.e. between Cluster and Geotail), we demon-strate that the observations are consistent with the motion of northward (southward) and tailward moving flux tubes an-chored in the Northern (Southern) Hemisphere passing in close proximity to the Cluster (Geotail) satellites. We are able to demonstrate that a multi-spacecraft approach, cou-pled with a realistic model of flux tube motion in the mag-netosheath, enables us to infer the approximate position of the reconnection site, which in this case was located at near-equatorial latitudes.
Key words. Magnetospheric physics (Magnetosheath;
Mag-netospheric configuration and dynamics) – Space plasma physics (Magnetic reconnedtion)
Correspondence to: J. A. Wild
1 Introduction
Magnetic reconnection is the predominant mechanism by which solar wind energy and momentum are transmitted into the terrestrial magnetospheric cavity. The first in-situ obser-vations of transient reconnection in the vicinity of the high-latitude dayside magnetopause were reported by Haerendel et al. (1978), using magnetic field observations made by the HEOS-2 satellite. Exploiting measurements from one of the first multi-spacecraft missions, Russell and Elphic (1978, 1979) also reported signatures of magnetic reconnection at the dayside magnetopause. Presenting magnetic field data from the low-latitude ISEE-1 and 2 spacecraft, these authors identified characteristic bipolar fluctuations in the field com-ponent normal to the magnetopause (with time scales of a few minutes and a recurrence intervals of ∼5–10 min) and dubbed these signatures “flux transfer events”. Further stud-ies demonstrated that FTEs are usually associated with a mixed plasma population originating from both the magneto-sphere and magnetosheath (e.g. Paschmann et al., 1982; Far-rugia et al., 1988). The interpretation that FTEs were the signatures of transient (few minutes) and localised (few RE)
bursts of magnetic reconnection at the magnetopause pro-posed by Russell and Elphic (1978, 1979) was subsequently endorsed by a collection of studies indicating that FTEs were most frequently observed during intervals when there was a southward directed component of the field in the magne-tosheath (e.g. Rijnbeek et al., 1984; Berchem and Russell, 1984; Kawano and Russell, 1997).
From the earliest observations of FTEs, it was apparent that the characteristic bipolar signature in the magnetic field component normal to the magnetopause manifested itself in at least two distinct forms. Whilst Russell and Elphic (1978),
using high-latitude magnetic field data from the ISEE space-craft, reported observations of bipolar perturbations that were directed first in the outward normal and then the inward nor-mal direction (i.e. in the positive then negative nornor-mal direc-tion), Rijnbeek et al. (1982) presented observations of FTEs at equatorial latitudes that were characterised by inward then outward (negative-positive) bipolar signatures. These signa-tures, referred to as “normal” and “reverse” polarity FTEs, were interpreted as encounters with newly-opened flux tubes connected to the northern and Southern Hemispheres, re-spectively. This inference was supported by a host of statisti-cal surveys indicating that normal (reverse) polarity FTEs are most commonly observed in the Northern (Southern) Hemi-sphere with a mixture of the two observed at equatorial lati-tudes (e.g. Berchem and Russell, 1984; Rijnbeek et al., 1984; Kawano et al., 1992; Russell et al., 1996). In a unique multi-spacecraft study exploiting data from the AMPTE UKS and ISEE spacecraft located in opposite hemispheres, Elphic and Southwood (1987) presented simultaneous observations of normal and reverse polarity FTEs associated with northward and southward moving flux tubes, respectively. However, a survey by Daly et al. (1984), that examined plasma as well as magnetic field observations, suggested that the polarity of the bipolar signature may not necessarily provide a reli-able indication of the hemisphere to which the FTE flux tube is connected. The location and extent (both temporally and spatially) of magnetic reconnection sites on the surface of the magnetopause remains a subject of active debate. Southwood and Farrugia (1988) and Scholer (1988) have suggested that the transient reconnection region is significantly larger than that proposed by Russell and Elphic (1978, 1979), whereas Milan et al. (2000) suggested that the reconnection site may at any one time be spatially localised, but that it propagates wave-like over the magnetopause for extended distances and intervals of time (at least ∼10 min). The study of Milan and co-workers differs from others highlighted so far since it employed simultaneous space- and ground-based measure-ments in order to compare the ionospheric and magneto-spheric signatures of magnetic reconnection. Indeed, the po-tential to exploit ionospheric observations in order to diag-nose reconnection processes at the magnetopause has led to the development of a range of theoretical descriptions that characterise the ionospheric flow signatures that would re-sult from patchy, extended or wave-like reconnection sites (e.g. Southwood, 1985, 1987; Cowley, 1986; McHenry and Clauer, 1987; Lockwood et al., 1990; Wei and Lee, 1990; Cowley et al., 1991; Cowley and Lockwood, 1992; Milan et al., 2000; Coleman et al., 2000, 2001). This theoretical effort has been matched by a plethora of studies that employ ground-based observations of the ionosphere, either in iso-lation or in coordination with space-based experiments, in order to investigate the scale, evolution and occurrence of FTEs (e.g. Van Eyken et al., 1984; Lockwood et al., 1989, 1993; Elphic et al., 1990; Pinnock et al., 1993, 1995; Rodger and Pinnock, 1997; Provan et al., 1998, 1999; Provan and Yeoman, 1999; Milan et al., 1999, 2000; Neudegg et al., 1999, 2000, 2001; McWilliams et al., 2000; Chisham et al.,
2002; McWilliams et al., 2004). The combination of multi-ple in-situ measurements (from experiments on several spa-tially separated spacecraft) and remotely sensed data (from ground-based experiments) is rapidly emerging as a power-ful technique that provides multi-point measurements over a significant fraction of the magnetosphere. However, coordi-nated multi-spacecraft missions have so far been uncommon. The advent of the European Space Agency’s Cluster mission (Escoubet et al., 1997, 2001) has, for the first time, facilitated truly three-dimensional observations of the magnetosphere. So far, Cluster and Cluster/ground-based investigations have yielded several studies of transient reconnection (e.g. Lock-wood et al., 2001a,b; Opgenoorth et al., 2001; Owen et al., 2001; Wild et al., 2001, 2003; Maynard et al., 2003; Mar-chaudon et al., 2004). However, the relatively small sepa-rations of the Cluster spacecraft (typically <1 RE), whilst
ideally suited to the study of small- and meso-scale struc-tures, are unsuitable for the investigation of structures (such as FTEs) evolving over large areas of the magnetopause. The addition of the recently launched Chinese National Space Administration/European Space Agency pair of Dou-bleStar spacecraft will provide measurements at two addi-tional points. In particular, the equatorial spacecraft, whose orbital apogee is ∼12 RE, is designed to encounter the
day-side low-latitude magnetopause in the same local time sector as the Cluster quartet at higher latitudes. In preparation for such conjunctions, we will therefore examine a similar con-junction between the Cluster and Geotail spacecraft. During the interval discussed here, no ground-based data were avail-able since at the time of the conjunction, dayside local times corresponded to the Siberian sector (which is poorly instru-mented). However, we shall compare the in-situ observations to a simple model of magnetosheath and flux tube motion in order to investigate the location of reconnection processes on the dayside boundary. We are thus able to constrain the lo-cation and size of the reconnection region responsible for the FTE signatures observed by Cluster and Geotail.
2 Instrumentation
Upstream solar wind and IMF conditions are provided by the Advance Composition Explorer (ACE) spacecraft (Stone et al., 1998), located some 225 RE upstream of the Earth
in the vicinity of the Sun-Earth L1 libration point. In par-ticular, we will present data from the ACE magnetic fields (MAG) experiment (Smith et al., 1998) and the solar wind electron, proton, and alpha monitor (SWEPAM)(McComas et al., 1998). In order to compare the upstream IMF and solar wind conditions with those in the vicinity of the day-side magnetopause, the ACE data presented below have been lagged to account for the propagation of structure from the spacecraft’s location to the terrestrial magnetosphere. In this case, a comparison of upstream ACE IMF observations and measurements of the magnetic field in the magnetosheath by Cluster indicated that a propagation delay of ∼33 min was appropriate (this is discussed further below).
Fig. 1. The orbital motion of the Cluster (coloured circles) and Geotail (black circles) spacecraft presented in the X-Z (left) and X-Y (right)
GSM planes during the interval 07:00–08:00 UT on 17 February 2003.
Figure 1 presents the motion of the Cluster and Geotail spacecraft in the X-Z (left hand panel) and X-Y (right hand panel) GSM planes during the interval 07:00–08:00 UT on 17 February 2003. During this interval the Cluster quar-tet were moving on an outbound trajectory, traversing the high-latitude post-noon sector (∼13.5 MLT) magnetopause just after 07:00 UT. Meanwhile, Geotail was moving (at low southern latitudes) duskward and Earthward from the noon sector magnetosheath toward the post-noon sector magneto-sphere (∼12.5 MLT). Figure 1 shows the positions of the four Cluster spacecraft (indicated by the colour-coded cir-cles) and Geotail (indicated by the filled black circir-cles) at 07:00 and 08:00 UT. The extent of a model magnetospheric cavity (Shue et al., 1997) is indicated in the GSM Y=0 (left hand panel), and Z=0 (right hand panel) plane by the dashed line. This model is parameterised by the prevailing so-lar wind dynamic pressure and north-south (BZ) component
of the IMF. In this case, we have chosen lagged upstream parameters appropriate to the timing of the magnetopause encounter by Cluster just after 07:00 UT (PDY N=2.3 nPa
and BZ=−0.8 nT, respectively). Measurements of the
lo-cal magnetic field, ion and energetic electron populations at the Cluster spacecraft are provided by the fluxgate mag-netometer (FGM; see Balogh et al., 1997, 2001) and Clus-ter ion spectrometry (CIS; see R`eme et al., 1997, 2001) ex-periments, and the research with adaptive particle imaging detectors (RAPID: see Wilken et al., 1997, 2001), respec-tively. The four spacecraft FGM data employed in this study have been analysed at a temporal resolution equal to the spin
period of the spacecraft (∼4 s). The CIS experiment mea-sures moments of the three-dimensional ion distribution be-tween energies of a few tens of eV/e to around 40 keV/e, yielding the total ion number density and velocity at spin resolution. The Imaging Electron Spectrometer (IES) instru-ment of the RAPID experiinstru-ment detects electrons with ener-gies in the range 20 to 400 keV. In this paper we will present omni-directional IES data from spacecraft 3 only. Corre-sponding magnetic field and particle observations from the Geotail satellite are provided by the Geotail magnetic field experiment (MGF; see Kokubun et al., 1994) and the Geo-tail low energy particle experiment (LEP; see Mukai et al., 1994). The MGF data, namely 3-component measurements of the local magnetic field, have been analysed at a temporal resolution approximate equal to the spin period of the Geotail spacecraft (nominally ∼3 s). The LEP package comprises two sensors, namely the LEP Energy-per-charge Analyzers (LEP-EA) and the LEP Solar Wind ion analyzer (LEP-SW). These sensors operate over different energy ranges as well as having different geometric properties, and the the LEP in-strument effectively selects either one or other as the primary sensor at any given moment. In practice, the reduced size of the SW sensor’s sunward-pointing field-of-view compared to that of the EA device implies that, if immersed in an isotropic plasma, the SW sensor will underestimate the local ion den-sity and incorrectly measure the ion velocity. Consequently, ion velocity and density moments are only presented during periods when the LEP instrument was recording data from the EA sensor, spanning the ∼32 eV/q–38 keV/q range.
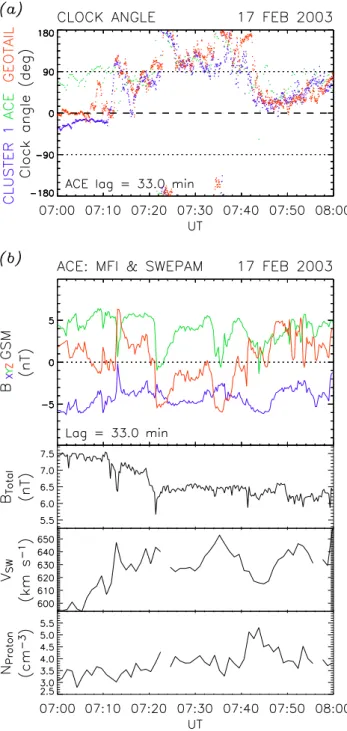
Fig. 2. (a) A comparison of the clock angle of the magnetic field
observed at ACE (green), Cluster 1 (blue) and Geotail (red) be-tween 07:00–08:00 UT on 17 February 2003. The ACE data have been lagged by 33 min. (b) Lagged upstream IMF and solar wind measurements from the ACE spacecraft. The panels present the X (blue), Y (green), and Z (red) GSM components of the interplane-tary magnetic field, the total interplaneinterplane-tary magnetic field strength, the solar wind velocity, and the proton concentration, respectively.
3 Observations
3.1 Upstream interplanetary conditions
Figure 2a presents a comparison of the IMF clock angle ob-served by ACE with the corresponding parameter measured at Cluster and Geotail over the interval 07:00–08:00 UT. The ACE data (colour-coded green) have been temporally lagged by ∼33 min such that the clock angle variations are in approximate agreement with those observed at Cluster 1 (colour-coded blue) and Geotail (colour-coded red) when these spacecraft were located in the magnetosheath after ∼07:11 UT (discussed in detail below). Whilst the observed 33-min propagation time of magnetic field structures from ACE to the dayside magnetosheath is significantly shorter than the delay estimated by, for example, the technique of Khan and Cowley (1999) (which in this case was found to be ∼43 min), the excellent agreement between the lagged IMF and magnetosheath clock angles provides confidence in the 33-min propagation delay inferred here. Figure 2b presents the upstream solar wind and IMF conditions ob-served by ACE during the same interval. These data have also been lagged by ∼33 min, in order to indicate the ap-proximate solar wind and IMF configuration at the subsolar magnetopause between 07:00–08:00 UT. During this period, the IMF was generally oriented earthward (GSM BX−ve),
and duskward (GSM BY+ve) although several brief
dawn-ward excursions were observed. The north-south (GSM BZ)
component fluctuated throughout, varying between ±6 nT. This configuration resulted in an IMF clock angle, defined as arctan(BY/BZ), that generally varied between 45◦and 135◦,
whilst the overall magnetic field strength remained relatively steady at ∼7.5 nT prior to 07:20 UT, falling to ∼6.5 nT for the remainder of the interval. We note that a sharp increase in the solar wind speed from ∼600 km s−1to ∼630 km s−1at ∼07:11 UT resulted in a 10% increase in the solar wind dy-namic pressure. Simultaneously, the dayside magnetopause contracted inward causing the Cluster and Geotail spacecraft to simultaneously exit the magnetosphere (as discussed in de-tail below). We interpret this motion of the magnetopause as a response to the increase in solar wind dynamic pressure, further justifying the chosen 33-min propagation delay ap-plied to the ACE observations.
3.2 Cluster and Geotail observations
As indicated in Fig. 2a, at ∼07:11 UT, the Cluster FGM in-struments recorded a transition from a magnetospheric to a magnetosheath magnetic field configuration. This reorienta-tion of the field was accompanied by a significant increase in the concentration and bulk speed of the ions observed by the Cluster CIS instruments (not shown) which, given the po-sition of the spacecraft, we interpret as an encounter with the high-latitude post-noon sector magnetopause. Follow-ing Cluster’s departure from the magnetospheric cavity, the field and particle signatures of transient magnetic reconnec-tion (i.e. FTEs) were observed on the magnetosheath side of
the boundary. In order to scrutinize these features more care-fully we will compare the measurements of ion concentration with the magnetic field data from all available spacecraft, presented in a boundary normal coordinate system (Russell and Elphic, 1978). We have therefore employed minimum variance analysis (Sonnerup and Cahill, 1967) on the Cluster FGM data to determine the outward normal to the boundary encountered by spacecraft 1 at ∼07:11 UT. When applied to the interval 07:11–07:13 UT, minimum variance analysis (MVA) yielded an outward normal vector with GSM compo-nents (+0.78, +0.12, +0.61). The direction of this normal, being predominantly sunward and poleward, with a small duskward component, is entirely consistent with the expected outward normal of the magnetopause in the high-latitude, post-noon sector. The ratio of the intermediate and minimum eigenvalues of the covariance matrix, a useful indicator of the reliability of the solution, was ∼16, suggesting that the de-rived minimum variance direction was robust. Furthermore, using the technique of Khrabrov and Sonnerup (1998), we estimate that the angular standard deviation of the derived minimum variance vector towards or away from the direc-tions of intermediate and maximum variance to be ∼1◦and ∼0.4◦, respectively. We are therefore confident that the es-timated outward normal direction was sound. Of course, the chief advantage of a multi-spacecraft mission is the ability to (a) determine the planarity of the boundary by comparing the boundary normal direction calculated at each satellite, and (b) estimate any motion of the boundary. In this case, the Cluster 2 and 4 spacecraft crossed the boundary almost si-multaneously (within one spin-period of the spacecraft), fol-lowed by Cluster 1 (some 40 s later), and Cluster 3 (∼3 min later still). The derived outward-directed boundary normals at Cluster 2 and 4 were in close agreement to the correspond-ing normal direction at Cluster 1 (these vectors becorrespond-ing sepa-rated from the spacecraft 1 outward normal by ∼8◦and ∼6◦, respectively). Cluster 3, which started the interval deepest within the magnetosphere, crossed the magnetopause just af-ter 07:15 UT. Minimum variance analysis indicated an out-ward normal almost identical to that observed at the other 3 spacecraft (e.g. within 3◦of that at Cluster 1).
We therefore infer that the boundary was planar during the traversals of the four Cluster spacecraft. The relative timing of the magnetopause crossings of spacecraft 1, 2, and 4 sug-gests that the boundary moved over the spacecraft with an approximately constant velocity component of ∼25 km s−1 in the inward normal direction (based upon the separation be-tween those satellites along the MVA-derived boundary nor-mal direction). Since Cluster 3 did not encounter the mag-netopause until approximately four minutes after spacecraft 1, 2, and 4, it would perhaps be unwise to base a further velocity estimate on the four-spacecraft data set (e.g. using the techniques described by Dunlop and Woodward, 1998, and references therein), as this would rely upon an assumed constant orientation and continuation of the motion of the boundary. However, for completeness, we note that the three velocity estimates relying on spacecraft 3 each indicate an in-ward velocity of ∼10 km s−1. In summary, the Cluster FGM
data reveal the inward motion of the magnetopause over the spacecraft at ∼07:11 UT, the relative planarity of the bound-ary over the inter-spacecraft separation scale (∼5000 km), and the approximate orientation of the outward boundary normal direction.
Figure 3 shows magnetic field data from all four Clus-ter spacecraft presented in boundary normal coordinates be-tween 07:20–07:50 UT. This coordinate system is defined such that N is the estimated outward normal direction, L lies in the boundary and points north (such that the L-N plane contains the GSM Z-axis), and M also lies in the boundary and points west, orthogonal to L and N (such that (L, M, N ) forms a right-handed coordinate system). The uppermost panel of Fig. 3 shows the total magnetic field measured at all four spacecraft as a function of universal time, with the data from each spacecraft colour-coded as indicated, while the following three panels present the L, M, and N field components. The corresponding components of the ion ve-locity, the total ion velocity |V |, and the ion concentration are presented in the remaining five panels, respectively. In the case of the plasma data, moments from CIS hot ion analyser (HIA) sensors on board Clusters 1 and 3 are presented. No CIS data were available from spacecraft 2, while measure-ments from the Cluster 4 CIS ion COmposition and DIstribu-tion FuncDIstribu-tion (CODIF) analyser indicated an unexpected but sizeable positive component of the flow normal to the local boundary orientation. We have attributed this inconsistency to a systematic offset between the velocities recorded by the Cluster 1/3 (HIA) and Cluster 4 (CODIF) CIS sensors (i.e. an instrumental, rather than geophysical effect) and the Cluster 4 data are therefore not presented. Simultaneous data from the RAPID IES instrument (spacecraft 3 only) are compared to the magnetic field data in Fig. 4. The lower panel shows an energy-time spectrogram of energetic electron flux in the 40– 110 keV range during the interval 07:20–07:50 UT (the same as in Fig. 3). The centre panel presents a time-series of flux in 52.7–70.3 keV range only. The upper panel shows the BN
component of the magnetic field data recorded at spacecraft 3, as presented in Fig. 3.
In contrast to the Cluster spacecraft, which approached the high-latitude magnetopause on outbound trajectories, Geo-tail was located at much lower latitude in the post-noon sec-tor throughout the interval of interest. As indicated by the magnetic field clock angle comparison presented in Fig. 2a, at the beginning of the interval Geotail (red dots) observed a magnetic field clock angle of ∼0◦(i.e. approximately
north-ward). This orientation was consistent with a low-latitude position within the dayside magnetosphere, where the ex-pected magnetospheric field points predominantly north-ward, rather than a location in the magnetosheath (given that the lagged ACE data at that time indicated a duskward oriented IMF). At ∼07:11 UT the spacecraft emerged into the magnetosheath and the clock angle variations observed at Geotail began to match closely those seen at Cluster 1 and ACE, and continued to do so until the end of the in-terval presented. We therefore conclude that following the 07:11 UT magnetopause encounters, Geotail and all four
Fig. 3. Cluster magnetic field and ion observations during the
inter-val 07:20–07:50 UT on 17 February 2003, colour-coded according to spacecraft. From top to bottom, the panels present the total mag-netic field strength, the L, M, and N components of the magmag-netic field and the corresponding L, M, and N components of the ion ve-locity (as described in the text), the total ion veve-locity, and the local ion concentration.
Fig. 4. Measurements of energetic electrons made by the RAPID
IES instrument on board the Cluster 3 spacecraft during the interval 07:20–07:50 UT on 17 February 2003. The lower panel presents an energy-time spectrogram of omni-directional electron flux over the 40–110 keV range, colour-coded as indicated. The centre panel presents a time-series in the 52.7–70.3 keV range. For comparison, the upper panel shows the boundary-normal component of the mag-netic field observed at the same spacecraft (as presented in Fig. 3).
Cluster spacecraft were situated in the magnetosheath, at low and high latitudes, respectively.
Figure 5 presents magnetic field observations recorded by the Geotail MGF instrument during the interval 07:20– 07:50 UT (the same interval over which Cluster magnetic field data is presented in Fig. 3). As in the case of the Cluster measurements, minimum variance analysis has been applied to the magnetic field data in order estimate the direction of the outward pointing vector normal to the boundary, with the data then being organised in boundary normal coordinates. In this case, we have applied MVA during 07:11–07:13 UT, cor-responding to the interval when Geotail emerged from a mag-netospheric into a magnetosheath magnetic field configura-tion. This interval also corresponds to the outbound magne-topause crossing observed by the Cluster spacecraft at higher latitudes, presumably due to the global (inward) motion of the magnetopause at that time. Minimum variance analy-sis yields a boundary normal vector with GSM components [+0.93, +0.05, −0.36], with the ratio of the intermediate to minimum eigenvalues of the covariance matrix being ∼4.4. In this case, the angular standard deviations of the minimum variance direction either towards or away from the interme-diate and maximum variance directions were ∼10◦and ∼1◦,
respectively. This uncertainty, while larger than in the cor-responding Cluster MVA, remains acceptable. Furthermore, the derived boundary normal direction, being predominantly sunward, with a small southward and almost no dawn-dusk component, is entirely consistent with the expected outward pointing direction of the magnetopause just southward of the subsolar point. The arrangement of the panels in Fig. 5 is similar to those in Fig. 3, with the panels presenting (from top to bottom) the total magnetic field strength, the L, M, and N components of both the magnetic field and the ion velocity, the total ion velocity, and the local plasma concen-tration.
3.3 Signatures of magnetic reconnection
During the interval 07:20 UT–07:50 UT, several (at least seven) large amplitude bipolar oscillations were observed by the Cluster spacecraft, each usually associated with an en-hancement in the overall magnetic field strength and varia-tions in the magnetic field components in the plane of the magnetopause. These signatures, examples of which oc-curred at ∼07:25, 07:28, 07:31, 07:33, 07:37, 07:39, and 07:41 UT, were observed in the magnetosheath and set against a highly variable background magnetic field. The approximate timings of these features, defined by the local peaks in total magnetic field strength, are indicated by dashed lines in Fig. 3, labeled i–vii, respectively. In general, we have defined as possible FTE signatures those structures that exhibit significant enhancements in the total magnetic field strength (above the background fluctuations in |B|) and iden-tifiable contemporaneous bipolar variations in the BN
com-ponent of the magnetic field. The peak-to-peak magnitude of the bipolar variations exceed 10 nT in each case (and ap-proached 50 nT in the 07:25 UT feature observed at Cluster spacecraft 1 and 3). As such, the bipolar variations indicated in the figure have peak-to-peak amplitudes in excess of the 10 nT discriminator employed by Rijnbeek et al. (1984).
The simultaneous plasma measurements presented in Fig. 3 are generally as expected for a location in the magne-tosheath exterior to the high-latitude post-noon sector mag-netopause. The Cluster 1 and 3 observations are generally in excellent agreement throughout, indicating anti-sunward magnetosheath flow dominated by components in the L and −Mdirections. (of which the L component is larger). These data therefore indicate flow in a predominantly northward and duskward direction. For most of the interval, the compo-nent of the flow normal to the boundary was significantly smaller than the flow in the plane parallel to the topause. Given the highly variable nature of the magne-tosheath flow observed by the Cluster spacecraft, it is dif-ficult to establish a one-to-one correlation with the possible FTE structures inferred from the magnetic field data. How-ever, in some cases there were indications of plasma varia-tions associated with the FTE magnetic field perturbavaria-tions. Notable examples are the reduction in plasma density during FTE event i and enhancements within ±1 min of events v,
vi, and vii observed at spacecraft 1 and 3 (each apparently
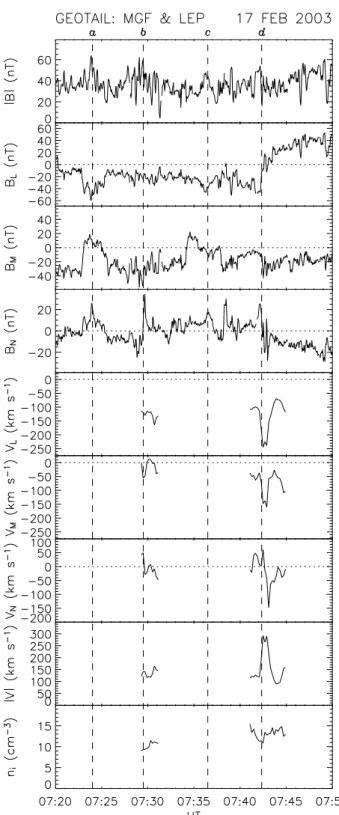
Fig. 5. Magnetic field and plasma observations from the Geotail
spacecraft during the interval 07:20–07:50 UT on 17 February 2003 presented in the same format as Fig. 3.
associated with burst of increased anti-sunward flow), al-though we acknowledge that such interpretation is somewhat subjective, given the variability of the data.
Examination of the RAPID IES data from the Cluster 3 spacecraft (which was located closest to the magnetopause
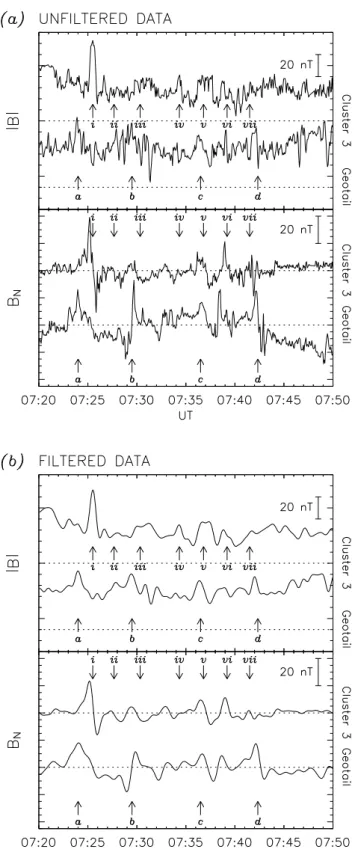
Fig. 6. (a) A comparison of |B| and BNmeasurements from Cluster
3 and Geotail. FTEs identified previously are indicated by arrows, labelled i–vii (Cluster) and a–d (Geotail) as in Figs. 3 and 5, respec-tively. (b) the same data as (a), but band-pass filtered in order to reveal the FTE signatures more clearly.
during this interval) indicated enhanced fluxes of energetic electrons with the majority of the seven events identified from the magnetic field data. As shown in Fig. 4, the majority of the magnetic FTE signatures were closely associated with a burst of electrons whose energies were typical of magneto-spheric particles. In each case, the observed electron flux was around two orders of magnitude lower than observed on the magnetospheric side of the magnetopause earlier in the inter-val (not shown), as expected for FTEs in the magnetosheath (e.g. Daly and Keppler, 1982). A burst of energetic electrons centred on ∼07:21 UT was not accompanied by a signifi-cant magnetic perturbation. We suggest that this may be the final remnants of the magnetopause boundary layer associ-ated with the outbound magnetopause crossing just prior to the beginning of the interval included in this figure. We also note that the final observation of significant fluxes of ener-getic magnetospheric electrons coincided with the magnetic signature of the penultimate FTE (vi). The final FTE (event
vii) was not associated with a burst of energetic electrons.
This is most likely a consequence of the final FTE passing in close proximity to the spacecraft, resulting in the observation of disturbed magnetosheath field lines draped over the open flux tube, but not actually penetrating the FTE (and therefore not observing magnetospheric plasma).
During this interval, the Geotail magnetic field measure-ments, presented in Fig. 5, were also characterised by several large-amplitude, bipolar perturbations observed in the nor-mal component of the field. These perturbations were gen-erally associated with enhancements in the overall magnetic field strength and variations in the direction of the field in the plane of the magnetopause. These are indicated in Fig. 5 by dashed vertical lines labelled a–d. As was the case for similar observations made by Cluster at higher latitudes, we interpret these perturbations as the characteristic signatures of FTEs in the vicinity of the magnetopause. Once again, we note that the differentiation of FTE signatures from “background” variations in the magnetic field is not trivial. In particular, the enhancements in the overall magnetic field strength observed at Geotail are less clear than the equivalent features at Clus-ter. However, for the examples indicated in Fig. 5, we have identified features that exhibit a clear local peak in the total magnetic field strength and a significant perturbation in the boundary normal component of the field. We acknowledge that it is likely that we have identified only a subset of the FTE signatures embedded within the data. As with the FTEs observed at much higher latitudes by Cluster, a variety of BN
type signatures are apparent.
As discussed in Sect. 3.2, appropriate Geotail plasma data were only available for a fraction of the interval presented in Fig. 5. These ion velocity moments indicate that during and immediately following the 07:29 UT FTE (b), the flow speed was ∼150 km s−1, predominantly in the −L (i.e. southward) direction, as expected for a satellite located ∼1.5 RE
south-ward of the subsolar stagnation point. At approximately 07:42 UT, during the final FTE candidate event, a burst of high-speed ion flow was observed. This ∼300 km s−1 flow burst, superimposed upon a background flow similar to
that observed during event b, was mainly in the −L (south-ward) direction, although significant components in the −M (duskward) and −N (inward) directions were observed. Ion density measurements, where available, indicated density be-tween 10–15 cm−3during both events.
4 Discussion
Figures 3, 4, and 5 present the field and particle signatures of flux transfer events in the vicinity of the dayside mag-netopause observed by Cluster and Geotail, respectively. In both cases, the signatures were embedded within a complex and highly-variable magnetosheath field and plasma environ-ment. As such, we acknowledge that the list of FTEs identi-fied during this interval is unlikely to be exhaustive and that other, less well-defined events may have been overlooked. This favourable conjunction of spacecraft has neverthless re-vealed the simultaneous signatures of magnetic reconnection at similar magnetic local times but at greatly seperated lati-tudes.
Figure 6a presents an overview of the magnetic field sig-natures of FTEs observed at Cluster and Geotail. The upper panel presents a comparison of the |B| time-series recorded by Cluster 3 and Geotail, respectively, while the lower panel shows the BN component of the field. We have chosen to
present data from Cluster 3, since during this period, it was this spacecraft that was in closest proximity to the magne-topause. The flux transfer events identified in Figs. 3, 4, and 5 are indicated by arrows in each panel, employing the same
i–vii and a–d labelling as previously. In order to
substan-tiate our interpretation of the signatures and further investi-gate timing of the FTEs observed at each spacecraft, we shall first remove the low amplitude, high frequency perturbations from these time-series. Figure 6b therefore presents the same data as Fig. 6a, but low-pass filtered in order to remove vari-ations with periods less than 1 min. Furthermore, the |B| time-series have also been highpass filtered to remove vari-ations with periods greater than 20 min. As with all filtered data, caution must be exercised such that any subsequent in-terpretation is not reliant upon features (or the lack thereof) that may have been added (or removed) by the actual filtering process. However, in this case, the filtered data presented in Fig. 6b are broadly speaking a faithful representation of the large-scale structure present in the unfiltered measurements. Once again, we acknowledge that there may be further FTE signatures in these time series, in addition to those labelled in Fig. 6, but we shall not seek to define any further candidates at this stage.
It is clear that during this interval, the characteristic signa-tures of magnetic reconnection were observed contempora-neously in the magnetosheath, at both high and low latitudes during a window of approximately 20 min in duration. More-over, the almost continuous train of FTEs appeared to cease simultaneously at all five spacecraft. Given that such widely separated multi-spacecraft observations are somewhat rare, we therefore consider what the observations reveal regarding
the location of the reconnection site during the interval pre-sented. In order to study these signatures in a quantitative fashion, we have employed a realistic model of open flux tube motion based on that of Cooling et al. (2001) to in-vestigate the motion of newly-reconnected flux tubes over the dayside magnetopause (subsequently referred to as “the Cooling model”). Whilst a detailed description of this model is not appropriate here, we shall outline the basic elements of our implementation. This simple model, an evolution of the model of Cowley and Owen (1989), considers the draping and strength of the magnetosheath magnetic field, magne-tosheath flow velocity, and density over the surface of a sim-ple paraboloid magnetopause, based upon the models of Ko-bel and Fl¨uckiger (1994) and Spreiter et al. (1966). In the un-modified Cooling model, a test for steady-state reconnection between the magnetosheath and magnetospheric field (which is everywhere constrained to lie parallel to the magnetopause and point away/toward the southern/northern cusp) may be applied at any point on the surface of the magnetopause. This effectively compares the mean current density in the magne-topause current sheet with some arbitrary threshold value, allowing reconnection to occur if the mean current exceeds the threshold. If reconnection is permitted, a reconnection X line of fixed length is constructed in the direction of the merging current calculated at the reconnection site. The in-stantaneous flux tube motion along the magnetopause due to the effects of stress balance in the reconnected flux tubes and magnetosheath flow, at the so-called de Hoffman-Teller ve-locity (de Hoffman and Teller, 1950), is then calculated, as indicated in Fig. 7a. The subsequent motion of reconnected flux tubes is then traced, via iteration, over the surface of the magnetopause and into the magnetotail from several lo-cations on the X line.
In our modified implementation of the model, the steady-state reconnection test is not applied. Instead, we are able to monitor the subsequent motion of the reconnected flux tubes (i.e. FTEs) away from a user-defined reconnection site (i.e. foregoing the reconnection test). By doing this, we are able to compare the expected flux tube motion with the observed FTE signatures without constraining the location of the re-connection site, using an assumed threshold to the reconnec-tion process. Furthermore, rather than imposing a particu-lar X line orientation, we simply trace the flux tube motion from several point-like reconnection sites in order to mimic the effects of a spatially extended X line (for a discussion of reconnection site location and X-line geometry modelling, the reader is directed to Moore et al., 2002, and references therein).
In the first instance, we shall investigate the FTE signa-tures observed at Cluster and Geotail at ∼07:25 UT (events
i and a, respectively). Given that this was the first
mag-netosheath FTE observed, that the signature was distinct at all spacecraft, and coming some three minutes after the lagged upstream IMF observations indicated a reorientation to ∼180◦ clock angle, it is possible that in this case the near-simultaneous observations made at widely separated lo-cations are consequences of the same reconnection event.
Bgm Bms OHTN OHTS VAbgm VAbms -VAbgm -VAbms Omp VHTN VHTS VSH (a) Bgm Bms OHTN VAbgm VAbms Omp VSH VHTN (b) North South Dusk Dawn North South Dusk Dawn
Fig. 7. (a) Velocity space diagram illustrating the relationship between the various velocity vectors following reconnection at an arbitrary
point (after Cooling et al., 2001). In this case the magnetosheath and geomagnetic field vectors (Bmsand Bgm, respectively) are indicated
in the top right corner. The magnetosheath flow in the Earth’s rest frame, VSH, is indicated by the dot-dashed line. Following reconnection, a pair of open flux tubes is formed, connected to the northern and Southern Hemisphere cusps, respectively. In the rest frame of each reconnected flux tube (i.e. the de Hoffman-Teller frames), which have origins OH T N and OH T S, respectively, the magnetosheath flow
appears as a field-aligned flow at the Alfv´en speed. In the case of the flux tube anchored to the Northern (Southern) Hemisphere cusp, this is indicated by the solid (dashed) arrow labelled VAbms (−VAbms). Consequently, the instantaneous velocies of the flux tubes (at
the de Hoffman-Teller velocity) can be constructed as indicated by the dotted vectors marked VH T N and VH T S, respectively. Plasma in the magnetospheric boundary layer is also moving at the Alfv´en speed along the geomagnetic field line in the de Hoffman-Teller frame, indicated by vectors labelled VAbgmand −VAbgm, respectively. (b) The equivalent velocity space diagram for an open flux tube anchored
in the Northern Hemisphere cusp, in the vicinity of the Cluster spacecraft at ∼07:35 UT, as described in the text. In this case, the draped magnetosheath field is oriented predominantly in the duskward direction. The field-aligned magnetosheath flow in the rest frame of the flux tube (VAbms), while smaller in magnitude than the predominantly northward directed super-Alfv´enic magnetosheath flow (VSH),
contains a larger component in the dawn-dusk direction. The resulting motion of the flux tube, at the de Hoffman-Teller velocity (VH T N),
is predominantly northward with a small dawnward component.
Figure 8a presents results of the Cooling model that sup-port this inference. This figure shows a view of the day-side magnetopause in the GSM Y-Z plane as viewed from the Sun. The concentric dotted circles indicate the magne-topause in the GSM Y-Z plane at X positions of X=+5 RE,
0 RE, −5 RE, and −10 RE while the cusps are represented
by the diamond symbol. In this model, the cusps are po-sitioned at the GSM locations (0.5 RMP, 0, ±RMP), where
RMP is the radius of the model magnetopause at the
subso-lar point. In this case, RMP has been set to 10 RE, roughly
the value predicted by the model of Shue et al. (1997) dur-ing this interval. At 07:22 UT, just prior to the FTE obser-vations at the spacecraft, the lagged IMF had GSM compo-nents (−3.6 nT, −0.5 nT,−5.0 nT), i.e. southward but with a substantial earthward component. The resulting IMF clock angle is indicated in the upper right-hand corner of Fig. 8a.
In this case, the initial reconnection site was positioned just poleward of the subsolar point at GSM coordinates (+9.9 RE, 0 RE, +1 RE), where a large shear between the
draped magnetosheath and geomagnetic fields was expected
(indicated by a red cross in the figure). Open flux tubes were then tracked (forwards in time) from this point over an inter-val of six minutes. The motion of open flux tubes anchored in the Northern (Southern) Hemisphere is thus indicated by the dashed (solid) trace. Similarly, open flux tubes were traced from two additional locations, displaced 1 and 2 RE
duskward of the original point, respectively. For compari-son, the positions of the four Cluster spacecraft (indicated by the filled circles, colour-coded as in Fig. 1) and Geotail (indi-cated by the filled black circle) at 07:25 UT are also included. Clearly, an azimuthally extended X line that includes (but is not limited to) the points indicated by red crosses in Fig. 8a results in open flux tubes that move (under the effects of the magnetic tension force and magnetosheath flow) during the few (∼3) minutes after reconnection, over the locations of the Cluster and Geotail spacecraft. In this example, the flux tubes connected to the Southern Hemisphere arrive at Geotail slightly (∼90 s) before the corresponding Northern Hemi-sphere flux tubes arrive at Cluster, as was the case for the
Fig. 8. The simulated path of open magnetic flux tubes over magnetopause derived from the Cooling model. Each panel represents the dayside magnetopause as viewed from the Sun for the IMF direction indicated in the upper right corner. Concentric dotted circles indicate the radius of the magnetopause in the X=+5, 0, −5, and −10 REplanes while the location of the cusps are indicated by the diamond symbols.
In each panel, reconnection has been initiated at locations indicated by the red crosses. Flux tubes anchored in both the northern (dashed lines) and Southern Hemisphere (solid lines) are traced over 6-min intervals. The Cluster and Geotail spacecraft are indicated by the filled circles, colour-coded as in Fig. 1. The FTE velocity in the Northern Hemisphere, based on multi-spacecraft observations and the estimated open flux tube velocity yielded by the Cooling model, are indicated by the green and black vectors, respectively (scale: 1 RE=100 km s−1).
our choice of positive ZGSM locations for the reconnection
sites, although we note that this effect is relatively insensi-tive to small changes in the orientation of our notional X line (suggesting that the simulation results are stable, rather than contrived). We emphasise that the reconnection sites pre-sented here have been selected, following multiple runs of the model, in order to give good agreement with the timing of the observed FTE signatures. Larger scale (∼RE) changes to the
location of the postulated X line resulted in flux tube motion inconsistent with the observation of FTEs at both Cluster and Geotail. The Cooling model is therefore able to reproduce the timing of the FTEs observed in this case with surprising accuracy, assuming that reconnection occurs simultaneously over the whole of the X line.
Furthermore, the model estimates that by the time they reached the approximate location of the Cluster space-craft, the flux tubes were moving along the surface of the magnetopause at ∼400 km s−1 with GSM
compo-nents (−270 km s−1, +93 km s−1, +286 km s−1). This
mo-tion, at the de Hoffman-Teller velocity, compares favourably with the estimated speed of the FTE obtained by compar-ing the arrival time of specific, identifiable features within the magnetic field data observed by the four, spatially dis-placed spacecraft. When high resolution FGM data are examined in detail (not shown), the positive edge of the positive-to-negative bipolar signature (event i) takes ∼15 s to convect across all four spacecraft. Assuming that the leading edge of FTE structure was planar, constrained to move in the plane of the magnetopause, and travelled
at approximately constant velocity over the tetrahedron, analysis of the multi-spacecraft timing information reveals that the propagation speed of the structure normal to the FTE “front” was ∼380 km s−1, with GSM components (−229 km s−1, +79 km s−1, +295 km s−1). For compari-son, the Cooling model flux tube velocity vector in the vicin-ity of Cluster, and the FTE convection velocvicin-ity vector based upon the multi-spacecraft observations are superimposed on Fig. 8a, coloured black and green, respectively. Noting that at the spacecraft which observed the largest (and longest last-ing) bipolar fluctuation (Cluster 3), the structure took ∼40 s to pass over the spacecraft (peak-to-peak), we infer a scale size of ∼2 REin the direction of motion. As a further
indica-tion of the robustness of the model, we note that the average ion velocity directions measured at Cluster during 20-s win-dows centred on the FTE were broadly consistent with the direction of motion of flux tubes predicted by the Cooling model. During the event, the three Cluster spacecraft with operating particle detectors observed a region of depleted ion density during the passage of the FTE which corresponded to a region of suppressed ion velocity.
Following the first “pair” of FTEs, the assignment of fur-ther corresponding pairs of signatures becomes increasingly subjective due to the relative short inter-FTE period (∼ few minutes at Cluster). However, we shall briefly investigate the sequence of FTEs observed by Cluster and Geotail after ∼07:32 UT (i.e. the latter portion of the interval presented in Figs. 3, 4, 5 and 6). During these events, the period of the BN component fluctuations observed at Cluster was
comparable to the inter-event period (∼2–3 min). Whilst the two events identified at Geotail are separated by a longer in-terval, examination of the noisy magnetic field data suggest that it is highly likely that further FTEs (below the thresh-old of objective discrimination) occur between events c and
d. Consequently, it is all but impossible to delimit individual
events or confidently ascertain the correspondence of events between Cluster and Geotail. We note that during this in-terval, the rate at which FTEs were observed was within the range of repetition times reported by Lockwood and Wild (1993). Given the reduced IMF clock angle during this pe-riod a slight (∼0.5 RE) equatorward displacement and
az-imuthal extension of the X line was required in order produce open flux tubes that propagated over the locations of Cluster and Geotail (Fig. 8b). In this case, by the time it arrived at Cluster, the northward and duskward motion of the mod-elled open flux tube had evolved into northward and slightly dawnward motion. As indicated in Fig. 7b, this motion was a consequence of the predominantly duskward pointing draped magnetosheath field at this location. The duskward compo-nent of the super-Alfv´enic magnetosheath flow at this posi-tion was slightly smaller than the duskward component of the field-aligned magnetsheath flow in the rest frame of the flux tube (a consequence of the magnetosheath flow model employed). Consequently, in the rest frame of the Earth, the flux tube exhibited a poleward and slightly dawnward mo-tion. Detailed examination of the Cluster magnetometer data during the final event (vii) indicates that the ordering of the observed structure as it passed over the spacecraft was once again in concordance with the northward and duskward mo-tion of a planar structure moving at ∼305 km s−1. The
du-ration of the events observed at the Cluster spacecraft were similar to those in the earlier interval (∼40 s), indicating a scale size ∼2 RE. This is supported by the fact that all four
spacecraft observed similar amplitude signatures, implying a lower limit for the spatial scale of the order of the space-craft separation (∼5000 km). As indicated in Fig. 8b, the observed flux tube motion is consistent with the Cooling estimate of the flux tube’s speed in the vicinity of Cluster (∼297 km s−1). However, the predicted direction of propa-gation was not as accurate as in the previous case (the differ-ence in this case between prediction and observation being ∼30◦ in the plane of the model magnetopause). Investiga-tion of the model indicates that under such BY dominant IMF
conditions, the dawnward motion of flux tubes in the high-latitude post-noon sector is not uncommon. The discrepancy between the predicted flux tube motion and that inferred from multi-spacecraft data (which in this case appears to be rea-sonable) is an intrinsic effect of the simple geomagnetic and magnetosheath field, and magnetosheath plasma models re-lied upon by the Cooling technique.
It is also worthwhile considering the polarity of the FTE signatures presented here. At Cluster, located in the high-latitude Northern Hemisphere magnetosheath, event i was a clear example of a normal polarity bipolar perturbation whilst events ii–vii were less clear cut: depending upon the definition of the FTE timing they could be interpreted as
either normal or reverse polarity. However, we infer the bipolar FTE signatures to be of the normal polarity based upon the FTE timings derived from energetic electron obser-vations. We note that this is consistent with the high-latitude position on the spacecraft (as suggested by previous stud-ies, e.g. Berchem and Russell, 1984; Rijnbeek et al., 1984; Kawano et al., 1992; Russell et al., 1996). The simultaneous Geotail measurements, made slightly southward of the equa-tor, present a complex scenario: event a is distinctly asym-metric and best classified as “irregular” while event b is of the reverse polarity. At first inspection events c and d appear to be of normal polarity, although this interpretation is by no means clear-cut. Without clearer |B| signatures, or reliable plasma data, it is not possible to determine the polarity of these fluctuations with absolute certainty.
5 Summary and conclusions
We have presented in-situ observations of the signatures of FTEs at multiple positions in the magnetosheath during the interval 07:20–07:50 UT on 17 February 2003. During this time, the Cluster spacecraft were located in the mag-netosheath, moving away from the high-latitude post-noon sector magnetopause. At the same time, Geotail was located in near-noon sector, at equatorial latitudes in the Southern Hemisphere. The FTE signatures observed by Cluster and Geotail were principally characterised by bipolar perturba-tions in the magnetic field component in the direction normal to the magnetopause and enhancements in the overall mag-netic field strength. This was consistent with the expected enhanced rate of dayside reconnection resulting from the pre-vailing IMF orientation at the time, namely southward and duskward.
Our comparison of the field and particle signatures ob-served at high and low latitudes, using multi-point Cluster data wherever possible, has enabled us to infer the scale and motion of the FTEs. A modified implementation of the flux tube model of Cooling et al. (2001) has been em-ployed in order to investigate the expected time of arrival and direction of motion of open flux tubes (FTEs) at the lo-cations of Cluster and Geotail. For the first FTE signatures observed at the spacecraft, simulations were able to repro-duce the measured propagation delay with considerable ac-curacy, suggesting that reconnection may have been initiated almost simultaneously along an X line located slightly pole-ward of the equatorial plane and extending at least ∼3 RE
in length in the azimuthal direction. The predicted north-ward evolution of reconnected flux tubes anchored in the Northern Hemisphere resulted in them passing over the lo-cations of the Cluster satellites, and was entirely consistent with the observation of normal polarity FTE signatures by each spacecraft. Similarly, the estimated southward evo-lution of reconnected flux tubes anchored in the Southern Hemisphere passed over the location of Geotail (although in this case an irregular FTE signature was observed by the spacecraft). The convection speed and direction of the FTE
structure, inferred from the multi-spacecraft measurements made by Cluster (∼400 km s−1in the predominantly tailward
and duskward direction), was in general agreement with the estimated speed and direction of the flux tubes at the location of Cluster yielded by the model. If propagating at this speed, the duration of the Cluster observations suggest the scale size of the FTE to be ∼2 REin the direction of motion. An
irreg-ular, asymmetric perturbation observed at Geotail was also inferred to be the consequence of an open flux tube anchored in the Southern Hemisphere given the good agreement be-tween the estimated propagation direction and the observed ion flow, and the inferred position of the X line required to initiate the propagation of northward moving FTEs consis-tent with those observed at Cluster. We note that this depar-ture from the expected reverse polarity signadepar-ture is in keep-ing with the observations of Daly et al. (1984), who demon-strated southward moving flux tubes may give rise to signa-tures other than the expected “normal” polarity under certain circumstances and Sanny et al. (1998), who proposed that FTEs formed at an equatorial X line emerge with strongly asymmetric signatures which evolve into the familiar bipolar signature at increasing distances from the X line.
The train of FTEs observed by both Cluster and Geotail during the latter part of the interval under scrutiny was more difficult to classify in terms of normal or reverse polarity sig-natures due to the rapid repetition rate of the FTEs. How-ever, as with the earlier events, consideration of the expected evolution of newly-reconnected flux tubes via the model of Cooling et al. (2001) indicates that the FTEs were not incon-sistent with a low-latitude X line extending at least several RE in azimuth. Furthermore, as in the earlier cases, the
esti-mated propagation velocity of FTE structures based on multi-spacecraft observations is in excellent agreement with the open flux tube propagation velocity predicted by the Cool-ing model. The duration of the FTE signatures durCool-ing these events also indicates a scale-size of ∼2 REin the direction of
motion.
In effect, during the interval presented, we have utilised the multi-point observations (over multiple scale lengths) in order to constrain the inferred location of the reconnection region. By employing a simple model of flux tube motion in the magnetosheath, we have suggested a possible source region of the FTEs observed by the five spacecraft em-ployed in this study. It is interesting to note that without, for instance, the Geotail data, we might have suggested many reconnection configurations that would have resulted in the Cluster observations of FTEs in the high-latitude post-noon sector (or vice versa). However, the provision of observations at both high and low latitudes has in this case constrained the reconnection site to lie at near equatorial latitudes. However, the complexity of the FTE signatures observed during this interval has, in most cases, frustrated attempts to identify any pairing between the events observed at Cluster and Geotail. We anticipate that the advent of the Cluster/DoubleStar programme will yield many favourable conjunctions suitable for investigation by a similar technique.
Given the renewal of interest in large separation situ in-vestigations prompted by the Cluster and DoubleStar com-panion missions, and the current and unprecedented level of ground/space based coordination, we expect investigations such as this to incorporate ground-based data in the future. Indeed, ground-based data would have proven invaluable in this analysis since the ionosphere signatures of reconnec-tion can reveal a great deal regarding reconnecreconnec-tion processes over a significant fraction of the dayside magnetopause, and would have provided an additional foothold in the interpre-tation of the different signatures of magnetic reconnection at widely separated latitudes.
Acknowledgements. The authors would like to thank N. Ness and
the ACE Science Center for providing the solar wind and IMF ob-servations presented here. For his assistance with the Geotail data, we are also grateful to Y. Shinkai of The Graduate University for Advanced Studies at the National Institute of Polar Reserch, Japan. During the course of this study JAW was supported by PPARC grant number PPA/G/O/2001/0014, and SWHC by PPARC senior fellow-ship PPA/P/S/2002/00168.
Topical Editor T. Pulkkinen thanks a referee for his/her help in evaluating this paper.
References
Balogh, A., Dunlop, M. W., Cowley, S. W. H., Southwood, D. J., Thomlinson, J. G., Glassmeier, K.-H., Musmann, G., L ¨Yhr, H., Buchert, S., Acu˜na, M. H., Fairfield, D. H., Slavin, J. A., Riedler, W., Schwingenschuh, K., and Kivelson, M. G.: The Cluster mag-netic fields investigation, Space Sci. Rev., 79, 65–91, 1997. Balogh, A., Carr, C. M., Acu˜na, M. H. A., Dunlop, M. W., Beek,
T. J., Brown, P., Fornacon, H., Georgescu, E., Glassmeier, K.-H., Harris, J., Musmann, G., Oddy, T., and Schwingenschuh, K.: The Cluster Magnetic Field Investigation: overview of in-flight performance and initial results, Ann. Geophys., 19, 1207–1217, 2001,
SRef-ID: 1432-0576/ag/2001-19-1207.
Berchem, J. and Russell, C. T.: Flux transfer events on the magne-topause: spatial distribution and controlling factors, J. Geophys. Res., 89, 6689–6703, 1984.
Chisham, G., Pinnock, M., Coleman, I. J., Hairston, M. R., and Walker, D. M.: An unusual geometry of the ionospheric signature of the cusp: implications for magnetopause merghing sites, Ann. Geophys., 20, 29–40, 2002,
SRef-ID: 1432-0576/ag/2002-20-29.
Coleman, I. J., Pinnock, M., and Rodger, A. S.: The ionospheric footprint of antiparallel merging regions on the dayside magne-tosphere, Ann. Geophys., 18, 511–516, 2000,
SRef-ID: 1432-0576/ag/2000-18-511.
Coleman, I. J., Chisham, G., Pinnock, M., and Freeman, M. P.: An ionospheric convection signature of antiparallel reconnection, J. Geophys. Res., 106, 28 995–29 007, 2001.
Cooling, B. M. A., Owen, C. J., and Schwartz, S. J.: Role of mag-netosheath flow in determining the motion of open flux tubes, J. Geophys. Res., 106, 18 763–18 775, 2001.
Cowley, S. W. H.: The impact of recent observations on theoret-ical understanding of solar wind-magnetosphere interactions, J. Geomag. Geoelectr., 38, 1223–1256, 1986.
Cowley, S. W. H. and Lockwood, M.: Excitation and decay of so-lar wind-driven flows in the magnetosphere-ionosphere system, Ann. Geophys., 10, 103–115, 1992.
Cowley, S. W. H. and Owen, C. J.: A simple illustrative model of open flux tube motion over the dayside magnetopause, Planet. Space Sci., 37, 1461–1475, 1989.
Cowley, S. W. H., Freeman, M. P., Lockwood, M., and Smith, M. F.: The ionospheric signature of flux transfer events, in Clus-ter: Dayside Polar Cusp, ESA SP-330, 105–112, ESA, Noord-wijk, The Netherlands, 1991.
Daly, P. W. and Keppler, E.: Observations of a flux transfer event on the Earthward side of the magnetopause, Planet. Space Sci., 30, 331–337, 1982.
Daly, P. W., Saunders, M. A., Rijnbeek, R. P., Sckopke, N., and Russell, C. T.: The distribution of reconnection geometry in flux transfer events using energetic ion, plasma and magnetic data, J. Geophys. Res., 89, 3843–3854, 1984.
de Hoffman, F. and Teller, E.: Magneto-hydrodynamic shocks, Phys. Rev., 80, 692–701, 1950.
Dunlop, M. W. and Woodward, T. I.: Multi-spacecraft discontinuity analysis: orientation and motion, in Analysis methods for multi-spacecraft data, ISSI SR-001, 271–305, ISSI, Bern, Switzerland, 1998.
Elphic, R. C. and Southwood, D. J.: Simultaneous measurements of the magnetopause and flux transfer events by AMPTE UKS and ISEE 1 and 2, J. Geophys. Res., 92, 13 666–13 672, 1987. Elphic, R. C., Lockwood, M., Cowley, S. W. H., and Sandholt, P. E.:
Flux transfer events at the magnetopause and in the ionosphere, Geophys. Res. Lett., 17, 2241–2244, 1990.
Escoubet, C. P., Schmidt, R., and Goldstein, M. L.: Cluster – sci-ence and mission overview, Space Sci. Rev., 79, 391–391, 1997. Escoubet, C. P., Fehringer, M., and Goldstein, M. L.: The Cluster
mission, Ann. Geophys., 19, 1197–1200, 2001,
SRef-ID: 1432-0576/ag/2001-19-1197.
Farrugia, C. J., Rijnbeek, R. P., Saunders, M. A., Southwood, D. J., Rodgers, D. J., Smith, M. F., Chaloner, C. P., Hall, D. S., Chris-tiansen, P. J., and Woolliscroft, L. J. C.: A multi-instrument study of flux transfer event structure, J. Geophys. Res., 1998, 14 465– 14 477, 1988.
Haerendel, G., Paschmann, G., Sckopke, N., Rosenbauer, H., and Hedgecock, P. C.: The frontside boundary layer of the magne-topause and the problem of reconnection, J. Geophys. Res., 83, 3195–3216, 1978.
Kawano, H. and Russell, C. T.: Survey of flux transfer events ob-served with the ISEE 1 spacecraft: dependence on the interplane-tary magnetic field, J. Geophys. Res., 102, 11 307–11 313, 1997. Kawano, H., Kokubun, S., and Takahashi, K.: Survey of transient magnetic field events in the dayside magnetosphere, J. Geophys. Res., 97, 10 677–10 692, 1992.
Khan, H. and Cowley, S. W. H.: Observations of the response time of high latitude ionospheric convection to variations in the in-terplanetary magnetic field using EISCAT and IMP-8 data, Ann. Geophys., 17, 1306–1335, 1999,
SRef-ID: 1432-0576/ag/1999-17-1306.
Khrabrov, A. V. and Sonnerup, B. U. O.: Error estimates for mini-mum variance analysis, J. Geophys. Res., 103, 6641–6651, 1998. Kobel, E. and Fl¨uckiger, E. O.: A model of the steady state magnetic field in the magnetosheath, J. Geophys. Res., 99, 23 617–23 622, 1994.
Kokubun, S., Yamamoto, T., Acu˜na, M. H. A., Hayashi, K., Sh-iokawa, K., and Kawano, H.: The GEOTAIL Magnetic Field Ex-periment, J. Geomag. Geoelectr., 46, 7–21, 1994.
Lockwood, M. and Wild, M. N.: On the quasi-periodic nature of magnetopause flux transfer events, J. Geophys. Res., 98, 5935– 5940, 1993.
Lockwood, M., Sandholt, P. E., Cowley, S. W. H., and Oguti, T.: Interplanetary field control of dayside auroral activity and the transfer of momentum across the dayside magnetopause, Planet. Space Sci., 37, 1347–1365, 1989.
Lockwood, M., Cowley, S. W. H., Sandholt, P. E., and Lepping, R. P.: The ionospheric signatures of flux transfer events and solar wind dynamic pressure changes, J. Geophys. Res., 95, 17 113– 17 135, 1990.
Lockwood, M., Moen, J., Cowley, S. W. H., Farmer, A. D., Løvhaug, U. P., L¨uhr, H., and Davda, V. N.: Variability of day-side convection and motions of the cusp/cleft aurora, Geophys. Res. Lett., 20, 1011–1014, 1993.
Lockwood, M., Fazakerley, A., Opgenoorth, H. J., Moen, J., van Eyken, A. P., Dunlop, M., Bosqued, J.-M., Lu, G., Cully, C., Eglitis, P., McCrea, I. W., Hapgood, M. A., Wild, M. N., Stam-per, R., Denig, W., Taylor, M., Wild, J. A., Provan, G., Amm, O., Kauristie, K., T. Pulkkinen, Strømme, A., Prikryl, P., Pitout, F., Balogh, A., R`eme, H., Behlke, R., Hansen, T., Greenwald, R., Frey, H., Morley, S. K., Alcayde, D., Blelly, P.-L., Donovan, E., Engebretson, M., Lester, M., Waterman, J., and Marcucci, M. F.: Coordinated Cluster and ground-based instrument observation of transient changes in the magnetopause boundary layer during an interval of predominantly northward IMF: relation to reconnec-tion pulses and FTE signatures, Ann. Geophys., 19, 1613–1640, 2001a,
SRef-ID: 1432-0576/ag/2001-19-1613.
Lockwood, M., Opgenoorth, H. J., van Eyken, A. P., Fazakerley, A., Bosqued, J.-M., Denig, W., Wild, J. A., Cully, C., Greenwald, R., Lu, G., Amm, O., Strømme, A., Prikryl, P., Hapgood, M. A., Wild, M. N., Stamper, R., Taylor, M., McCrea, I., Kauristie, K., Pulkkinen, T., Pitout, F., Balogh, A., Dunlop, M., R`eme, H., Behlke, R., Hansen, T., Provan, G., Eglitis, P., Morley, S. K., Alcayde, D., Blelly, P.-L., Moen, J., Donovan, E., Engebret-son, M., Lester, M., Waterman, J., and Marcucci, M. F.: Coor-dinated Cluster, ground-based instrumentation and low-altitude satellite observations of transient poleward-moving events in the ionosphere and in the tail lobe, Ann. Geophys., 19, 1589–1612, 2001b,
SRef-ID: 1432-0576/ag/2001-19-1589.
Marchaudon, A., Cerisier, J.-C., Bosqued, J.-M., Dunlop, M. W., Wild, J. A., D´ecreau, P. M. E., Foerster, M., Fontaine, D., and Laakso, H.: Transient plasma injections in the dayside magne-tosphere: one-to-one correlated observations by Cluster and by SuperDARN, Ann. Geophys., 22, 141–158, 2004,
SRef-ID: 1432-0576/ag/2004-22-141.
Maynard, N. C., Ober, D. M., Burke, W. J., Scudder, J. D., Lester, M., Dunlop, M. W., Wild, J. A., Grocott, A., Farrugia, C. J., Lund, E., Russell, C. T., Weimer, D. R., Siebert, K. D., Balogh, A., Andre, M., and R`eme, H.: Polar, Cluster and SuperDARN evidence for high latitude merging during southward IMF: tem-poral/spatial evolution, Ann. Geophys., 21, 2233–2258, 2003,
SRef-ID: 1432-0576/ag/2003-21-2233.
McComas, D. J., Bame, S. J., Barker, P., Feldman, W. C., Phillips, J. L., Riley, P., and Griffee, J. W.: Solar Wind Electron Proton Alpha Monitor (SWEPAM) for the Advanced Composition Ex-plorer, Space Sci. Rev., 86, 563–612, 1998.
McHenry, M. A. and Clauer, C. R.: Modeled ground magnetic sig-natures of flux transfer events, J. Geophys. Res., 92, 11 231– 11 240, 1987.