Publisher’s version / Version de l'éditeur:
Canadian Journal of Civil Engineering, 23, 2, pp. 480-489, 1996-06-01
READ THESE TERMS AND CONDITIONS CAREFULLY BEFORE USING THIS WEBSITE. https://nrc-publications.canada.ca/eng/copyright
Vous avez des questions? Nous pouvons vous aider. Pour communiquer directement avec un auteur, consultez la première page de la revue dans laquelle son article a été publié afin de trouver ses coordonnées. Si vous n’arrivez pas à les repérer, communiquez avec nous à [email protected].
Questions? Contact the NRC Publications Archive team at
[email protected]. If you wish to email the authors directly, please see the first page of the publication for their contact information.
NRC Publications Archive
Archives des publications du CNRC
This publication could be one of several versions: author’s original, accepted manuscript or the publisher’s version. / La version de cette publication peut être l’une des suivantes : la version prépublication de l’auteur, la version acceptée du manuscrit ou la version de l’éditeur.
Access and use of this website and the material on it are subject to the Terms and Conditions set forth at
Digital image processing for aggregate orientation in asphalt concrete
mixtures
Yue, Z. Q.; Morin, I.
https://publications-cnrc.canada.ca/fra/droits
L’accès à ce site Web et l’utilisation de son contenu sont assujettis aux conditions présentées dans le site
LISEZ CES CONDITIONS ATTENTIVEMENT AVANT D’UTILISER CE SITE WEB.
NRC Publications Record / Notice d'Archives des publications de CNRC:
https://nrc-publications.canada.ca/eng/view/object/?id=c2258ce8-6203-4550-b2c2-995a18cfebcb https://publications-cnrc.canada.ca/fra/voir/objet/?id=c2258ce8-6203-4550-b2c2-995a18cfebcbDigit a l im a ge proc e ssing for a ggre ga t e orie nt a t ion in a spha lt
c onc re t e m ix t ure s
N R C C - 4 0 1 1 4
Y u e , Z . Q . ; M o r i n , I .
J u n e 1 9 9 6
A version of this document is published in / Une version de ce document se trouve dans:
Canadian Journal of Civil Engineering, 23, (2), pp. 480-489, June 01, 1996
The material in this document is covered by the provisions of the Copyright Act, by Canadian laws, policies, regulations and international agreements. Such provisions serve to identify the information source and, in specific instances, to prohibit reproduction of materials without written permission. For more information visit http://laws.justice.gc.ca/en/showtdm/cs/C-42
Les renseignements dans ce document sont protégés par la Loi sur le droit d'auteur, par les lois, les politiques et les règlements du Canada et des accords internationaux. Ces dispositions permettent d'identifier la source de l'information et, dans certains cas, d'interdire la copie de documents sans permission écrite. Pour obtenir de plus amples renseignements : http://lois.justice.gc.ca/fr/showtdm/cs/C-42
Digital image processing for aggregate orientation
in asphalt concrete mixtures
::iii:hong QI Vue and Isabelle Morin
Abstract: Asphalt concrete is a composite material which consists of asphalt cement, voids, fine particles, sand, and coarse aggregates. Previous investigations of asphalt concrete mixtures have mainly concentrated on the macroscopic properties of the composite materials based0'1the assumption that the mixtures are homogeneous and isotropic. This paper applies an innovative digital image processing technique to quantify the orientations of coarse aggregate particles (=:2 mm) in asphalt concrete mixtures such as hot mix asphalt, stone matrix asphalt, and large stone asphalt compacted in the laboratory or field. The results indicate quantitatively that asphalt concrete specimens compacted in the field or in the laboratory with gyratory compactor have an oriented structure of aggregate particle distribution where the major cross sections of aggregate particles have the tendency to lie horizontally, and that aggregate particles are more randomly oriented in the asphalt concrete specimens compacted in the laboratory with the Marshall compactor.
Key words: asphalt concrete mixtures, digital image processing, microstructure, aggregate orientation, anisotropy, compaction methods.
Resume: Leheton bitumineux est un materiau composite constitue de ciment asphaltique, vides, particules fines, sable et particules grossieres. Les etudes anterieures des melanges de beton bitumineux se sont principalement attardees aux proprietes macroscopiques du materiau, Ie supposant homogene et isotrope. Cet article presente I'application d'une technique innovatrice, l'analyse digitale d'images, pour quantifier les orientations dominantes des particules grossieres (c:2 mm) dans les melanges comrne l'asphalte melange
a
chaud, l'asphalte cOllIe gravillonne et l'asphaltea
gros granulats compactes en laboratoire ou sur terrain. Les resultats demontrent de faeon quantitative que pour Ies echantillons compactes sur terrain ou en laboratoire a l'aide du compacteur gyratoire, la structure forrnee par les agregats presente une orientation dominante. Les agregats ont en effet tendancea
s'orienter de faeon a ce que leur section principale soit dans Ie plan horizontal. Ce n' est pas Ie cas des echantillons prepares aI' aide du compacteur de lahotaroire Marshall ou les agregats sont orientes de faeon plus aIeatoire.Mots eMs: melanges de beton bitumineux, analyse digitale d'images, microstructure, orientation, anisotropie, methodes de compactage.
1. Introduction
Asphalt concrete (AC) is a composite material which consists of asphalt cement, voids, fine particles, sand, and coarse aggregates. These individual materials and components have different physical and mechanical properties and behaviour which have a significant effect on the performance of AC mixtures. It is well recognized that AC performance is also influenced by compaction methods and the quality and effort of compaction. Realistic prediction of the performance of AC mixtures and pavements necessitates consideration of the heterogeneous nature of the composite materials (Sepehr et al. 1994; El Hussein and Yue 1994). However, mechanis-tic models and design of AC mixtures and pavements have concentrated mainly on the macroscopic properties of AC and have been constructed on the basis of general principles
Received June 6, 1995.
Revised manuscript accepted October 27, 1995.
Z.Q. Vue and I. Morin. Infrastructure Laboratory, Institute for Research in Construction, National Research Council Canada, Ottawa, ON KIA OR6, Canada.
Written discussion of this paper is welcomed and will be
received by the Editor until August 31, 1996 (address inside
front cover).
of continuum mechanics (Monismith 1992). The composite materials are always assumed to be homogeneous and iso-tropic and their heterogeneous and anisoiso-tropic properties are largely ignored (Selvadurai et al. 1990).
This paper presents a quantitative investigation on the three-dimensional (3-D) orientations of coarse aggregate par-ticles (;" 2 mm) in AC mixtures. An innovative digital image processing procedure, developed at the National Research Council of Canada (NRC), was utilized to carry out the investigation (Yue et al. 1995). Digital image processing is the term that pertains to converting video images into a
digi-tal form, and applying various mathematical procedures to extract significant information from the picture. A literature survey indicates that the application of digital image pro-cessing to the quantitative study of microstructure of AC mixtures is very limited (Frost and Wright 1993). A related study, funded by the U.S. Strategic Highway Research Pro-gram (SHRP) and carried out by the Danish Road Institute (Eriksen 1993), was on the microscopical analysis of voids in AC mixtures. In this paper, digital image processing hns been applied to the quantitative investigation of coarse aggregate orientation in AC mixtures by examining statisti-cally the differences between the aggregate particles on horizontal and vertical cross sections of AC mixtures. The outline of the paper is as follows:
Yue and Morin
Fig. 1.Multiple cutting for plane cross sections of cylindrical AC specimens: (a) horizontal cutting; (b)vertical cutting. 481
(a)
---
...
§
0 セ§
§
EE 0"
'"
0..
<Xl B 0 <Xl (b) 3"1.5 mm3"t.5 mm 3"1.5 mm 37.5 mtn-""',--+-H-;,
,
§
: Im
,
: . ' J
,
' 0
.... -r-
--",i...
lD I f ' I I ' f I I I I 150 mm(i) a brief description of the digital image analysis tech-niques used in this study;
(ii) definition of morphological measurements of aggregates
on an AC cross section;
(iii) approach for analysis of 3-D aggregate orientation from
two-dimensional (2-D) image data;
(iv) results and analysis of aggregate orientations in AC mixtures by taking into account d.ifferent compaction methods; and
(v) summary of the main conclusions and
recommenda-tions.
2. Digital Image processing procedure
Field cores or laboratory prepared AC specimens are cut using a circular masonry saw in mUltiple vertical or horizon-tal plane cross sections (Fig. I). The AC cross sections are photographed with a ruler placed beneath the section for scal-ing and calibration in the digital image processscal-ing. A Micro-teck flatbed scanner is used to convert the photographs into digital files that can be processed by a computer. The image is stored in a file with .TlF format as series of pixels (or points). For a black and white print and a colour picture (4 in. by 6 in. (I in.=
2.54 cm)), 300 dots per inch and 165 dots per inch were used, respectively. Each pixel has three digital values indicating the X and Ycoordinates and grey level or colour intensity. It is noted that other systems are available for a direct input of a video image into a com-puter using a charge coupled device (CCD) camera (Eriksen1993). However, such a system is quite expensive. An image editing software, called Picture Publisher (vA.O), was then used to manually outline the boundaries of aggregates on the digitalized image. A manual technique waS used because the image analysis software cannot satisfac-torily and automatically recognize if a pixel is part of an aggregate or the asphalt matrix. The automatic recognition of aggregates produced poor results owing to the following facts:
(i) There are aggregate to aggregate contacts. Two or more
aggregates can be recognized as one larger aggregate by the computer.
(ii) The matrix surrounding the aggregate cross sections consists of bituminous material, fine particles (less than 2 mm), and voids. The bituminous material is black. However, the fine particles and voids have different colours. As a result, the matrix is not black and has different grey levels.
(iii) Some aggregate cross sections are very black which can
easily be identified by human eyes, but could be identi-fied as matrix by the computer.
Using the freehand mask tool in Picture Publisher, the area of every aggregate waS marked and filled with a con-trasting colour. Once all aggregates were contoured, the posterize-threshold tool Was used to reduce the colour number to two. One colour represents the aggregates and the other the matriX. The grey scale of a modified image was transformed into black and white. A modified image fIle about 0.6 MB was then obtained. In this modified image file, pixels of aggregates are turned on while pixels of the matrix are turned off.
Image analysis statistics software, called MOCHA, is used to calculate the values of morphological parameters of aggregate cross sections from the modified image file. The ruler is utilized to set up the scale of the image for calcula-tion. A plane Cartesian coordinate system (X, Y) is auto-matically set up. The calculated values of the morphological parameters of aggregate cross sections are saved in a file with ASCII format. The modified image fIle is saved in either .PCX or .TlF format. These morphological param-eters are defined in the next section.
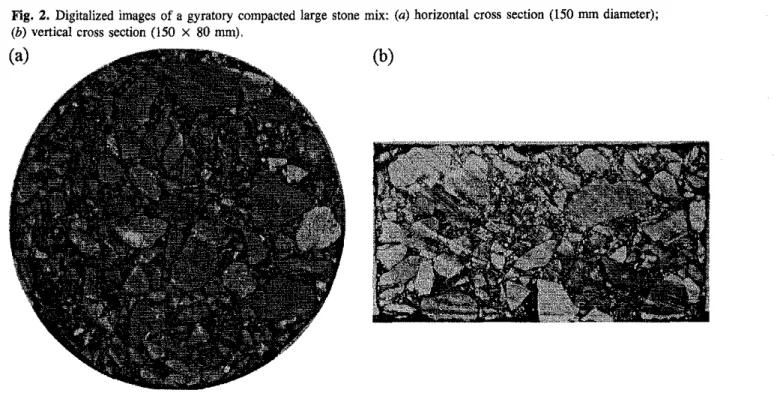
An example of digital image processing results is given in the following. Two digitalized images are illustrated in Fig. 2, which shows the horizontal and vertical cross sections of alSO mm diameter sample of a gyratory compacted large stone mix (LSM). Figure 3 shows the modified images after using Picture Publisher and MOCHA. In this MOCHA image, each aggregate has an identifying number and the major and minor axes of each aggregate cross section are
Fig. 2. Digitalized images of a gyratory compacted large stone mix: (a) horizontal cross section (150 mrn diameter);
(b) vertical cross section (150 X 80 rnm).
also illustrated. Table I presents an example of the digital results of the aggregate characteristics on the AC cross sec-tion in Fig. 2. The listed aggregates in Table 1 can easily be identified in Fig. 3 and the measurements can also be easily checked. It is noted that all the above digital image process-ing was performed on a 66-MHz 80486 personal computer.
3. Parameters of aggregate cross sections
Morphological parameters describing the geometry of an aggregate cross section can be measured using the above digital image processing procedure. Referring to Fig. 4, one can have the values of the following basic parameters of an aggregate cross section:(i) perimeter;
(ii) area;
(iii) coordinate of the centroid;
(iv) coordinates of the major axis ends (Maj Xl> Maj Yl>
Maj Xz, Maj Yz);
(v) coordinates of the minor axis ends (Min Xl> Min Yl>
Min Xz, Min Yz);
(vi) major axis length;
(vii) minor axis length;
(viii) Feret diameter = (4 X areah)liZ;
(ix) major axis orientation; and
(x) shape factor (= 4.. X area/perimeterZ).
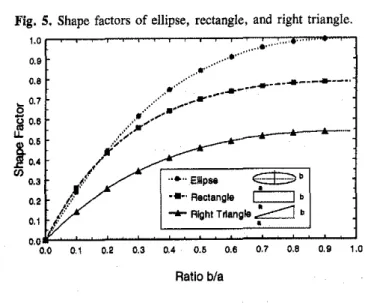
The major axis of an aggregate cross section is defined by the greatest distance between two points of the boundary con-tour. The minor axis of an aggregate cross section is defined as the longest line that can be drawn perpendicular to the major axis. Feret diameter is the diameter of a fictitious cir-cular aggregate that has the same area as the aggregate being measured. Major axis orientation is the angle between the major axis and a horizontal line (I.e., the X-axis) on the scanned image. Shape factor is a measure of how nearly cir-cular an aggregate cross section is. A perfect circle has a
(b)
shape factor of I and a line has a shape factor of O. In general, the less the shape factor, the more elongate the parti-cle cross section (the less the ratio of the minor axis length to the major axis length). Figure 5 illustrates the shape fac-tors of ellipses, rectangles, and right triangles versus the ratio of the width (height) to the length.
4. Approach for aggregate orientation In
AC mixes
The above digital image processing procedure accurately measures the geometrical values of the characteristics of aggregate particles on the 2-D images of AC cross sections. The orientation of aggregate particles, however, is one of the 3-D and statistical characteristics of the aggregate distribu-tion in AC mixtures. In order to estimate the 3-D orientadistribu-tion of coarse aggregate particles in AC mixtures from 2-D image data, this paper uses the quantitative measurements of coarse aggregates on horizontal and vertical cross sections of AC mixtures. In other words, the 3-D orientations of coarse aggregate particles are investigated by comparing the geo-metrical characteristics of coarse aggregate particles on horizontal and vertical cross sections of AC mixtures. This approach to investigate the dominant aggregate orientations using digital image processing is based on the assumption that the difference between the aggregate particles on hori-zontal and vertical cross sections is an index directly related to the dominant orientation of coarse aggregate particles in AC mixtures. The validation of this assumption is based on the following physical observations:
(i) Aggregate particles are not purely spherical and have
major, intermediate, and minor planes.
(ii) Aggregate particles are randomly oriented during mixing before paving.
(iii) The major planes of aggregate particles are more likely tu lie horizontally either during laying by the screed
Yue and Morin
Fig. 3. Digital images of Fig. 2 after MOCHA in a Cartesian coordinates system: (a) horizontal cross section (150 mm diameter);
(b) vertical cross section(I50 X 80mm).
483
(a)
x
(b)
Yx
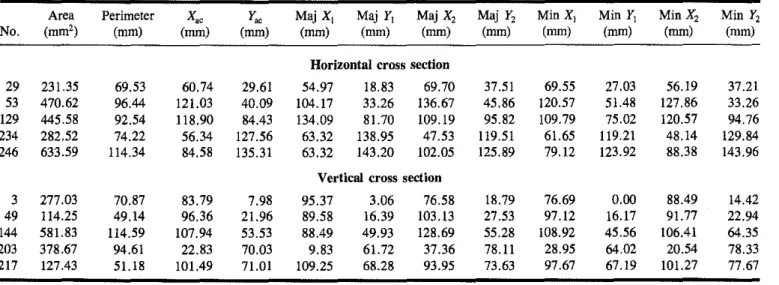
Table 1. Selected results for the basic measurements of aggregate cross sections of Fig. 3.
No. Area (mm') Perimeter (mm) (mm)yセ Maj X, (mm) Maj Y, (mm) Maj X, (mm) Maj Y, (mm) Min Xl (mm) MinYj (mm) MinX, (mm) Min Yz (mm)
Horizontal cross section 29 231.35 53 470.62 129 445.58 234 282.52 246 633.59 69.53 96.44 92.54 74.22 114.34 60.74 121.03 1l8.90 56.34 84.58 29.61 40.09 84.43 127.56 135.31 54.97 104.17 134,09 63.32 63.32 18.83 33.26 81.70 138.95 143.20 69.70 136.67 109,19 47.53 102.05 37.51 45.86 95.82 1l9.51 125.89 69.55 120.57 109.79 61.65 79.12 27.03 51.48 75.02 1l9.21 123.92 56.19 127,86 120.57 48.14 88.38 37.21 33.26 94.76 129.84 143.96 Vertical cross section
3 277.03 49 1l4.25 144 581.83 203 378.67 217 127.43 70.87 49.14 1l4.59 94.61 5U8 83.79 96.36 107.94 22.83 101.49 7.98 21.96 53.53 70.03 71.01 95.37 89.58 88.49 9.83 109.25 3.06 16.39 49.93 61.72 68.28 76,58 103.13 128.69 37.36 93.95 18.79 27.53 55.28 78. II 73.63 76.69 97.12 108.92 28.95 97.67 0.00 16.17 45.56 64,02 67.19 88.49 91.77 106.41 20.54 101.27 14.42 22.94 64.35 78,33 77.67
bar of a paving machine or during compaction.
If the structure of aggregate particles were oriented in an AC mixture, then the horizontal cross sections of AC speci-mens would cut more major and intermediate planes of the aggregate particles, and the vertical cross sections of AC specimens would cut more intermediate and minor planes of the aggregate particles. From statistical point of view, the sizes (or areas) of the aggregate particles on the horizontal cross sections would begreater than those of the aggregate particles on the vertical cross sections. In this paper, we use the following statistical parameters in the analysis:
(i)
Number-per-unit-area:
total number of aggregatepar-ticles over the total area in square centimetres (em') of the
cross section.
(ii) Area percentage:
percentage of the area occupied by aggregates over the total area.(iii) Area gradation by dimension:
summation of the areas of the aggregate cross sections whose minor axis lengthS, major axis lengths or Feret diameter are respectively between 2 mm and a dimension d (d '" 2 mm) over the total aggregate areas. It is expressed in percentage as a function of the dimension d.(iv) Area gradation by shape factor:
Summation of the areas of aggregate cross sections whose shape factors are• • • • 0 • • • • • • • • • • • • . .
..
' 0" ... ... empaac-d-·O) ,
•••. RectangleC::=:J
b ... Right Triangleセ b•
0.20.'
1.0 0.9 ... 0.7 g 1Il0.'
u..!.
0.5 20.4 CIl 0.3 0.0 0.0 0.1 0.2 0.3 0.4 0.5 0.6 0.7 0.8 0.9 1,0Fig. S. Shape factors of ellipse, rectangle, and right triangle. Fig. 4. Geometric definition of an aggregate cross section.
(Mal X2, Mal V2)
x
between 0 and a value s (0 S s
s
1) over the total aggregate areas. It is expressed in percentage as a function of the values.
In-house computer programs were developed to calculate the above statistical parameters of the characteristics of aggregate particles on AC cross sections from the morpho-logical parameters of each aggregate cross section obtained using the digital image processing procedure. The three dimensions of an aggregate cross section (Le., minor axis length, Feret diameter, and major axis length) can be applied to the definitiou of coarse aggregates(d ;" 2 mm) on an AC cross section.
It is also noted that a sieve gradation is determined by the lengths of the intermediate and minor principal axes of the particle itself and a digital image gradation is based on planar particle cross sections whose dimensions, depending on the location and orientation of the cut surface, are usually governed by the minor, intermediate, and major principal axis lengths of the particle.
5. AC mixes used in the analysis
Four AC mixes are utilized in the following analysis of aggregate orientation in AC mixtures. Two of the four mixes are conventional, dense, hot asphalt mixes, referred to as HIA and HL8 specified by the Ministry of Transportation of Ontario (MTO), Canada. The other two mixes are a large stone asphalt mix (LSM) and a stone matrix asphalt (SMA) developed at the Pavement Research Group of NRC (El Hussein eta1.1993). Details of the four mix formulae are presented in Table 2. In particular, SMA is a gap-graded hot asphalt mix that maximizes the binder and coarse aggregate contents. High resistance to rutting of LSM and SMA can be achieved through stone-to-stone contact in the AC mixtures. Four AC specimens of 150 mm in diameter and 85 mm in height of each of the four mixes were compacted in the laboratory using SHRP gyratory compactor. The number of gyrations was 250, the applied pressure was 0.6 MPa, and the gyratory angle was 10
•
Furthermore, AC specimens (HIA mix) prepared with four different compaction methods are also used in order to investigate the effect of compaction methods on aggregate orientation in AC mixtures. Three specimens (100 mm in diameter and 65 m in height) were prepared using the
gyra-Ratiobla
tory compactor with the same compaction effort as described above. Five specimens (100 mm in diameter and 65 mm in height) were prepared with the Marshall compactor using 100 impact blows. The high compaction effort of Marshall compaction is selected deliberately in order to show the effect of the compaction method under an extreme condition. Four cores of 95 mm in diameter and 60 mm in height were recovered from each of two sections of an experimental pavement compacted respectively using a conventional vibratory steel roller followed by a rubber-tire roller and the Asphalt Multi-Integrated Roller (AMIR) (Svec and Halim 1991). The aggregates used in the mixes were limestone from McFarland Quarry, Ottawa, Ontario.
6. Results and analysis
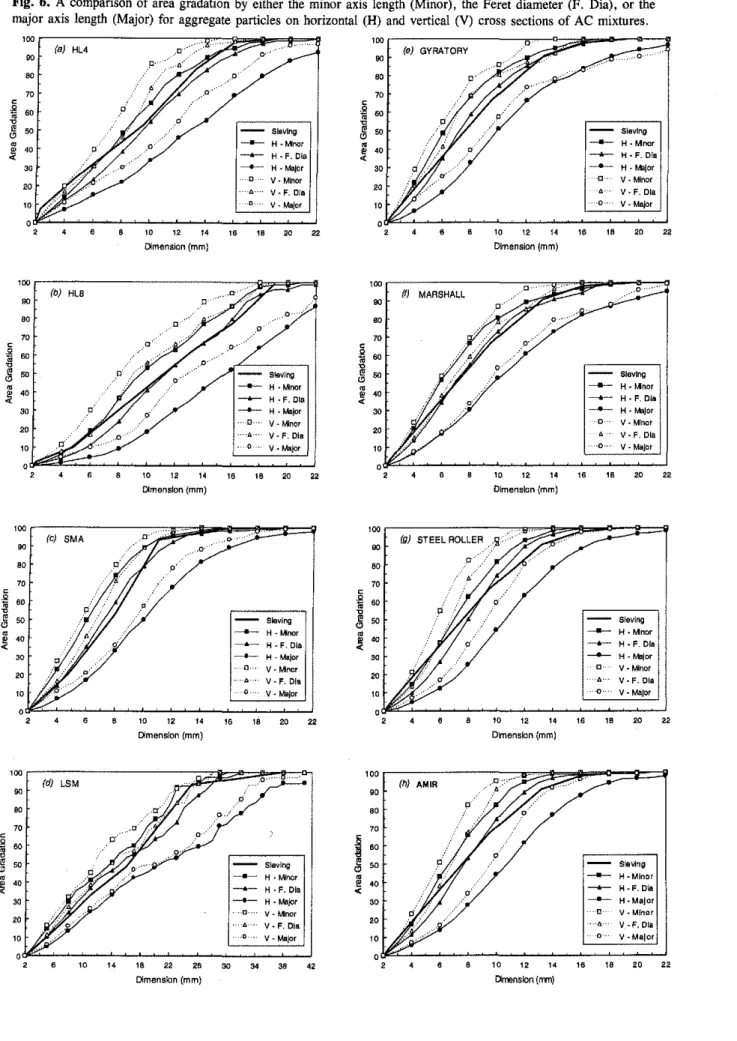
Statistical results obtained from the digital image processing are summarized in Figs. 6 and 7 and Table 3. Figure 6 illus-trates the average area gradations by the minor axis length, Feret diameter, and major axis length for aggregate particles on the two perpendicular cross sections of AC mixtures. The gradations of coarse aggregates obtained from a sieve analy-sis (Table 1) are also plotted in Fig. 6. Figure 7 illustrates the average area gradation by shape factor for aggregate par-ticles on the AC cross sections, where the Feret diameters of the aggregate cross sections are equal to or greater than 2 mm.
From Fig. 6, one can observe that the curves of the image gradation by either the minor axis length or the major axis length on the horizontal AC cross sections are always on the right side of those on the vertical AC cross sections, respec-tively. From Figs. 6 and 7, one can observe that the curves of the image gradation by the Feret diameter on the horizon-tal AC cross sections are always on the right side of those on the vertical AC cross sections. These observations indicate that the sizes and shape factors of aggregate particles on the horizontal cross sections are greaterthan those on the verti-cal cross sections of the AC mixtures. The difference in shape factors represents that the aggregate particles on the vertical AC cross sections are more elongated than those on the horizontal AC cross sections.
Yue and Morin
Table2. Mix design details ofHU, HL8, LSM, and SMA.
(a) Average bulk specific gravity and asphalt content by weight
Average bulk Asphalt content(%)
Mix specific gravity* MTO specification Chosen
HU 2.48 5.0-7.0 5.0
HL8 2.49 4.5-7.0 4.5
LSM 2.49 4.0
SMA 2.40 4.6
(b) Sieve analysis (percent passing by dry weight of aggregates)
HU HL8
Sieve MTO MTO Sieve
(nun) specification Chosen specification Chosen (nun) LSM
25.0 100 37.5 100 19.0 100 100 94-100 99.5 25.0 95 16.0 98-100 99 77-95 85 16.0 61 13.2 83-95 90 65-90 75 11.0 49 9.5 62-82 72 48-78 60 8.0 40 4.75 50-60 55 30-50 40 4.75 31 2.36 27-60 45 21-50 35 2.00 24 1.18 16-60 30 12-49 30 0.85 19 0.600 8-47 25 6-38 20 0.425 12 0.300 4-27 15 3-22 15 0.250 6 0.150 1-10 5 1-9 6 0.150 3 0.G75 0-6 2 0-6 2 0.G75 I <0.075 0 0 0 0 <0.G75 0
*According to ASTM Standard D2726-90.
485 SMA 100 95 65 40 25 10
o
image gradation by the minor and the m'\ior axis lengths pro-vide the lower and upper bounds of those curves from the sieve analysis, respectively, and that the curves of the image gradation by the Feret diameter are the closest ones to those curves from the sieve analysis for each of the four AC mix-tures (RIA, RL8, SMA, and LSM).
Table 3 illustrates the exact values of the statistical differ-ences of the characteristics of aggregate particles on the horizontal cross sections and the vertical cross sections of the AC mixtures. Table 3 shows the statistical data, including
(i)the number of horizontal and vertical cross sections used in the analysis; (ii) the average number of aggregates per unit AC area (em'); (iii) average area percentage occupied by aggregate particles; and(iv)average area per aggregate cross
section.
From Table 3, one can make the following observations: (a) For the RIA, SMA, and LSM specimens of 150 mm in diameter compacted with the gyratory compactor and for the RIA specimens compacted with Marshall and AMIR, the area percentages on the horizontal cross sections are almost the same as those on the vertical cross sections, respectively.
(b) For all the specimens except the RIA specimens com-pacted with the Marshall compactor, the average areas per aggregate on the horizontal cross sections are much larger than those on the vertical cross sections.
(c) The number of aggregates per AC unit area (cm2) on
the AC vertical cross sections are much greater than those on the AC horizontal cross sections.
(d) For the RIA gyratory compacted mixtures, the aver-age area percentaver-age on the vertical cross sections of the specimens of 100 mm in diameter is about 30
%
less than that of the specimens of 150 mm in diameter.(e) The area percentages and the average areas per aggregate are almost the same for the aggregate particles on the horizontal and vertical cross sections of the RIA speci-mens compacted with Marshall compactor. This result can also be observed in Fig. 6f.
The observations (a), (b), and (c), and those from Figs. 6 and 7 indicate that the aggregate particles on the vertical cross sections have less areas, and their shapes are more elongated than those on the horizontal cross sections in the AC specimens compacted in the field or in the laboratory with gyratory compactor. This result represents that the major planes of aggregate particles in the AC specimens compacted in the field or with gyratory compactor in the laboratory lie more horizontally in the mixtures. As a result, the aggregate particles in the AC specimens have an oriented structure which makes the AC mixtures have an anisotropy property.
The observations (a) and (d) may indicate that the speci-men size (diameter) has an effect on the orientation of aggregate particles during the gyratory compaction.
Fig. 6. Acomparison of areagradationby either the minor axis length (Minor), the Feret diameter (F. Dia), or the major axis length (Major) for aggregate particles on horizontal (H) and vertical (V) cross sections of AC mixtures.
100 (a) HL4 . 0 90
"
70 < < セ 60 S•
セ1i
•
60 Sieving Sieving セ セ•
セ H • M1rlQr•
H.Mnor•
40 セ H • F. Cia•
H·F.Dla'"
<"
セ H •Major H - MlJor 0 V·Minor V -Minor 0 V· F. Dla V· F. Ola V - Major V -Major 0,
10"
14"
" " "
•
10"
14"
16" "
DImension (mm) Dimension (mm) 100 100 (b) Hl8 mMARSHALL 90 90"
"
70 70 < <..
60•
60•
•
セ1i
•
50 Sieving 60 Sieving セ セ•
セ H •Minor•
セ H·"'nor セ 40 セ H· F. Dla•
40 セ H· F. Ola'"
"
セ H • Major"
セ H· Ml)cr 0 V -MirlOf 0 V·Minor"
••••.0. .• V- F. Dla"
,
V· F. Dla10 V·Major 10 o· V-Major
0
,
0 10"
14" " " "
,
10"
14 16" " "
Dimension (mm) Dimension (mm) .... V· F. Ola o· V. Major•
10 12 14 Dlmensk>n (mm) Sieving セ H -Idnor セ H • F. Ola セ H - Major 0 V-Mnor..
V-F.Dla V·Major" " " "
10 12 14 Dimension (mm) 16 16 Sieving H·Mnor H· F. Ola H - Malar V· Minor" "
_,0'" 18 22 26 DImension (mm)"
34 Slaving H • Mloor H· F. Ola H •Major V-Mnor V· F. Dla V -Major"
Sieving セ H ·Mlnor セ H·F. Dla セ H·MaJor D V· Minor...
V -F. Dia 0 V-Major 10"
"
"
16" "
Omension (rrm)Yue and Morin 487 Fig. 7. A comparison of the area gradation by shape factor for aggregate particles of Feret diameter ;;:: 2 rom on horizontal (H) and vertical (V) cross sections of AC mixtures.
"'"
NNNMMMMMMMMMMMMMMBGセMNNLNNNMBGQ "0 . . . - - - " " " " " "...-""'/ 20---
SMAH ·0·· SMAV ---+- LSM H ... A··· LSM V 01 0.' '3 0.4 0.' os 0.7 0'"
1. Shape Factor (b) 20 00'"
00"
""
HL4 VHl4 H HLS H 10 HLaVッlNMNNNMセセセセZZZZ]ZZZZBセ
M セ U M M M M セ セ セ Lセ"
00'"
Shape Factor (a)"'"
(e)""
(d)'"
00'"
"
'"
'"
g
c'"
B eo セ "0•
セ eoe
eo"
•
セ'"
"
•
•
"
"
"
Slee! Roller H'"
Gyratory HGyratory V'"
Steel Aolfer V'"
---+- Marshall H"
AMIRH 10 .. -d'" MlrshalfV"
AMIRV 0 0 0.0 01 0' o. M 05"
07"
0.' 1. 0.0 0.1 02 0.3 0.' 05 os 0.7 0.' os 1.0Shape Factor Shape Factor
The observations (a) and (e) and Figs. 6fand 7cindicate that the aggregate particles on the vertical cross sections almost have the same areas as those on the horizontal cross sections and are little more elongated than those on the hori-zontal cross sections of the AC specimens compacted with a Marshall hammer. Consequently, the AC specimens com-pacted with the Marshall compactor had a more randomly oriented distribution of aggregate particles.
The above analysis indicates that Marshall compaction results in a more randomly oriented structure of the coarse aggregate particles which is not found in the AC pavement. This finding has implications for voids in asphalt mix design using the Marshall method. When Marshall testing is done on an aggregate gradation with a significant number of elon-gated and flat particles, these particles will resist reorienta-tion that would be achieved by the paving process. This incomplete compaction in the Marshall process will under-estimate the compaction likely to be achieved in the field and
hence overestimate the voids in the mix. In some cases,
espe-cially with skinny mixes, the overestimation of voids in the mixes can result in closing of the voids and flushing of asphalt cement to the pavement surface.
7. Conclusions and recommendations
The digital image processing procedure has been successfully applied to the quantitative investigation of the orientation of coarse aggregates in AC mixtures. The 3-D orientation of coarse aggregate particle structure was investigated by com-paring the geometrical characteristics of aggregate particles on horizontal and vertical cross sections of AC mixtures. The differences of aggregate characteristics on the horizontal and vertical cross sections are affected by aggregate gradations and shapes and compaction methods. The differences indi-cate quantitatively that the major cross sections of aggregate particles have the tendency to lie horizontally in the AC specimens compacted using the gyratory compactor, steel roller, or AMIR, and that the aggregate particles may be more randomly oriented in the AC mixtures compacted with the Marshall compactor. These findings indicate that com-paction similar to the paving process may not be achieved in the laboratory using the conventional Marshall compactor, but could be achieved in the laboratory using the gyratory compactor. The oriented structure of aggregate particles con-tributes to the anisotropic properties of AC mixtures, whichTable 3. A comparison of statistical parameters of aggregate particles on horizontal (H) and vertical (V) cross sections of AC mixtures. Mix Compaction method Number of AC cross sections H V Criterion :>:2 mm Average number of aggregates per ACunit area (cm2) H V H V H V Ratio* Specimens of 150 mm diameter HLA HL8 SMA LSM Gyratory Gyratory Gyratory Gyratory 4 4 4 4 3 3 3 3 Minor Feret diameter Major Minor Feret diameter Major Minor Feret diameter Major Minor Feret diameter Major 1.165 1.619 2.032 0.955 1.116 1.174 1.840 2.277 2.427 0.959 1.204 1.282 1.516 2.194 3.214 1.118 1.437 1.858 1.997 2.675 3.548 1.033 1.345 1.690 44.17 46.25 47.28 56.16 56.98 57.13 50.64 52.88 53.27 59.47 60.72 60.93 45.08 48.20 50.56 48.16 49.68 50.60 49.56 52.75 54.85 57.59 59.04 59.88 37.93 58.58 23.27 58.81 51.08 48.65 27.53 23.22 21.95 62.00 50.43 47.53 29.80 21.93 15.70 43.20 34.57 27.28 24.78 19.62 15.44 55.60 43.70 35.22 1.273 1.303 1.482 1.361 1.478 1.783 1.111 1.183 1.421 1.115 1.154 1.350 Specimens of 100 mm diameter HLA HLA HLA HLA Gyratory Marshall Steel roller AMIR 17 14 19 13 3 5 6 6 Minor Feret diameter Major Minor Feret diameter Major Minor Feret diameter Major Minor Feret diameter Major 1.479 1.830 2.022 1.528 1.968 2.256 1.368 1.622 1.831 1.444 1.813 2.103 1.506 2.080 2.701 1.660 2.180 2.518 1.529 1.875 2.280 1.597 2.037 2.455 42.72 44.50 44.98 44.46 46.65 47.37 43.97 45.21 45.71 44.56 46.34 47.04 34.29 36.84 38.28 45.35 47.90 48.71 39.98 41.57 42.53 42.72 44.86 45.84 28.89 24.31 22.25 29.10 23.72 21.00 32.13 27.87 24.97 30.85 25.55 22.37 22.74 17.71 14.16 27.35 22.01 19.39 26.14 22.17 18.67 26.76 22.02 18.69 1.270 1.373 1.571 1.064 1.078 1.083 1.229 1.257 1.337 1.153 1.160 1.197 *Ratio of average area per aggregateon horizontal cross sectionstoaverage area per aggregate on vertical cross sections.
should be takeu iuto account iu pavement stress analysis and performauce modelling.
Acknowledgements
Deep gratitude is extended to Dr. N.K. Siuba, Senior Research Officer of the Iustitute for Euviroumental Research aud Technology, NRC, OUawa, Cauada, for making the digital image processing facilities available for this investi-gation.
References
El Hussein, H.M., and Yue, Z.Q. 1994. Criteria for evaluation of rutting potential based on repetitive uniaxial compression test. Transportation Research Record 1454, Transportation Research Board, National Research Council, Washington, D.C., pp. 74-81.
£1 Hussein, H.M., Svec, O.J., and Zanzooto, L. 1993. Perfor-mance of asphalt concrete mixes containing large size mineral aggregates. Proceedings of the Annual Conference of the
Cana-dian Society for Civil Engineering, Frederiction, N.B., Vol.IV.
pp.307-317.
Eriksen, K. 1993. Microscopical analysis of asphalt-aggregate mixtures related to pavement performance. Report Note 245,
Danish Road Institute, Denmark, November.
Frost, J.D., and Wright, J.R. (Editors). 1993. Digital image processing: techniques and applications in civil engineering. American Society of Civil Engineers, New York.
Monismith, C.L. 1992. Analytically based asphalt pavement design and rehabilitation: theory to practice, 1962 -1992.
Transporta-tion Research Record 1354, TransportaTransporta-tion Research Board,
National Research Council, Washington, D.C., pp. 5-26. Selvadurai, A.P.S., Au, M.C., and Phang, W.A. 1990. Modelling
of low temperature behaviour of cracks in asphalt pavement structures. Canadian Journal of Civil Engineering, 17: 844-858.
Sepehr, K., Svec, OJ., Yue, Z.Q., and EI Hussein, H.M. 1994. Finite element modelling of asphalt concrete microstructure. In
Localized damageill: Computer-aided assessment and control.
EditedbyM.H. Aliabadi, A. Carpinteri, S. Kalisky, and DJ.
Cartwright. Computational Mechanics Publications, Southamp-ton, Boston. pp. 225-232.
Vue and Morin
Svec, OJ .. and Ralim, A.a.A. 1991. Field verification of a new asphalt compactor, AMIR. Canadian Journal of Civil
Engineer-ing, 18: 465-471.
Yue, Z.Q., Bekkiug, W., and Moriu, I. 1995. Application of digital image processing to quantitative study of asphalt concrete
489 microstructure. Transportation Research Record 1492, Trans-portation Research Board, National Research Council,