Publisher’s version / Version de l'éditeur:
Vous avez des questions? Nous pouvons vous aider. Pour communiquer directement avec un auteur, consultez la première page de la revue dans laquelle son article a été publié afin de trouver ses coordonnées. Si vous n’arrivez Questions? Contact the NRC Publications Archive team at
PublicationsArchive-ArchivesPublications@nrc-cnrc.gc.ca. If you wish to email the authors directly, please see the first page of the publication for their contact information.
https://publications-cnrc.canada.ca/fra/droits
L’accès à ce site Web et l’utilisation de son contenu sont assujettis aux conditions présentées dans le site LISEZ CES CONDITIONS ATTENTIVEMENT AVANT D’UTILISER CE SITE WEB.
Research Report (National Research Council of Canada. Institute for Research in
Construction), 2004-11-08
READ THESE TERMS AND CONDITIONS CAREFULLY BEFORE USING THIS WEBSITE.
https://nrc-publications.canada.ca/eng/copyright
NRC Publications Archive Record / Notice des Archives des publications du CNRC :
https://nrc-publications.canada.ca/eng/view/object/?id=e156469b-0259-478a-a2a0-cc3d409c07fa https://publications-cnrc.canada.ca/fra/voir/objet/?id=e156469b-0259-478a-a2a0-cc3d409c07fa
NRC Publications Archive
Archives des publications du CNRC
For the publisher’s version, please access the DOI link below./ Pour consulter la version de l’éditeur, utilisez le lien DOI ci-dessous.
https://doi.org/10.4224/20377935
Access and use of this website and the material on it are subject to the Terms and Conditions set forth at
An Extended Survey of Combustible Contents in Canadian Residential
Living Rooms
An Extended Survey of
Combustible Contents in
Canadian Residential Living
Rooms
Research Report No. 176
Date: November 8, 2004
Author: Alex C. Bwalya
Published by
Institute for Research in Construction National Research Council Canada Ottawa, Canada
Abstract
This report presents the results of an extended survey of combustible items in residential living rooms located on the main floor and basement levels. The survey was conducted using a web-based questionnaire. The objective of the survey was to enhance the validity of the results of an earlier pilot study by surveying a substantially larger number of homes across Canada.
The survey attracted 598 respondents and identifies the main types of combustible furniture. The types of furniture on the main floor and in basement living rooms were found to be similar, but basements contained a greater variety of furniture. The average fire load densities (410 MJ/m2 for main floor living rooms and 360 MJ/m2 for basement living rooms) calculated using estimated weights of furniture were within the range of the values found in the literature. There was no substantial difference in fire load density among the various housing categories.
Table of Contents
Abstract i
List of Figures ii
List of Tables ii
1 Introduction 1
2 The Survey Method 1
2.1 Questionnaire Structure 2
2.2 Weights and Combustion Data for Furniture 2
2.3 Key Assumptions 3
3 Results 3
3.1 Main Floor Living Rooms 5
3.2 Basements 10
4 Discussion of the Results 16
4.1 Comparison with the Results of the Pilot Survey 17
5 Conclusions 17
6 Future Work 18
7 Acknowledgments 18
8 References 18
Appendix A: Survey Questionnaire 19
Appendix B: Weight and Heat of Combustion Values 24
List of Figures
Figure 1. Housing categories... 4
Figure 2. Frequency distribution of living room floor areas for all the homes surveyed... 5
Figure 3. Floor finish in main floor living rooms ... 6
Figure 4. Window coverings ... 6
Figure 5. Number of typical types of furniture per 100 homes... 7
Figure 6. Frequency distribution of total number of furniture items shown in Figure 5. ... 8
Figure 7. Frequency distribution of total fire load in living rooms for all the homes ... 8
Figure 8. Variation of fire load density with a floor area... 9
Figure 9. Frequency distribution of fire load density for living rooms... 9
Figure 10. Frequency distribution of floor areas of basement living rooms ... 11
Figure 11. Basement ceiling finish... 12
Figure 12. Floor finish in basement living rooms ... 12
Figure 13. Furniture in basement living rooms ... 13
Figure 14. Frequency distribution of the total number of items shown in Error! Reference source not found.. ... 14
Figure 15. Frequency distribution of total fire load for basement living rooms ... 14
Figure 16. Frequency distribution of fire load density for all basement living rooms ... 15
Figure 17. Variation of fire load density with floor area... 16
List of Tables
Table 1. Average house size and living room areas (standard deviation given in brackets) ... 4Table 2. Mean fire load densities in main floor and basement living rooms (95thpercentile values given in brackets). ... 5
Table 3. Average number and area of windows ... 6
Table 4. Mean values of fire load and fire load density for the various homes (standard deviation given in brackets). ... 10 Table 5. Average values of basement living room floor area, number and area of windows. 11
Table 6. Mean values of fire load and fire load density for the various homes (standard deviation given in brackets). ... 15 Table 7. Combustibles found in main floor and basement living rooms ... 17
Abbreviations
MJ Mega joules
An Extended Survey of Combustible Contents in Canadian Residential Living
Rooms
by Alex Bwalya
1 Introduction
This report presents the results of a follow-up survey to an earlier survey of
combustible household furnishing in residential living rooms 1, which was conducted with a limited number of subjects. The earlier survey was essentially a pilot study and all of the 74 respondents were employees at the Institute for Research in Construction (IRC) at the National Research Council of Canada (NRC) in Ottawa. The follow-up survey reported here, was a much larger survey with 598 respondents from all of NRC’s institutes located in many provinces across Canada. As in the pilot survey, all of the participants in the extended survey were employees of NRC. The objective of the survey is to enhance the scientific validity of the results of the pilot study by surveying a substantially larger number of homes across Canada.
Information about the combustible contents and configuration of residential living room areas, in which many reported fatal fires originate, is needed in order to evaluate various aspects of fire safety in residential buildings. The quantity of movable
combustibles in a compartment is commonly expressed as the total heat energy (MJ) that can be released through complete combustion, and is known as the fire load. The fire load is often expressed as an energy density (fire load per unit floor area in MJ/m2) to enable extrapolation to compartments of different sizes. At times, the contribution of the
combustible parts of the building structure (the fixed fire load) is included in the total fire load. However, it is often the quantity of the building’s combustible contents (the movable fire load) that is needed in most fire safety evaluation calculations.
2
The Survey Method
Many published fire load surveys have been conducted by physically entering a building and listing the contents and their pertinent characteristics. This method is
laborious, time consuming and, at times, progress can be hampered by privacy concerns. In addition, the judgement of the characteristics of the combustibles is done largely
subjectively because it is impracticable to measure and determine precisely the material composition of every combustible item in the room.
This survey was conducted using a carefully-prepared Internet questionnaire in order to take advantage of the widespread use of Internet communication to survey a
larger number of households across a country than has ever been achieved in any survey. The obvious disadvantages of this method are that: a) much of the information obtained would be qualitative, b) the accuracy of any quantitative information cannot be easily verified, and c) many assumptions have to be made in order to quantify the combustibles. Despite these shortcomings, the pilot survey 1 showed that reasonably good results could be obtained.
The survey was primarily focused on combustible items found in living rooms, family rooms or recreation rooms located on either the main floor or basement level. In the context of this survey, the term ‘living room’ is used to refer to any of the aforementioned rooms.
2.1 Questionnaire Structure
The questionnaire had 64 questions. The author’s co-workers at the National Research Council of Canada (NRC) were selected for the pilot survey because of the ease of distributing the questionnaire. Admittedly, a sample selected this way may not be representative of the general population as lower income and rural homes are probably under-represented
The request for participants was sent out by e-mail. A hyperlink to the web page for the questionnaire was included in the e-mail. Respondents followed the hyperlink to complete the questionnaire and upon completion, their anonymous numerical responses were stored on a web server and could be retrieved for analysis at any time.
The questionnaire had a predetermined list of household items, which are commonly found in living rooms. Drop-down boxes were placed beside each item, from which quantities, sizes, materials and other pertinent attributes could be selected. In addition, there were questions about the type and size of the home, the number of exits, and the number of windows in a specified living room. The full questionnaire is provided in Appendix A.
2.2 Weights and Combustion Data for Furniture
Where possible, published data on heat of combustion 2-4 were used in the calculation of the fire loads. Weights, dimensions and the composition of representative furniture items were obtained from the manufacturers and local shops. From the
information collected, low, medium and high values of weight were determined for each furniture item. The weights and heats of combustion used in the calculation of the fire loads are shown in Appendix B.
2.3 Key Assumptions
2.3.1 Electronic Equipment and Carpeting
Electronic equipment, such as television (TV) sets and computers was assumed to consist of a 20 % combustible mass (mainly the plastic casing). Carpeting and area rugs were included in the calculation of the fire load. Carpeting (including the padding
underneath it) was assumed to cover the entire floor, whereas area rugs were assumed to cover 80 % of the floor area.
2.3.2 Calculation of the Fire Load
A high value of fire load that can be foreseen during the life span of a building is generally used in a fire safety evaluation so as to arrive at what is commonly known as a worst-case fire scenario. Consistent with this approach, the fire loads in the pilot survey were calculated using the highest values of weight and heat of combustion found for each grouping of furniture given in Appendix B. To ensure conformity with many published surveys, in which the average values of fire load density are given and the worst-case scenario is obtained with the 95th percentile value, a different approach was adopted in this survey – it was assumed that in reality, the weight and heat combustion of furnishings in a living room occur randomly. Therefore, the selection of weight and heat of combustion values, for every combustible item, that are multiplied together to obtain the fire load, were selected randomly (using a numerical algorithm) from among the three levels (low,
medium and high) for each of the two variables (weight and heat of combustion). 2.3.3 Miscellaneous Combustibles
There were no questions asked about miscellaneous combustible items, such as video and audio tapes, compact disc media and their storage cases and paper and plastic materials that may have been in the room. These were accounted for by increasing the calculated fire load values by 5%.
3 Results
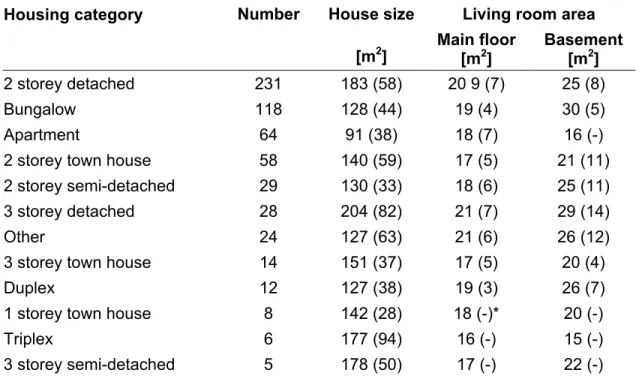
The number of completed questionnaires received was 598. A breakdown of the types of homes found in the survey is shown in Figure 1. Table 1 gives the additional information on sizes of the homes and the living rooms. The largest proportion (38 %) of the homes was two-storey single-family detached homes.
Table 1. Average house size and living room areas (standard deviation given in brackets)
Housing category Number House size Living room area [m2] Main floor [m2] Basement [m2] 2 storey detached 231 183 (58) 20 9 (7) 25 (8) Bungalow 118 128 (44) 19 (4) 30 (5) Apartment 64 91 (38) 18 (7) 16 (-)
2 storey town house 58 140 (59) 17 (5) 21 (11)
2 storey semi-detached 29 130 (33) 18 (6) 25 (11)
3 storey detached 28 204 (82) 21 (7) 29 (14)
Other 24 127 (63) 21 (6) 26 (12)
3 storey town house 14 151 (37) 17 (5) 20 (4)
Duplex 12 127 (38) 19 (3) 26 (7)
1 storey town house 8 142 (28) 18 (-)* 20 (-)
Triplex 6 177 (94) 16 (-) 15 (-)
3 storey semi-detached 5 178 (50) 17 (-) 22 (-)
* not calculated for fewer than 10 samples.
Other 7% Bungalow 20% 2 storey townhouse 10% Apartment 11% 3 storey townhouse 2% 3 storey detached 5% 2 storey semi-detached 5% Duplex 2% 2 storey detached 38%
Figure 1. Housing categories
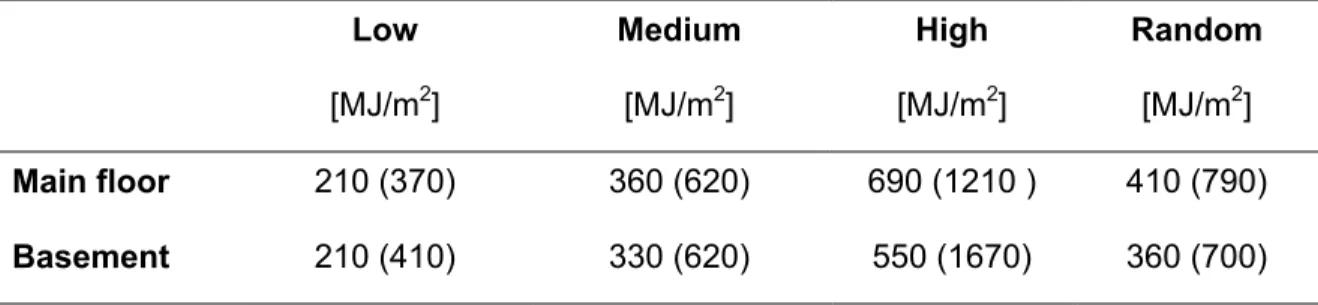
The average fire load densities for all the homes are listed in Table 2 for four different calculation methods. The low values are calculated using the low values of weight and heat of combustion, moderate using medium values and high using the highest values given in Appendix B. The random values are calculated using randomly selected values of weight and heat of combustion. These are considered to be impartial and,
therefore, all the fire load values that will be present later will be calculated likewise. The randomly calculated values are close to the average of the low, medium and high values.
Table 2. Mean fire load densities in main floor and basement living rooms (95thpercentile values given in brackets).
Low [MJ/m2] Medium [MJ/m2] High [MJ/m2] Random [MJ/m2] Main floor 210 (370) 360 (620) 690 (1210 ) 410 (790) Basement 210 (410) 330 (620) 550 (1670) 360 (700)
3.1 Main Floor Living Rooms
Figure 2 shows the distribution of floor areas for all the homes in the survey. The average floor was 21 m2 and the standard deviation was 8 m2.
Floor area (m2)
0 5 10 15 20 25 30 35 40 45 50 55 60Fr
equency
0 20 40 60 80 100 120 140 160 180 200 Mean: 21 m2 Standard deviation: 8 m2Figure 2. Frequency distribution of living room floor areas for all the homes surveyed.
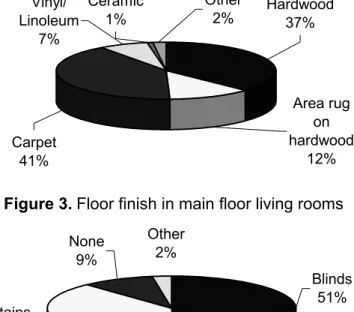
3.1.1 Floor Finish and Window Coverings
The types of floor finish and window coverings found in the survey are shown in Figures 3 and 4, respectively. Hardwood flooring (including the cases with area rugs) is
the most popular floor finish followed by carpeting. Blinds are the most popular window coverings followed by curtains.
Hardwood 37% Area rug on hardwood 12% Carpet 41% Vinyl/ Linoleum 7% Other 2% Ceramic 1%
Figure 3.Floor finish in main floor living rooms
Other 2% Blinds 51% None 9% Curtains 38%
Figure 4. Window coverings
Table 3 shows the average number and size of windows for different types of homes. The typical number of windows per living room is two and the area of the largest window is greater than 2 m2.
Table 3. Average number and area of windows
Housing category Room area (m2) Number of windows Area of largest window (m2) Number of samples 2 storey detached 20 2 2.6 231 Bungalow 19 2 2.9 118 Apartment 18 2 3.1 64
2 storey town home 17 2 2.2 58
2 storey semi-detached 18 2 2.6 29
3 storey detached 21 2 2.2 28
3 storey town home 17 2 2.2 14
3.1.2 Combustible Contents
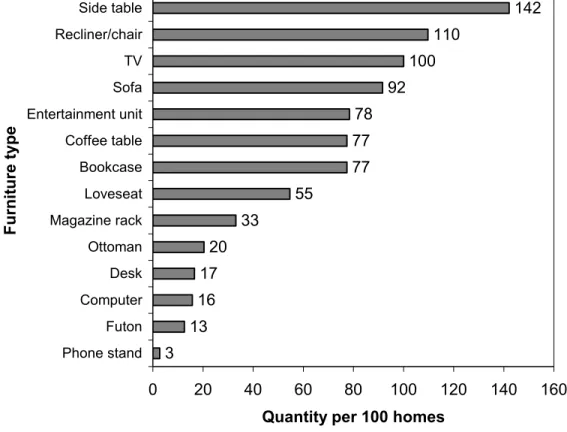
Figure 5 shows the total quantity of each type of furniture found per 100 homes in ascending order. The average percent of floor area covered by the furnishings is 29 %. Of the listed furniture, upholstered furniture possesses the greatest fire hazard since it is capable of bringing about untenable conditions and, possibly, flashover on its own. The wood-based furniture items have a slow burning rate and their main effect would be to extend the duration of burning.
3 13 16 17 20 33 55 77 77 78 92 100 110 142 0 20 40 60 80 100 120 140 160 Phone stand Futon Computer Desk Ottoman Magazine rack Loveseat Bookcase Coffee table Entertainment unit Sofa TV Recliner/chair Side table Furniture type
Quantity per 100 homes
Figure 5. Number of typical types of furniture per 100 homes
Figure 6 shows the frequency distribution of the total number of individual items per dwelling shown in Figure 5. It can be inferred, from Figure 6, that typical living rooms contain four to eight of the items listed in Figure 5. These items typically include a TV and at least one of the furniture combinations listed in Appendix C. There is clearly no one typical living room layout. However, the typical contents could be considered to be items found in quantities greater than 40 per 100 homes. These are: sofa, loveseat,
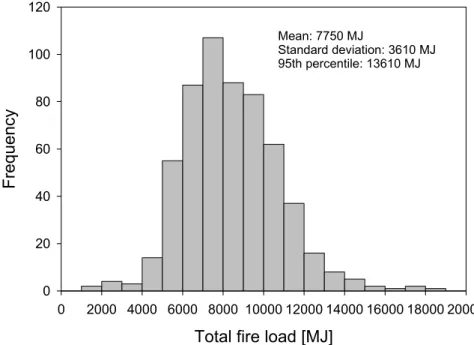
Figure 7 shows the frequency distribution of the total fire load for all of the homes, which has a positively skewed with a mean of 7750 MJ and a standard deviation of 3610 MJ.
Number of items of furniture
0 2 4 6 8 10 12 14 F requ ency 0 20 40 60 80 100 120 140 160 Sample size: 598 Mean: 6 items
Standard deviation: 2 items 95th percentile: 10 items
Figure 6. Frequency distribution of total number of furniture items shown in Figure 5.
Total fire load [MJ]
0 2000 4000 6000 8000 10000 12000 14000 16000 18000 20000 F requ en cy 0 20 40 60 80 100 120 Mean: 7750 MJ Standard deviation: 3610 MJ 95th percentile: 13610 MJ
Floor area [m2]
0 5 10 15 20 25 30 35 40 45
Fire load density
[MJ/m 2 ] 0 200 400 600 800 1000 1200 1400 1600 1800 2000 Sample size: 598 Mean floor area: 21 m2
Mean fire load density: 410 MJ/m2
Figure 8. Variation of fire load density with a floor area
Figure 8 shows the variation of fire load density with the floor area. The fire load density generally decreases with an increasing floor area. This is because typical furnishings in large and small living rooms are similar.
Fire load density (MJ/m2)
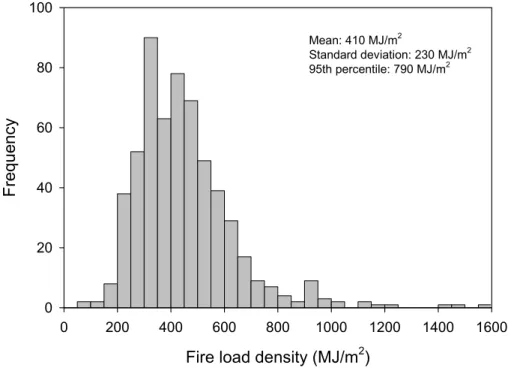
0 200 400 600 800 1000 1200 1400 1600 Freque ncy 0 20 40 60 80 100 Mean: 410 MJ/m2 Standard deviation: 230 MJ/m2 95th percentile: 790 MJ/m2
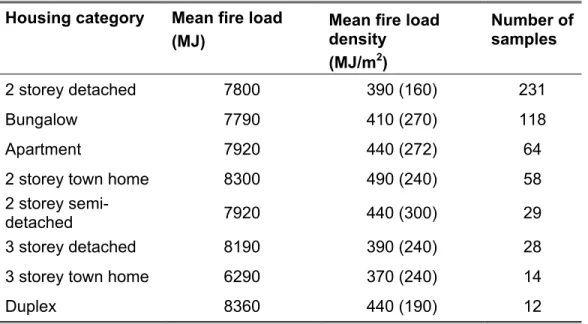
Table 4 lists the average fire load density for each type of home. The distribution of fire load density shown in Figure 9 is positively skewed due to the influence of the floor area (Figure 2). Apart from the two-storey town homes, which have an average fire load density of 490 MJ/m2, most of the homes have values around 400 MJ/m2.
Table 4. Mean values of fire load and fire load density for the various homes (standard
deviation given in brackets).
Housing category Mean fire load (MJ)
Mean fire load density (MJ/m2) Number of samples 2 storey detached 7800 390 (160) 231 Bungalow 7790 410 (270) 118 Apartment 7920 440 (272) 64
2 storey town home 8300 490 (240) 58
2 storey
semi-detached 7920 440 (300) 29
3 storey detached 8190 390 (240) 28
3 storey town home 6290 370 (240) 14
Duplex 8360 440 (190) 12
3.2 Basements
The floor areas of living rooms in basements were found to vary widely, as can be seen in Figure 10, and some of the values above 45 m2 do not appear to be realistic. Excluding these values would not have a significant effect on the mean and standard deviation since they are fewer than 10 % of the sample. However, the dispersion would be reduced considerably.
Table 5 shows the average values of the living room floor area, and the number and area of windows for different types of homes. All of the homes listed in Table 5 had basements.
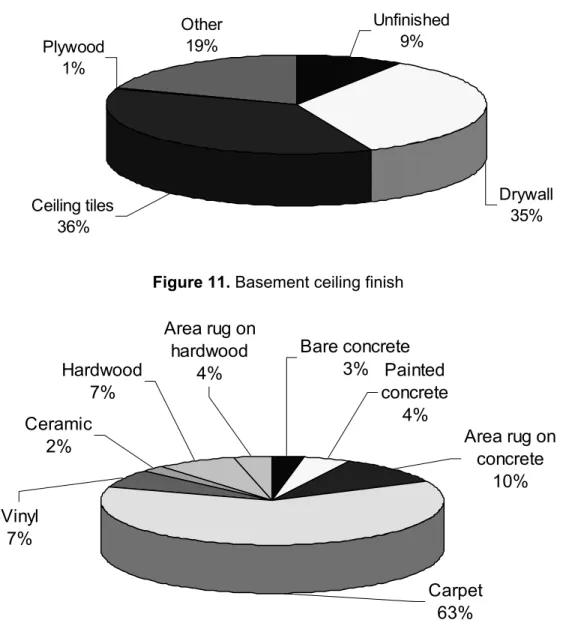
Sixty percent of the 529 homes that had basements had a finished portion of the basement being used as a living room and sixty percent of these had a door on the main floor leading to the basement. The state of the ceiling in the basements is shown in Figure 11 and the flooring materials are shown in Figure 12.
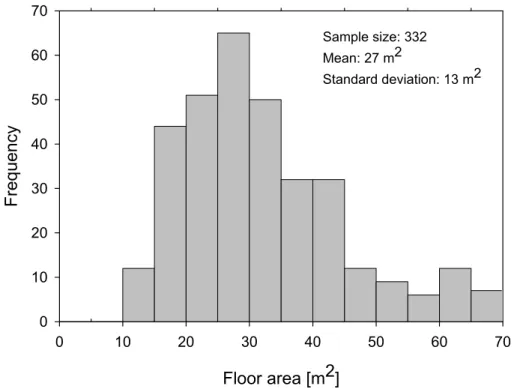
Floor area [m2] 0 10 20 30 40 50 60 70 Fre que ncy 0 10 20 30 40 50 60 70 Sample size: 332 Mean: 27 m2 Standard deviation: 13 m2
Figure 10. Frequency distribution of floor areas of basement living rooms
Table 5. Average values of basement living room floor area, number and area of windows.
Housing category Room area (m2) Number of windows Area of largest window (m2) Number of samples Number with living room 2 storey detached 25 3 0.7 231 140 Bungalow 30 4 0.6 118 89 2 storey town home 21 2 0.7 58 35 2 storey semi-detached 25 2 0.6 29 16 3 storey detached 29 3 0.8 28 14 Duplex 26 3 0.6 12 6 3 storey town home 20 2 0.4 14 4
Unfinished 9% Drywall 35% Ceiling tiles 36% Plywood 1% Other 19%
Figure 11. Basement ceiling finish
Carpet
63%
Vinyl
7%
Area rug on
concrete
10%
Painted
concrete
4%
Bare concrete
3%
Ceramic
2%
Hardwood
7%
Area rug on
hardwood
4%
Figure 12. Floor finish in basement living rooms
3.2.1 Combustible Contents
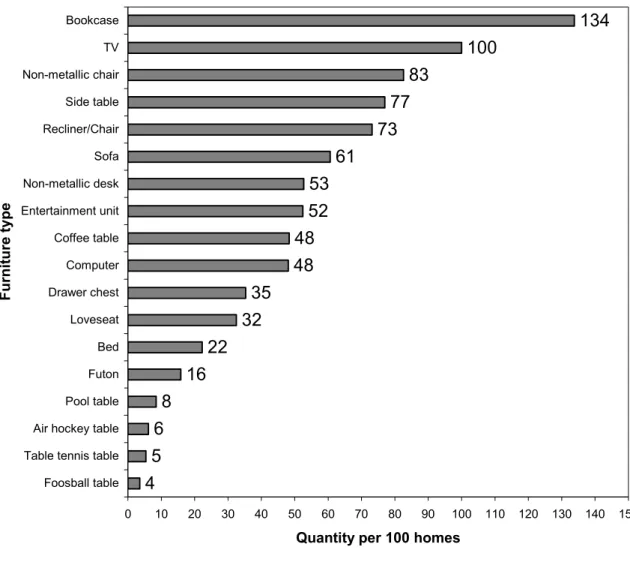
Figure 13 shows the quantities of each type of furniture found in basement living rooms in ascending order. Most of the furniture was also found in main floor living rooms. Figure 14 shows that most basement living rooms contain between four and 16 items of furniture. The average percent of floor area covered by the furnishings is 22 %.
4
5
6
8
16
22
32
35
48
48
52
53
61
73
77
83
100
134
0 10 20 30 40 50 60 70 80 90 100 110 120 130 140 150 Foosball table Table tennis table Air hockey table Pool table Futon Bed Loveseat Drawer chest Computer Coffee table Entertainment unit Non-metallic desk Sofa Recliner/Chair Side table Non-metallic chair TV Bookcase Furniture typeQuantity per 100 homes
Figure 13. Furniture in basement living rooms
A typical basement contains items found in quantities greater than 40 per 100 homes. These are: a sofa, bookcase, entertainment unit, recliner/chair, loveseat, drawer chest, desk, coffee table, side table, light chair, TV and computer.
The frequency distribution of the total fire load is shown in Figure 15 and the fire load density distribution is shown in Figure 16. The total fire loads are comparable with the values for main floor living rooms, but the mean fire load density is a little less in basements because the average floor area is greater than that for main floor living rooms.
Number of items of furniture 0 2 4 6 8 10 12 14 16 18 20 22 24 26 Freque ncy 0 10 20 30 40 50 60 70 Sample size: 332 Mean: 9 items
Standard deviation: 4 items 95th percentile: 16 items
Figure 14. Frequency distribution of the total number of items shown in Figure 13.
Total fire load [MJ]
0 2000 4000 6000 8000 10000 12000 14000 16000 18000 20000 F req uency 0 10 20 30 40 50 Sample size: 332 Mean: 8400 MJ Standard deviation:3700 MJ 95th percentile:14900 MJ
Fire load density [MJ/m2] 0 200 400 600 800 1000 1200 1400 1600 Freq ue ncy 0 5 10 15 20 25 30 35 40 45 50 55 Number of homes: 332 Mean: 360 MJ/m2 Standard deviation: 200 MJ/m2 95th percentile: 700 MJ/m2
Figure 16. Frequency distribution of fire load density for all basement living rooms
Table 6 lists the average fire load density for each type of home. The distribution of fire load density shown in Figure 16 is positively skewed due to the influence of the floor area (Figure 10), as was found in the case of main-floor living rooms.
Table 6. Mean values of fire load and fire load density for the various homes (standard
deviation given in brackets).
Housing category
Mean fire load (MJ)
Mean fire load density (MJ/m2) Number of samples 2 storey detached 8500 340 (190) 140 Bungalow 10200 350 (210) 89
2 storey town home 8610 410 (260) 35
2 storey
semi-detached 10750 430 (240) 16
3 storey detached 10150 350 (230) 14
Duplex 8060 310 (140) 6
Figure 17 shows the variation of fire load density with floor area. The trend of decreasing fire load density with an increasing floor area that was seen in main-floor living room is repeated here.
Floor area [m2]
0 5 10 15 20 25 30 35 40 45 50 55 60 65
Fire load density
[MJ/m 2 ] 0 200 400 600 800 1000 1200 Sample size: 332 Mean floor area: 27 m2
Mean fire load density: 360 MJ/m2
Figure 17. Variation of fire load density with floor area
4
Discussion of the Results
Many published fire load surveys have shown that fire loads in houses vary greatly, even within the same geographical location5-8. The values obtained in the current survey are slightly lower than those reported in the literature for the US 78 for detached single family homes. In a survey of single-family detached homes, mean fire load densities for main floor and basement living rooms were reported to be 500 MJ/m2 and 450 MJ/m2, respectively. The average floor areas were about 20 m2 for main floor living rooms and 32 m2 for basement rooms. In this survey the values for single-family detached homes are 400 MJ/m2 for main floor living rooms and 350 MJ/m2 for basement rooms. The floor areas compare very well with the one found in this survey - 21 m2 for main floor living rooms and 28 m2 for basement rooms.
The values of the total fire load presented in this report are speculative to the
extent that the actual weights and material composition of the combustibles are not known. However, these values are reasonable as they are based on realistic weight and heat of combustion values.
The main combustibles in main floor and basement living rooms found in this study are listed in Table 7.
Table 7. Major combustibles found in main floor and basement living rooms
Living room location Type of furniture
Main floor and
Basement
Upholstered furniture (sofa, loveseat, recliner/chair, ottoman, futon, light-framed chair)
Other furniture (telephone stand, magazine rack, side table, coffee table, desk, bookcase, entertainment unit)
Electronic equipment (TV and computer)
Basement only
Bedroom type furniture (bed, drawer chest)
Other recreational related items (pool table, table tennis table, foosball table)
4.1 Comparison with the Results of the Pilot Survey
The qualitative information obtained in this survey is consistent with that from the pilot survey. However, the calculated values of the total fire load and fire load density are lower than the ones reported in the pilot survey because of the differences in the methods used to calculate the values. If the values are recalculated for the pilot survey using the method adopted in this survey, average values of 390 MJ/m2 for main floor living rooms and 360 MJ/m2 for basement living rooms are obtained. These values are consistent with the ones obtained in this survey.
5 Conclusions
This survey has succeeded in collecting information about the combustible contents in residential living from a large number of homes across Canada, and thereby enhancing the validity of the derived results. The average fire load densities of 410 MJ/m2 for main floor living rooms and 360 MJ/m2 for basement rooms, which have been
calculated using random combinations of weight and heat of combustion values, are believed to be fair values.
The fire loads in basement and main floor living rooms are similar. However, basements may contain a greater variety of furniture than main floor living rooms. A
significant finding of the survey is that the quantity of combustibles in the various housing categories is not substantially different.
6 Future
Work
An experimental project involving small- to large-scale experiments is being planned to determine the combustion characteristics of typical household furnishings identified in the survey, individually in an open calorimeter and collectively in realistically furnished rooms. The key variables that characterize fires, which would be determined from the experiments, are: heat release rate, temperature, radiant heat flux and fire effluent (smoke, soot and gas species such as carbon dioxide, carbon monoxide and hydrogen cyanide). The results from this survey would be used to decide the fire load densities, furnishings and room configurations to be used in the experiments. The results from the experimental study would form the basis for developing computational models for fire characteristics (also known as design fires) in residential buildings, which can be used for the purpose of evaluating many aspects of fire safety in a residential building.
7 Acknowledgments
The author sincerely thanks all the participants from NRC for making this study possible. Irene Reid, Guylène Proulx and Abderrazzaq Bounagui are kindly acknowledged for their invaluable help with this study.
8 References
1. Bwalya, A. C., Sultan, M. A., and Bénichou, N., “A Pilot Survey of Fire Loads in Canadian Homes”, Research Report no. 159, Institute for Research in
Construction, National Research Council Canada, Ottawa, Ontario, Canada, March 2004.
2. Babrauskas, V., Lawson, R. J., Walton , W. D., and Twilley, W. H., “Upholstered Furniture Heat Release Rates Measured with a Furniture Calorimeter”, US Dept of Commerce, Centre for Fire Research, National Bureau of Standards, NBSIR 82-2604, USA. 1982.
3. Sundström, B. (ed.), “Fire Safety of Upholstered Furniture - The Final Report of the CBUF Research Programme”, Report EUR 16477 EN, Directorate-General Science, Research and Development (Measurements and Testing), European Commission, Interscience Communications Ltd, London, 1995.
4. Sardqvist, S., “Initial Fires: RHR, Smoke Production and CO Generation from Single Items and Room Fire Tests”, ISRN LUTVDG/TVBB-3070-SE, Department of Fire Safety Engineering, Lund University, Lund, Sweden, 1993.
5. Yii, H. W. J., "Effect of Surface Area and Thickness on Fire Loads", University of Canterbury Research Report, New Zealand, (00/13), March 2000.
6. Kose, S., Morishita, Y., Hagiwara, I., and Tsukagoshi, I., "Survey of Movable Fire Load in Japanese Dwellings", Fire Safety Science-Proceedings of the Second International Symposium, 1988, pp. 403-412.
7. Fang, J. B. and Breese, J. N., “Fire development in residential basement rooms”, US Dept of Commerce, Centre for Fire Research, National Bureau of Standards, USA, October 1980.
8. Issen, L. A., “Single-Family Residential Fire and Live Loads Survey”, US Dept of Commerce, Centre for Fire Research, National Bureau of Standards, USA, December 1980.
Appendix A:
Survey Questionnaire
GENERAL:
1. Type of home
--Select--2. Approximate square footage of home (excluding basement)
--Select--3. What is the approximate area of the exit corridor from the bedroom area?
--Select--4. Please specify the number of exits from the main level of your home.
--Select--5. Where are the stairs to the second floor located? (Answer only if applicable) -
--Select--MAIN FLOOR LIVING SPACE:
6. Which room (living room/family room) on your main floor do you use most often? (For
some homes this could be on the second floor.)
--Select--The next 10 questions are about the room, which you have selected in the previous
question.
7. Room dimensions (Length (L), Width (W)):
L: --Select--
W: --Select--
8. Number of windows
--Select--9. Size of largest window. (Width (W), Length (L))
W: --Select-- H: --Select--
10. Window coverings
--Select--11. Floor finish
--Select--12. Wall finish
3 seat sofa(s)
0Loveseat(s)
0Recliner(s)/one seat
upholstered chair(s)
0futon(s)
0Side table(s)
0Coffee table(s)
0Computer(s)
0Non-metallic desks
0Wooden entertainment unit
0
Ottoman(s)
0Magazine table/rack
0Telephone stand(s)
014. Bookshelves
Quantity
--Select--Average size
--Select--15. Size of television
--Select--16. Type of fireplace
--Select--BASEMENT:The remainder of the questions are about your basement. (If you do not have a basement please scroll down to the end and click on "Submit Survey")
17. Is there a door on the stairs leading to the basement?
--Select--18. What percentage of your basement is finished?
--Select--19. Number of windows
--Select--20. Size of largest window.
W: --Select--
H: --Select--
21. If you have the following rooms in your basement, please select 'Yes'.
Recreational area
Yes NoOffice
Yes NoBedroom
Yes NoThe remainder of the questions will now focus on the recreational space/family
room in your basement. (If you do not have a recreational space/family room in
your basement or if your basement is unfinished, then scroll down to the end and
click on "Submit Survey")
22. Room dimensions:
L: --Select-- W: --Select--23. Window coverings
--Select--24. Floor finish
--Select--25. Wall finish
--Select--26. Ceiling finish
--Select--27. Please specify the quantity of the following items in the recreational
space/family room:
3 seat sofa(s)
0Loveseat(s)
0Recliner(s)/one seat
upholstered chair(s)
0Futon(s)
0Side table(s)
0Coffee table(s)
0Computer(s)
0Non-metallic computer
tables/desks
0Wooden entertainment unit
0
Chest of drawers
0
Non-metallic chairs
0
Air hockey table
0
Pool table
0
Foosball table
0
Table tennis table
0
28. Bookshelves
Quantity
--Select--Average size
--Select--29. Type of bed
--Select--30. Size of television
--Select--31. Type of fireplace
Submit Survey
Appendix B:
Weight and Heat of Combustion Values
Table B-1. Weight and heat of combustion values
Weight (kg)
Heat of combustion (MJ/kg) Item Description
Low Medium High Low Medium High
1 Three-seat sofa 46 65 91 15 18 33 2 Loveseat 38 48 60 15 18 33 3 Recliner/chair 27 41 53 15 18 33 4 Futon 44 51 57 15 18 33 5 Side table 6 16 26 16 18 20 6 Coffee table 9 24 32 16 18 20 7 Computer 23 30 40 18 20 22 8 Computer desk 19 43 56 16 18 20
9 Entertainment unit / TV stand 21 67 130 16 18 20
10 Ottoman 32 35 40 16 18 20 11 Magazine table/rack 6 11 15 16 18 20 12 Telephone stand 6 11 15 16 18 20 13 Bookcase 10 30 48 16 18 20 14 TV: <13” 11 12 13 23 25 27 15 TV: 14” – 20" 22 26 31 23 25 27 16 TV: 21” – 26" 41 50 55 23 25 27 17 TV: 27" 41 50 55 23 25 27 18 TV: 28” – 36" 53 67 80 23 25 27 19 TV: >37" 72 95 128 23 25 27 20 Drawer chest 31 53 80 18 18 20
21 Light chair/computer chair 6 12 16 23 25 27
22 Mattress and box-spring (double) 61 68 73 20 22 24
23 Air hockey table 26 30 34 16 18 20
24 Foosball table 26 30 34 16 18 20
25 Table tennis table 47 50 53 16 18 20
26 Night table 14 22 27 16 18 20
Appendix C:
Furniture Arrangements
TableC-1. Some layouts of furniture found in main floor living rooms.
# Furniture Arrangement Number of homes % (of total sample) Fire load density1 [MJ/m2] 1 TV (any size) 480 80 10 2 Sofa/chair 355 60 95 3 Sofa/loveseat 200 33 100 4 Loveseat/chair 169 28 80 5 Sofa/loveseat/entertainment unit 139 23 160 6 Sofas/two chairs 142 23 130 7 Sofa/loveseat/chair 117 20 140 8 Sofa/loveseat/bookcase 84 14 160
9 Sofa/loveseat/chair/coffee table/side table 76 13 190
10 Sofa/loveseat/chair/coffee table/entertainment unit 59 10 220 11 Two sofas/loveseat 54 10 160 12 Two sofas/chair 46 8 150 13 Sofa/loveseat/chair/coffee table/entertainment unit/bookcase 22 4 310 14 Two sofas/loveseat/chair 8 1 200