HAL Id: halshs-01676756
https://halshs.archives-ouvertes.fr/halshs-01676756
Submitted on 26 Sep 2018HAL is a multi-disciplinary open access archive for the deposit and dissemination of sci-entific research documents, whether they are pub-lished or not. The documents may come from teaching and research institutions in France or abroad, or from public or private research centers.
L’archive ouverte pluridisciplinaire HAL, est destinée au dépôt et à la diffusion de documents scientifiques de niveau recherche, publiés ou non, émanant des établissements d’enseignement et de recherche français ou étrangers, des laboratoires publics ou privés.
Maritime networks as systems of cities: The long-term
interdependencies between global shipping flows and
urban development (1890–2010)
César Ducruet, Sylvain Cuyala, Ali El Hosni
To cite this version:
César Ducruet, Sylvain Cuyala, Ali El Hosni. Maritime networks as systems of cities: The long-term interdependencies between global shipping flows and urban development (1890–2010). Journal of Transport Geography, Elsevier, 2018, 2018, pp.340-355. �10.1016/j.jtrangeo.2017.10.019�. �halshs-01676756�
Maritime networks as systems of cities: the long-term
interdependencies between global shipping flows and urban
development (1890-2010)
This article is the pre-final version of the work published in Journal of Transport Geography, Vol. 66, pp. 340-355. César Ducruet1, PhD Email : cdu@parisgeo.cnrs.fr Sylvain Cuyala, PhD Email : sylvain.cuyala@gmail.com Ali El Hosni, Msc Email : elhosni_ali@yahoo.fr Abstract
This article is the first-ever analysis of cities in relation to maritime transport flows from a relational, or network, perspective. Based on untapped vessel movement data covering the last 120 years, this articles sheds new light about the interdependencies at stake between urban hierarchies and port hierarchies overtime. Main results point to the fading correlation between traffic volume, port centrality, and city size, while the largest cities have maintained their prominence in the global maritime network despite contemporary spatial and functional changes affecting the distribution of transport systems and commodity chains. Such findings help better understanding not only the spatial and functional evolution of port-city relationships and maritime transport; they also confirm the importance of taking into account the long-term dynamics and socio-economic embedding of spatial networks in geography and other disciplines.
Keywords: Graph theory; Maritime transport; Port-city relationships; Spatial network; System of cities; Urban development
Acknowledgements
The research leading to these results has received funding from the European Research Council under the European Union's Seventh Framework Programme (FP/2007-2013) / ERC Grant Agreement n. [313847] "World Seastems".
1 Corresponding author. French National Centre for Scientific Research (CNRS), UMR 8504 Géographie-cités
1. Introduction
Social sciences and humanities witnessed a growing emphasis for material flows, after decades of devotion to immaterial flows connecting people and places (O’Connor, 2010; Hall and Hesse, 2012; Kennedy et al., 2015; Urry et al., 2015). Maritime transport is one of the oldest forms of interaction across the Earth, and still supports more than 90% of international trade volumes nowadays. Despite its pioneering role in mapping maritime routes and flows since the 1940s, human geography later shifted its central focus towards land-based issues and people mobility. In parallel, ports and maritime transport increased their efficiency at the expense of their ties with cities and regions. The analysis of untapped maritime data in an urban context concludes to the permanency of strong port-city interdependencies, while it underlines the specific character of maritime transport as a looking glass and vital element of urban development.
Across the vast array of urban studies in economic geography and elsewhere, the urban network or “system of cities” has been the focus of numerous schools of thought, but without a clear definition of its functions and properties (Peris, 2016). How and why cities connect each other through various communication networks is thus another level of complexity. Despite its crucial role for trade and economic development (Bernhofen et al., 2013) and the growing concentration of world population along coastlines (Noin, 2000), maritime transport had not been studied yet from an urban network perspective. The Hanseatic League and the Italian and Asian city-states are classic examples of such systems, but a quantitative analysis of cities connected through shipping flows remains missing in economic geography. The well-known work of Braudel (1979) on major (maritime) cities being centers of functional world regions supported the idea that seas and oceans facilitate rather than constrain human interactions (Lewis and Wigen, 1999). Numerous monographs and models on ports, port cities, and maritime networks cannot remedy such a deficiency.
Maritime trade, and especially container shipping, went through faster growth than world GDP, exports, or population since the 1970s (Rodrigue et al., 2017), with important spatial and governance effects. Yet, cities and commodity flows are still interdependent today (Hall and Hesse, 2012), just like seaports and urban areas continue to share important mutual relationships at the local level (Hesse, 2013, 2017). Immaterial or virtual flows as well as other transport modes cannot replace the gigantic quantities of products carried by ships across the globe. A
number of so-called global cities like Paris, London, Taipei, and Jakarta are currently reinforcing their port functions through huge investments in new container terminals near the urban core (El Hosni, 2017).
This paper has three main ambitions. First, we would like to fill the gap between two separate worlds, namely urban network research and maritime network research, which would benefit from a unified theoretical or empirical background. Second, we provide the first-ever empirical analysis of 120 years of global maritime flows in relation with urban development. This analysis addresses the degree to which urban and port hierarchies are interdependent, and investigates the changing influence of city sizes on the nature and intensity of maritime interactions. Such a long time-span is rather rare in urban and network studies, especially in the field of complex and spatial networks that increasingly seek to understand dynamic graphs. Lastly and thirdly, confronting maritime flows to both city and network is expected to improve our understanding of this particular industry, and how its spatial evolution and connectivity differ from other types of interactions.
The remainders of the paper are as follows. The next section introduces the theoretical background on cities and communication networks in economic geography and various disciplines. The third section presents the data and methodology allowing a new analysis of the interdependencies between urban development and maritime flows, based on untapped historical shipping records. The core of the paper lies in the fourth section where the application of several network analytical tools to the temporal matrix of interurban maritime flows reveals a number of trends and invariants. The conclusion discusses the contribution of this research to both urban, network, and maritime studies.
2. Theoretical background: Urban networks in economic geography and beyond
The concepts of “systems of cities” and “urban networks” have long been discussed in geography and beyond. The review of this field by Peris (2016) underlined the existence of numerous self-proclaimed schools of thought and paradigms since the 1950s to nowadays. However, these approaches are often characterized by a rarity of theoretical explanations, and a wide diversity of definitions of the same object. This section is an attempt to recall and synthesize the main messages of such studies, without pretending to be exhaustive.
2.1 From the “First Science of Cities” to the “new paradigms”
The concept of urban network or system of cities dates back to the work of Jean Reynaud in the 1840s (see Robic, 1982), later formalized by Christaller (1933) in his central place theory, which defined regularities shaping urban hierarchies at different spatial scales. The First Science of Cities of the 1950s-1970s (Berry and Wheeler, 2014), combining the Anglo-Saxon and Swedish schools (Figure 1), shifted the focus from urban morphology and internal structure to inter-urban patterns. According to such a horizontal approach (or New Geography), systems of cities necessitate complementarity, economic opportunity, and distance (Ullman, 1954; Berry, 1964), with the main hypothesis that changes in economic activities, professional structure, wages, and population in one city will affect others (Pred, 1977). These schools had in common to maintain a close link with regional planning issues, to produce numerous empirical studies of various types of flow matrices (e.g. phone calls, migrations, airlines), with reference to graph theory in the U.S. (Nystuen and Dacey, 1961; Tornqvist, 1968) or to the hierarchical diffusion of innovations (Hägerstrand, 1953; Pred, 1973). Hierarchical tendencies dominated notwithstanding the possibility for transversal linkages to emerge.
[Insert Figure 1 about here]
Until the early 1980s, a consensus existed about the system of cities concept, backed by numerous empirical studies based on population and socio-economic indicators. From such a core theory, different schools emerged. In France, the U.S. influence gained ground and led to a number of analyses at the national level investigating the relationship between hierarchy and specialization (Pumain et al., 1989). It also linked the urban network concept with synergetics (Sanders, 1992), evolution theory (Pumain, 1997), and provided empirical applications with reference to co-evolution (Paulus, 2004), space-time contraction, hierarchical diffusion, with an increasing use of simulation and agent-based models over long time-periods, the population of urban centers and their employment structure being the main empirical material. Although the New Science of Cities’ main focus had been the intra-urban spatial organization, the Centre for Advanced Spatial Analysis (CASA) in U.K. concentrated its efforts on the micro-level of agents from a more bottom-up perspective by which fractal structures emerge (Batty and Longley, 1994) with no “hidden hand” (Xie, 1996), with a similar taste for cellular automata and simulation. A third school focused on polycentric and reticular organizations, with a strong reference to the work of Gottmann (1961) on the megalopolis, particularly investigated the
emergence of districts and clusters, based on the city network paradigm (Capello, 2000) and centered around the firm (Camagni and Salone, 1993). They particularly underlined the growth of distance for information exchanges, the multiple location of service firms, exploring key notions of which complementarity, vertical integration, synergy, arguing that connectivity had a stronger influence than size in urban networks (see Pflieger and Rozenblat, 2010).
In the meantime, two other schools developed their own vision of the urban network. The Globalization and World City (GaWC) Study Group and Network emerged in the early 2000s, mainly based on the theoretical approaches of Friedmann (1986) and Sassen (1991) about the so-called global city and on the space of flows (Castells, 1996). Numerous empirical analyses of the co-location of Advanced Producer Services (APS) in global cities were provided through the benchmarking method of interlocking network model consisting in ranking cities according to their composite connectivity score in such networks. This approach is also a critique to the central place theory bound to the urban/rural nexus, with a preference to the central flow theory (Taylor et al., 2010) promoting international versus local linkages. The World City Network had been studied in such ways, also with reference to complementary concepts such as Global Production Networks and Global Value or Commodity Chains (Coe et al., 2004; Gereffi and Korzeniewicz, 1994; Derudder and Witlox, 2010). A radically different approach came out with the New Economic Geography (NEG) based on the pioneering article by Krugman (1990), arguing that space matters in the location of firms. Related works especially investigated micro-economic theory to demonstrate the emergence of urban hierarchies and core-periphery patterns through the action of rational agents in a context of free market, cities connecting beyond national boundaries (Fujita et al., 1999). A plethora of related empirical applications, as in regional science (Reggiani, 2017), put transport costs at the core of the analysis of mainly road networks between cities (see Duranton et al., 2014). Lastly, the Evolutionary Economic Geography school considered a variety of networks (i.e. knowledge, innovation, alliance, stakeholder, etc.) but mainly at the micro-level of specific localities such as economic clusters and subnational regions (Boschma and Martin, 2012).
2.2 Spatial and communication networks in an urban context
Throughout all the aforementioned schools, empirical analyses of urban networks mainly focused on land-based communication systems such as roads, railways, and rivers, before extending their focus to airlines and multinational firms (Ducruet and Beauguitte, 2014). As
argued earlier in various schools, the available theories on interurban relationships have all been developed in the context of continental (inland) settings (Beyers and Fowler, 2012). Most of the time, the concept of city remains ill defined, so that the spatial unit of analysis remains fuzzy, from the city proper (administrative definition) to the city-region or urban area (functional, morphological definition). When searching for the properties of networks and nodes, most scientists took for granted this dimension, should they be economic geographers in the 1960s (graph theory) or physicists in the 2000s (complex networks). Their vast majority remains bound to a topological perspective where nodes are not cities but airports (Guimera et al., 2005), while only a handful of studies truly applied demographic or socio-economic weights to network nodes (Table 1).
[Insert Table 1 about here]
As a consequence, the theoretical and empirical bases upon which a maritime approach to urban networks can be conducted remain much limited. In addition, most of these empirical analyses remain static and at the national level. Maritime networks make no exception to this state of affairs, despite the early emergence of this transport mode and the existence, as detailed in the subsequent sections, of untapped historical movements. As early as in the 1940s, two famous geographers provided fascinating maps of worldwide maritime flows, namely André Siegfried (1940) and Edward Ullman (1949), the latter claiming that such flows allow to “take the pulse of world trade and movement” (p. 1). Before the era of automobiles, trucks, and aircrafts, the geography of ports and maritime transport was at center stage in human geography; but the plethora of scientific articles published about ports in geography journals in the 1950s-1970s (Ng and Ducruet, 2014) exhibited fading ties with human geography as a whole, being mainly monographs of ports or hinterlands. This explains why the first-ever application of graph theory to maritime flows by Ross Robinson (1968) remained much unknown to date:
“It is possible to define the spatial patterns of functional relationships between ports by examining the linkages which are sustained by the inter-port shipping movements of foreign trade vessels. Such an analysis provides not only an accurate measure of the linkages themselves but also clarifies the relationships between ports, the spatial organisation of port functions and the functional status of individual ports within the total group (…). The system of ports operating interdependently may now be regarded in abstract form as a set of points or nodes in a network, a transportation network in which the lines or links in the network are in fact ‘imaginary routes’” (Robinson, 1968, pp. 95-97)
A few other PhD dissertations were published since then, all the way up to the one of Olivier Joly (1999) who, for the first time, measured the connectivity of the global shipping network. Only a handful of articles in port geography made use of the concept of network, usually to describe inland transport networks in relation with ports (Ng and Ducruet, 2014), while others were isolated attempts to describe shipping flow densities (McKenzie, 1975) or port hierarchies based on maritime flows (see Marti and Krausse, 1983). More likely were studies of the overseas connectivity, or maritime forelands, of individual ports, or studies of so-called “port systems” often referring to the pioneering spatial model of Taaffe et al. (1963) describing an ideal-typical sequence of port development in relation with concentration forces along the coast and the emergence of inland transport corridors. Despite the early call from Peter J. Rimmer (1967) to improve the model by including more maritime linkages, most followers kept analyzing ports based on individual traffic volumes and/or hinterland linkages.
Even in a coastal context such as Southeast Asia, the analysis of interurban linkages does not include the maritime mode (Dai et al., 2016). Nevertheless, maritime network analyses grew apace since the 2000s, benefitting from increasingly available shipping data and computational power. While they differ greatly in their objectives, sources, and methods, those works have in common to have overlooked the urban dimension of the connected nodes. Geographers principally mapped the maritime networks of individual ocean carriers to understand ongoing trends in container shipping such as port selection, service rationalization, traffic concentration, and the role of shipping alliances (Rimmer and Comtois, 2005; Frémont, 2007). Physicists, economists, historians, engineers, and computer scientists all developed increasingly precise and aesthetical representations of past or current maritime flows, but with no reference to cities per se2.
Yet, a handful of studies included some urban elements in their analysis of maritime networks, which can be classified in three distinct groups. One group offered a new perspective on global urban hierarchies by looking at how cities connect through maritime Advanced Producer Services (APS), to reveal the leading nodes (Verhetsel and Sel, 2009) and the locational
2 These approaches include, but are not limited to, the analysis of past climatic conditions based on ship logbooks,
the modeling of Roman empire or Venetian routes, the evaluation and simulation of the network’s robustness to various types of attacks, its role as a vector for marine bioinvasions or infectious diseases, its overall graph topology with reference to other transport networks or network models, the measurement of environmental impacts, the relationship between port centrality and port throughput, and the influence of network structure on transport and trade costs.
determinants of these specific firms (Jacobs et al., 2011). A second group combined maritime and land networks to perform studies of global maritime accessibility (Nelson, 2008) or to apply different kinds of spatial analytical methods such as SCGE (Tavasszy et al., 2011) and GIS (Shen et al., 2013) to support certain policy scenarios serving trade and economic development in general. The last group defined maritime nodes as regions rather than cities in the network. For instance, Ducruet and Itoh (2016) revealed interesting interdependences between subnational socio-economic specialization, maritime centrality, and commodity specialization. Guerrero et al. (2015) analyzed the relationship between maritime connectivity and inland (road) accessibility across European NUTS-3 regions. Terminals and ports were aggregated with each other at the level of cities in two other studies on maritime network multiplexity and maritime/airline interdependence (see Ducruet, 2017 for a review), but without crossing the results with proper urban variables.
What can a maritime perspective bring new to our understanding of networks and cities in economic geography and beyond? Although maritime transport itself is one element only of a wider value-driven chain system (Robinson, 2015) and an all-encompassing network made of multiple and interdependent modes, flows, and nodes (Rimmer, 2015), its analysis as an urban network provides the opportunity to discuss its similarity or divergence with other communications systems linking cities of the world.
As a first step in such a direction, the present article investigates how maritime flows and port centralities overlap urban hierarchies, as a means questioning classical models such as the central place theory and its successors, where hierarchical tendencies tend to dominate how cities connect each other across the globe. Another classic approach to systems of cities is to look at the specialization and diversity of interactions, which is made possible by looking at the various types of ships circulating between (port) cities, those ships being differentiated by their propulsion technology and/or the nature of the transported goods. Are larger cities always more diversified and advanced than smaller cities? Another crucial dimension is distance, in terms of its influence on maritime linkages between cities, such as interaction range and barrier effects. Maritime transport is specific by the layout of its networks (physical constraints) and its technological evolution and operations, but it has in common with other communication networks to be increasingly controlled by a handful of powerful global actors. It is thus of paramount importance to test how increasingly footloose and centralized flows remain anchored in space, and to identify possible turning points overtime. Those issues constitute a
unified framework in which the main hypothesis is that city size is an important determinant of maritime centrality, to be (or not) reflected in the extent, diversity, and intensity of shipping interactions.
3. Methodology and results
3.1 Data and methodology
The only known way to map and analyze the long-term evolution of global maritime networks is to extract vessel movement information from the Lloyd’s List archives. In particular, the Lloyd’s Shipping Index provides a list of merchant vessels and their latest inter-port movement, published since 1880. Very rare references and uses of this unique data source exist in the literature, although today, the Lloyd’s List insures about 80% of the world fleet. We extracted one entire publication every five years, around the month of April-May, between 1890 and 2008, and then disambiguated 11,797 place names (Figure 2). The resulting database is a matrix of 769,272 vessel movements creating about 200,000 possible linkages between nearly 9,000 ports of the world.
[Insert Figure 2 about here]
The next step has been to assign every port or port terminal to a city, with the difficulty that cities may contain one or more ports, and the same port may be attributed to several cities. We adopted a morphological definition of cities to avoid incompatibility issues across incomparable administrative definitions. It is of crucial importance to well-define the nodes in spatial networks, and shift from a dominant internal approach (terminal, port-city interface, and waterfront) to a city-region and global approach, taking into account the morphological evolution of (port) cities. This morphological approach makes more sense as it is closer to their true economic importance and includes port terminals located away from Central Business Districts (Savy, 1991). Each port was assigned to a city in two different ways (Figure 3), based on the extent of urbanization and the shape of communication networks. One first assignment has been the host city, i.e. the local administrative unit to which the port belongs (level 1: port city), this unit being often part of a larger urban area having one or multiple centers. Under this perspective, ports serve coastal cities. At the second level, we enlarged the focus to the nearest and larger urban center, should it locate on the coast or inland (level 2: extended city-regions).
The latter cities are not necessarily port cities, but are most likely to be the traffic generation center of the region or hinterland (Wackermann, 1998). Although the level 2 is a wider area than the sole port city, it remains smaller than the hinterland, which sometimes may spread across several countries. Other criteria taken into account for port-city matching at level 2 are the existence or not of political borders as well as land elevation, which in many cases constrain land transport between port and (inland) city.
[Insert Figure 3 about here]
Maritime traffic corresponds to the number of vessel calls, and city size to the number of inhabitants, a good proxy of urban development, both being comparable across time and space. It has, in turn, the demerit of overestimating the (economic) importance of fast-growing cities in countries marked by demographic explosion. Urban data was collected and harmonized from three different sources (Moriconi-Ebrard, 1994; Lahmeyer, 2015; Helders, 2012). As seen in Figure 4, the final database consisted in 2,853 port cities having at least one vessel call between 1890 and 2010 (level 1), 831 extended city-regions (level 2), so 3,081 urban areas in total (levels 1 and 2). As expected, the number of ports and vessel calls continuously grown between 1890 and 2010. Technological change such as sail shipping decline (1890-1900), increasing vessel size (1990-2010), and the two world wars caused noticeable drops in vessel calls. Global maritime activity mainly concentrated in port cities (level 1), despite the fact that not all ports could have been assigned to a city (non-urban ports), and not all places could have been considered as a port (non-port places), such as countries, regions, provinces or even continents named as such in the original source. Extended city-regions (level 2) concentrated a growing share of world maritime traffic over time, from 14% in 1890 to 29% in 2010. All cities together constitute 98-99% of total traffic, with an increase from 97.8% in 1890 to 99.4% in 2010. The rest of the analysis does not include non-urban ports and transit places (e.g. canals and straits). One can already observe the higher and growing average number of ports of extended city-regions from 1.5 in 1890 to 1.8 in 2010 on average. Our database concentrates a noticeable, but shrinking, proportion of world urban population, from 55.4% in 1890 to 38.9% in 2010, all cities included (levels 1 and 2).
Cities were classified among six classes of demographic size (quantiles), based on different population thresholds for each year. Fixed thresholds of population would have been irrelevant as the maximum and average city sizes drastically changed; while changing thesholds respect the historical context and reality of world urban development: a small or large city does not have the same meaning overtime. We calculated the orthodromic distance (kilometers) of interurban maritime linkages, while graph theory and complex networks were used to compute a variety of connectivity measures, such as degree centrality (number of adjacent neighbors), betweenness centrality (number of occurrences on shortest paths), clustering coefficient (share of observed links in the maximum possible number of links), and eccentricity (topological proximity to all other nodes). Lastly, we applied single linkage analysis based on the method proposed by Nystuen and Dacey (1961) that retains in the graph the largest flow link of each node measured by the amount of vessel calls. It has the effect of revealing the main hubs in a non-planar network such as the maritime network as well as barrier effects observable through the emergence of subnetworks or connected components.
4. Main results
4.1 Port and urban hierarchies
The distribution of world vessel calls per city size class confirms the overwhelming dominance of the largest cities (Figure 5), which concentrated about 70% of world traffic on average over the period. The largest port cities (level 1), however, witnessed a decreasing share in recent decades, from 69.7% in 1975 to 60.5% in 2010. Traffic partly shifted to other large cities (Q5 and Q4), at the expense of the smallest cities (Q1 to Q3). Such trends well reflect the growing difficulty for high-density urban places to handle the bulk of global maritime trade. After a phase of continuous traffic concentration at the main coastal node (Taaffe et al., 1963), diseconomies of scale resulting from lack of space, congestion, and land-use tensions between ports and their host cities motivated the “challenge of the periphery” (Hayuth, 1981) whereby traffic shifted to distant and secondary nodes. Several spatial models in geography (Bird, 1963; Hoyle, 1989), history (Murphey, 1989) and regional science (Fujita and Mori, 1996) depicted such a trend. Extended city-regions (level 2) witnessed a similar evolution, although with a higher share of the largest cities (from 1965) and a much lower share of Q1 cities. On average, extended city-regions are 1.8 times larger than port cities, and this gap has widened over time from 1.3 in 1890 to 2.7 in 2010.
[Insert Figure 5 about here]
This is confirmed by the correlation drop between traffic and population for port cities (level 1), from 0.66 in 1925 to 0.28 in 2010. Conversely, extended city-regions (level 2) witnessed a regular increase of this correlation over the same period, from 0.29 in 1925 to 0.63 in 2010. Such an inverse trend illustrates the growing importance of freight distribution by truck or rail across hinterlands. It also confirms that the maritime and port sector did not always generate local benefits or urban growth or went through fading correlation with city size (Fujita and Mori, 1996; Grobar, 2008; Merk et al., 2013; Slack and Gouvernal, 2015; Bretagnolle, 2015; Ducruet and Itoh, 2016). Several reasons explain this trend, such as land-use conflicts, technological change, shifting trade routes, and port competition, with more intense effects in the recent period despite comparable mechanisms in the past (Marnot, 2005). Several models and empirical investigations of port system evolution well depicted the emergence of offshore hubs with related traffic shifts on the coastal side, but also the expansion of hinterlands through dry port or logistics platform development on the landside (Notteboom and Rodrigue, 2005), thereby distorting the longstanding overlap between port and urban hierarchies. But for extended city-regions, it validates the fact that matching ports with larger and more distant cities reveals the permanency of port-city linkages, despite such spatial and functional changes. In other words, ports and maritime networks continue to be tied to cities but not necessarily to their host, port cities.
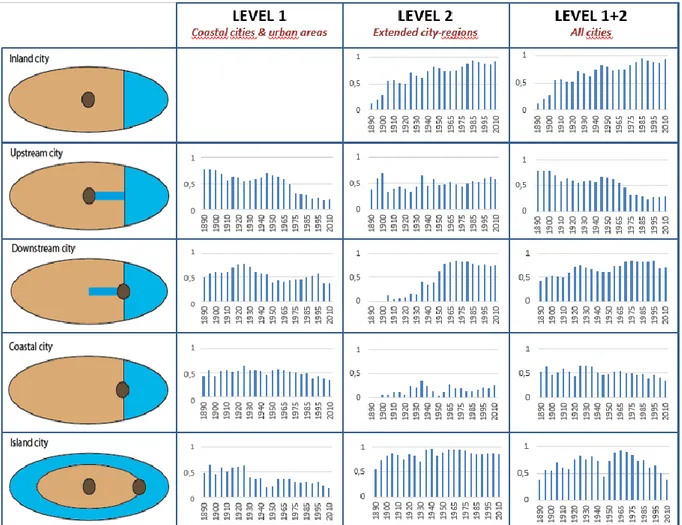
The same correlation was calculated depending on the location of cities (Figure 6). Upstream and downstream cities locate along rivers, estuaries, and deltas; coastal cities locate along the coastline but without river access; inland cities have no maritime access; and island cities are located on islands, from the smallest ones (e.g. St. Helena) to a whole country (e.g. Australia, Japan). We observe a huge drop for upstream cities (level 1), from 0.78 in 1890 to 0.19 in 2010. This perfectly illustrates the rescaling of both urban and port activities (Brocard, 1988), resulting from nautical accessibility limitations to welcome increasingly larger vessels, lack of space for further expansion, and congestion issues, despite notorious counter-examples such as Antwerp and Hamburg (Notteboom, 2016). The opposite trend occurred for downstream cities (level 2), from -0.12 in 1890 to 0.75 in 2010, as already depicted by the mercantile model of Vance (1970) and the Anyport model of Bird (1963). Nautical accessibility advantages but also intermodal linkages with the hinterland are among the main explanatory factors. Coastal cities
on islands also witnessed a decline but only at level 1, from 0.48 in 1890 to 0.18 in 2010, while other types of cities have maintained a relatively stable correlation. For extended city-regions (level 2), the driving force behind the increasing correlation comes from inland cities, from 0.11 in 1890 to 0.92 in 2010. Downstream and inland cities have in common to have benefited from the development of inland transport networks allowing more flexible routing patterns (Hoare, 1986; Overman and Winters, 2005) and a deepening control of inland logistics by main ports through a process of regionalization (Notteboom and Rodrigue, 2005). Despite all these spatial and functional changes, the correlation between traffic and population has remained somewhat stable over time, from 0.63 in 2010 (coastal cities) to 0.60 in 2010 (extended city-regions). This first analysis confirms that maritime transport is, still nowadays, a relevant urban function.
[Insert Figure 6 about here]
4.2 Traffic specialization
The way different technologies and specializations are distributed across the urban hierarchy is another key question in economic geography. Early economic geographers observed that larger (port) cities handle more diversified types of goods than smaller cities (Carter, 1962; Doumenge, 1965). We propose two complementary analyses to verify such an issues more systematically: sail or steam propulsion in the early period (1890-1925), and six main ship types in the late period (1975-2010). Sail and steam have in common to carry all sorts of goods as well as passengers, but differ in terms of size, speed, sensitivity to natural conditions, service design (e.g. coal bunkering stations), and cargo handling facilities. Steamers being the most modern mean of transportation at the time, their traffic distribution is a good indicator of technological advance. The six ship types refer to different kinds and values of products, with passenger flows in addition to cargoes, each of them varying also in terms of potential employment generation locally and degree of spatial friction on land (Guerrero, 2014). As seen in Figure 7, the comparative analysis of sail and steam traffic is most relevant for port cities (level 1). Sail traffic dominates until 1900, and declines rapidly since then. The linear correlation with city size is very significant and much higher for steamer than for sailing traffic during all the period (0.66 against 0.44 on average), which confirms the innovative character and technological advance of larger cities. In addition, largest cities handle the highest traffic mix (i.e. sail-steam combination).
[Insert Figure 7 about here]
When it comes to the late period (Figure 8), we also observe that the largest cities are always more diversified than smaller cities, at both levels 1 and 2. General cargo, the most employment-generative category (semi-finished goods), and containers (finished goods), the most valued, have the highest correlations with urban population in both cases. It is followed by vehicles and solid bulks, while liquid bulks and passengers have no significant correlation. Correlations are much more significant for extended city-regions than for port cities (0.60 against 0.25 on average), again confirming that such city-regions use multiple, complementary terminals to serve their economy. They also differ by their higher correlation with solid bulks, which comprise construction and raw materials. The low correlation with passenger traffic (ferries and cruise) is explained by the fact that this traffic is more seasonal and operates through specific itineraries (Rodrigue and Notteboom, 2013). Liquid bulks are often handled in remote oil or gas terminals using pipelines to reach final destinations inland. The fact that city size goes along with technological advance and value chains is another contribution to such issues in economic geography. Such findings corroborate the fact that larger cities are often more diversified than smaller cities in economic geography (Quigley, 1998; Taylor et al., 2002; Ottaviano and Peri, 2006; Duranton and Puga, 2000), which is also discussed by Neffke et al. (2011) in the case of regions as units of analysis.
[Insert Figure 8 about here]
4.3 Distance and centrality in shipping interactions
One particularity of non-planar graphs and in particular spatial networks is that larger nodes on average connect further than smaller nodes (Barthelemy, 2011). This was verified in studies on airline networks (Guimera et al., 2005) and liner shipping networks (Ducruet, 2017). Figure 9 compares the average kilometric length and average number of call-kilometers by classes of demographic size. Despite some fluctuations and fuzzy results in the early period (1890-1900), the rest shows a clear dominance of the largest cities. Call-kilometers, which both measures the range and intensity of spatial interaction, exhibits a wider gap between the largest cities and other cities, the same results being obtained for levels 1 and 2. It means that larger cities expand farther their overseas (foreland) connections due to a more diverse and dynamic economic base than smaller cities. Another important result is the higher correlation with call-kilometers than
with calls alone, at both levels. In this respect, the maritime network linking cities of the world is not so different from theoretical models such as the central place theory, where larger cities attract goods, populations, and activities from farther distances than smaller cities.
[Insert Figure 9 about here]
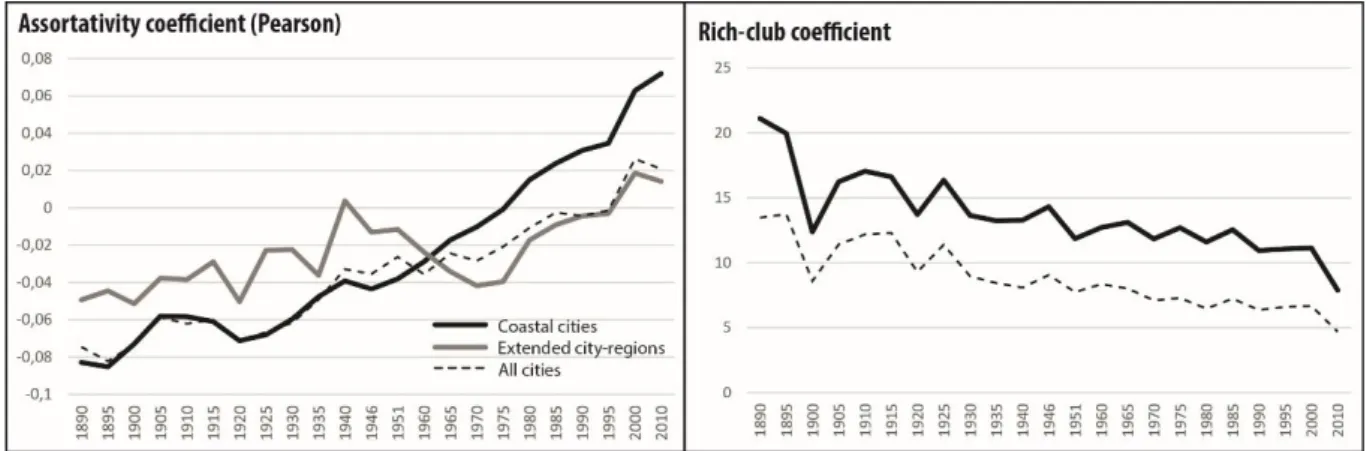
This leads us to analyze a complementary aspect of spatial networks termed homophily in social networks and assortativity in complex networks, which is the tendency for nodes of the same nature or size to be more connected with each other. Just like in any other communication system, larger cities may dominate smaller cities while at the same time, connect primarily with each other based on the idea that rich-club effects govern their relationships. For that matter we applied the existing methodology to urban population as node weight instead of degree centrality (Newman, 2002). As seen in Figure 10, the global maritime network tended to connect cities of dissimilar size in the first half of the period (negative coefficient). This structure has evolved towards zero correlation for extended city-regions and all cities, while for port cities (level 1) there has been a tendency towards assortativity. This means that city size differentials have lost their explanatory power to other factors in the distribution of maritime flows, mainly due to the aforementioned correlation drop between traffic and population.
The rich-club coefficient is defined by the ratio between the gamma index of the whole network and the gamma index for the subnetwork of larger cities. Larger cities here are those which population is over world average within the sample. The gamma index is defined as the proportion of actual links in the maximum possible number of links, sometimes coined density in the literature. It is useful to check whether larger nodes are more densely connected with each other compared with the rest of the network. In the same figure, we see that the rich-club coefficient is always very high, but it has regularly dropped over time. It is 1.5 times higher among port cities (level 1) than among extended city-regions (level 2) because the maritime network is more sparsely connected for the first than for the latter. Another interesting fact is that if the gamma index is on a downward trend in all cases, it declines more rapidly (85% loss) for larger cities, especially since the 1930s than for the whole network (60% loss). It underlines that maritime flows became reorganized around certain intermediary hubs located outside large cities. This process started way before containerization, which is believed to be the main factor behind spatial change (Cullinane and Khana, 2000), but truly expanded globally in the late 1970s (Guerrero and Rodrigue, 2014).
[Insert Figure 10 about here]
Several complex network measures were computed for understanding their relationship with city size in the global maritime network (Figure 11). Overall, port cities (level 1) and all cities (level 1 and 2) witnessed similar trends over time. Eccentricity is the least correlated with city size in both cases, but exhibits a very stable correlation oscillating around 0.3. The three other measures have a much more significant correlation with city size, but it declined drastically and regularly between 1890 and 2010. As for the number of calls, including extended city-regions (level 2) greatly improved the correlation and attenuated this decline. Yet, betweenness centrality, a global accessibility measure, had the highest correlation with city size until the 1950s, reflecting upon their role as hubs in a core-periphery system where interregional flows are routed through larger, primate cities. Since then, this relationship has become less significant than the one with degree centrality. This implies that the number of direct linkages, a more local measure, still keeps some significance in the post-1950 period although it has been declining as well. Larger cities still develop numerous linkages nowadays but their global hub function shifted to smaller cities having better infrastructure and/or accessibility. The last measure, clustering coefficient, went through a similar trend than degree centrality, but at lower levels along the period. City size used to be a noticeably influential factor to explain hub functions in the past, but it also lost significance over time. Average centrality scores by classes of demographic size (Table 2) increase regularly from the smallest (Q1) to the largest cities (Q6), the latter class being specific by the wide gap with others. Thus, despite the lowering correlations observed in the previous figure, larger cities persistently dominate the global maritime network.
[Insert Figure 11 about here] [Insert Table 2 about here]
4.4 Polarization and barrier effects
This last analysis wishes to verify the factors behind the emergence of subsystems, and to zoom on the role of particular cities in the network, based on one snapshot every 30 years (Figure 12). In 1890, maritime hubs concentrate in the North Atlantic region, from which a handful of cities dominate the rest of the world through long-distance linkages. Apart from London and
New York, the dominant cities are not necessarily the largest ones, such as Cardiff, Liverpool, Tyne, and Buenos Aires. The vast geographic diversity of their maritime forelands is largely explained by the colonial factor, while a number of large cities such as Calcutta, Bombay, Tokyo, and Shanghai appear as second-tier nodes. In several other subsystems, city size appears to be the relevant factor behind maritime centralization, as seen with Marseilles, Hamburg, Philadelphia, and San Francisco.
[Insert Figure 12 about here]
In 1920, city size had become much more overlapped with maritime centrality. New York and London dominate the two largest nodal regions, while the smaller regions are polarized by well-populated nodes, such as San Francisco, Liverpool, and Amsterdam. Like in 1890, Buenos Aires is the only non-Western port city with a position equivalent to North Atlantic hubs, backed by a period of economic prosperity and rapid industrialization. Overall, the global maritime network of the 1920s appears to be more integrated given the smaller number of nodal regions compared with 1890. Although colonial linkages are still influential (e.g. London and Asia-Pacific), we observe a growing geographic specialization of the main hubs, such as Buenos Aires shifting under the influence of New York, in a context of growing US interests on Latin America. In 1950, London and New York are still very central but Tokyo emerges as an independent hub. Colonial linkages are maintained here and there (e.g. Marseilles and Africa), but Liverpool and Hamburg lost ground and were superseded by Antwerp and Rotterdam. The strong combination between city size and maritime centrality is a key, path-dependent element in the evolution of London, New York, and Tokyo as global cities, although their port function is not anymore considered by urban specialists (Sassen, 1991).
In 1980, major changes greatly modified the past order. London and New York now appear as satellite cities, dominating a much smaller scope of flows while being under the direct influence of Rotterdam and Genoa. Tokyo, the world’s largest city, and Osaka in Japan, concentrate the largest flow link connecting the US West Coast at Los Angeles. Hamburg, Antwerp, New Orleans, and Singapore appear as very large hubs despite their relatively smaller city size. Except Tokyo, only Lagos, Athens (Piraeus), and Sao Paulo (Santos) are both larger cities and strong maritime hubs. This tendency is reinforced in 2010 with the huge centrality of Rotterdam and Singapore, polarizing almost the entire global network. In comparison, larger cities are becoming more and more peripheral, but remain second-tier nodes. Sao Paulo and Istanbul are
the only examples outside Tokyo of a continued overlap between city size and maritime centrality. In a context of intensifying economies of scale in port and shipping operations, the logistical factor has surpassed the urban factor in positioning cities relatively to one another in the network.
5. Conclusion
The long-term analysis of systems of cities through the lenses of maritime transport is a necessary step forward in economic geography for many reasons. First, it confirms a number of theoretical and empirical elements in the mainstream literature on urban and spatial networks in general. Well-known stylized facts such as the nexus between hierarchy and specialization, the friction of distance, barrier effects, and the polarization of subsystems are confirmed by the analysis of untapped shipping and population data. In the meantime, it also confirms a number of trends affecting the ports and maritime sector in general, hinterland penetration and expansion, as well as wider dynamics such as the shift from North Atlantic to Asia-Pacific as the core of world maritime trade. The fact that demographically larger cities maintained their prominence in the maritime network is much linked to their capacity to handle multiple types of flows, to connect over longer distances, and to exert synergy effects at the top of the hierarchy. But such an ability also depends on classic factors such as location, as seen with the confirmation of early spatial model of port city evolution. This research thus can be seen as an illustration of how a given (transport) network is spatially embedded, especially when taking into account the demographic weight of its nodes, to go beyond the sole topological and mathematical approaches of networks that are so numerous in the academic literature (Schwanen, 2017).
Perhaps, one specificity of maritime transport in the literature on systems of cities is the growing distance between physical operations and the command and control centers of the world, should they be coastal or inland. This spatial change reflects road transport growth but also a growing vulnerability of the maritime system due its dependence upon a few large hubs. In the meantime, we demonstrate that maritime flows remain, still nowadays, a vital element of global but also urban development. Lloyd’s List data is a very rich source of information that allowed a long-term spatial analysis of a particular network, which is not very common in network science where simulation models often palliate the lack of temporal data. Efforts are being made to extract further information from those historical records (e.g. tonnage capacity, date of built, nationality of vessels; arrival and departure dates to calculate inter- and intra-port transit times,
etc.), thanks to the development of advanced Optical Character Recognition (OCR) software, making links with the wider area of digital humanities.
Further research shall concentrate its efforts on the integration of maritime networks with other networks, such as the global road network, to make the analysis more realistic by taking into account intermodal linkages and the continental penetration of shipping flows (hinterlands). Econometric methods shall better demonstrate the direction of the influence between urban and port growth overtime. More advanced methods of network clustering (i.e. community detection) can be applied to avoid losing too much information and have a more detailed view on the network’s subsystems and on the evolution of the world system, its cores and peripheries. Lastly, extracting a bigger quantity of shipping flow information would generate more longitudinal time-series data and allow for a better understanding of the role of particular events and shocks affecting the network and its nodes, in terms of barrier effects. Such methodological improvements shall go along with the elaboration of a further integration of various theoretical dimensions such as resilience, co-evolution, rescaling, and innovation diffusion. Such a framework can potentially shed new light on how ports and port cities of the world were capable of overcoming and adapting to major economic, political, and technological changes affecting our contemporary world, providing implications for wider urban and network studies in geography and elsewhere.
References
Barthelemy M. (2011) Spatial networks. Physics Reports, 499(1-3): 1-101.
Batty M., Longley P. (1994) Fractal Cities: A Geometry of Form and Function. Academic Press.
Bernhofen D.M., El-Sahli Z., Kneller R. (2013) Estimating the effects of the container revolution on world trade. Lund University Working Paper 2013:4, Department of Economics, School of Economics and Management.
Berry B.J.L. (1964) Cities as systems within systems of cities. Papers in Regional Science, 13(1): 147-163.
Berry B.J.L., Wheeler J. (2014) Urban Geography in America, 1950-2000: Paradigms and Personalities, Routledge.
Beyers W.B., Fowler C.S. (2012) Economic structure, technological change and location theory: the evolution of models explaining the link between cities and flows. In: Hall P.V., Hesse M. (eds.), Cities, Regions and Flows. London: Routledge, pp. 23-41.
Bird J. (1963) The Major Seaports of the United Kingdom. London: Hutchinson.
Boschma R., Martin R. (2012) The Handbook of Evolutionary Economic Geography. Cheltenham: Edward Elgar Publishing.
Braudel F. (1979) Civilisation matérielle, économie et capitalisme, XVe-XVIIIe siècle. Paris: Armand Colin.
Bretagnolle A. (2015) City systems and maritime transport in the long term. In: Ducruet C. (Ed.), Maritime Networks: Spatial Structures and Time Dynamics, Routledge Studies in Transport Analysis, pp. 27-36.
Brocard M. (1988) Les relations fonctionnelles entre le port et la ville. Proceedings of the First Annual Conference of the International Association Cities and Ports, Le Havre, p. 69. Camagni R.P., Salone C. (1993) Network urban structures in Northern Italy: elements for a
theoretical framework. Urban Studies, 30(6): 1053-1064.
Capello R. (2000) The city network paradigm: measuring urban network externalities. Urban Studies, 37(11): 1925-1945.
Carter R.E. (1962) A comparative analysis of United States ports and their traffic characteristics. Economic Geography, 38: 162-75.
Christaller W. (1933) Die Zentralen Orte in Süddeutschland. Jena: Gustav Fischer.
Coe N. M., Hess M., Yeung H. W., Dicken P., Henderson J. (2004) “Globalizing” regional development: a global production networks perspective. Transactions of the Institute of British Geographers, 29(4): 468-484.
Cullinane K.P.B., Khanna M. (2000) Economies of scale in large containerships: optimal size and geographical implications. Journal of Transport Geography, 8(3): 181-195.
Dai L., Derudder B., Liu X. (2016) Generative network models for simulating urban networks, the case of inter-city transport network in Southeast Asia. Cybergeo: European Journal of Geography, 786: https://cybergeo.revues.org/27734
Derudder B., Witlox F. (2010) Commodity Chains and World Cities. Wiley-Blackwell.
Dobruszkes F., Lennert M., Van Hamme G. (2011) An analysis of the determinants of air traffic volume for European metropolitan areas. Journal of Transport Geography, 19(4): 755-762. Doumenge F. (1965) Géographie des mers. Paris: Presses Universitaires de France.
Ducruet C. (2017) Multilayer dynamics of complex spatial networks: the case of global maritime flows (1977-2008). Journal of Transport Geography, 60: 47-58.
Ducruet C., Beauguitte L. (2014) Spatial science and network science: Review and outcomes of a complex relationship. Networks and Spatial Economics, 14(3-4): 297-316.
Ducruet C., Itoh H. (2016) Regions and material flows: Investigating the regional branching and industry relatedness of port traffic in a global perspective. Journal of Economic Geography, 16(4): 805-830.
Duranton G., Morrow P., Turner M. (2014) Roads and trade: evidence from the U.S. Review of Economic Studies, 81(2): 681-724.
Duranton G., Puga D. (2000) Diversity and specialisation in cities: why, where and when does it matter? Urban Studies, 37: 533-55.
El Hosni A. (2017) Le Retour du Port dans la Ville. Sarrebruck: Editions Universitaires Européennes.
Frémont A. (2007) Global maritime networks: The case of Maersk. Journal of Transport Geography, 15(6): 431-442.
Friedmann J. (1986) The world city hypothesis. Development and Change, 17(1): 69-83. Fujita M., Krugman P., Mori T. (1999) On the evolution of hierarchical urban systems.
European Economic Review, 43(2): 209-251.
Fujita M., Mori T. (1996) The role of ports in the making of major cities: Self-agglomeration and hub-effect. Journal of Development Economics, 49(1): 93-120.
Gereffi G., Korzeniewicz M. (1994) Commodity Chains and Global Capitalism. ABC-CLIO. Gottmann J. (1961) Megalopolis: the Urbanized Northeastern Seaboard of the United States.
Twentieth Century Fund.
Grobar L.M. (2008) The economic status of areas surrounding major U.S. container ports: Evidence and policy issues. Growth and Change, 39(3): 497-516.
Guerrero D. (2014) Deep-sea hinterlands: Some empirical evidence of the spatial impact of containerization. Journal of Transport Geography, 35: 84-94.
Guerrero D., Proulhac L. (2014) Freight flows and urban hierarchy. Research in Transportation Business and Management, 11: 105-115.
Guerrero D., Rodrigue J.P. (2014) The waves of containerization: shifts in global maritime transportation. Journal of Transport Geography, 35: 151-164.
Guimera R., Mossa S., Turtschi A., Amaral L.A. (2005) The worldwide air transportation network: Anomalous centrality, community structure, and cities' global roles. Proceedings of the National Academy of Sciences USA, 102(22): 7794-7799.
Hägerstrand T. (1953) Innovationsförloppet ur korologisk synpunkt. Gleerupska univ.-bokhandeln.
Hall P.V., Hesse M. (2012) Cities, Regions and Flows. London & New York: Routledge. Hayuth Y. (1981) Containerization and the load center concept. Economic Geography, 57(2):
160-176.
Helders S. (2012) World Gazetteer. Discontinued website.
Hesse M. (2013) Cities and flows: re-asserting a relationship as fundamental as it is delicate. Journal of Transport Geography, 29: 33-42.
Hesse M. (2017) Approaching the relational nature of the port-city interface in Europe: ties and tensions between seaports and the urban. Tijdschrift voor Economische en Sociale Geografie, DOI: 10.1111/tesg.12282
Hoare A.G. (1986) British ports and their export hinterlands: A rapidly changing geography. Geografiska Annaler B, 68(1): 29-40.
Hoyle B.S. (1989) The port-city interface: trends, problems, and examples. Geoforum, 20(4): 429-435.
Jacobs W., Koster H.R.A., Hall P.V. (2011) The location and global network structure of maritime advanced producer services. Urban Studies, 48(13): 2749-2769.
Joly O. (1999) La structuration des réseaux de circulation maritime. Unpublished Phd Dissertation in Territorial Planning, Le Havre: Université du Havre.
Kennedy C.A., Stewart I., Facchini A., Cersosimo I., Mele R., Chen B., Uda M., Kansal A., Chiu A., Kim A., Dubeux C., Lebre La Rovere E., Cunha B., Pincetl S., Keirsteadi J., Barles S., Pusakak S., Gunawan J., Adegbile M., Nazariha M., Hoque S., Marcotullio P.J., Gonzalez Otharan F., Genena T., Ibrahim N., Farooqui R., Cervantes G., Sahin A.D. (2015) Energy and material flows of megacities. Proceedings of the National Academy of Sciences, 112(19): 5985-5990.
Krugman P. (1990) Increasing returns and economic geography. National Bureau of Economic Research, http://www.nber.org/papers/w3275
Lahmeyer J. (2015) Population statistics. Growth of the population per country in a historical perspective, including their administrative divisions and principal towns, http://www.populstat.info/
Lewis M.W., Wigen K. (1999) A maritime response to the crisis in area studies. The Geographical Review, 89(2): 161-168.
Marnot B. (2005) Interconnexion et reclassements : l’insertion des ports français dans la chaîne multimodale au XIXe siècle. Flux, 59(1): 10-21.
Merk O., Manshanden W.J.J., Dröes M.I. (2013) Inter-regional spillovers of seaports: The case of Northwest Europe. International Journal of Transport Economics, 40(3): 401-417.
Moriconi-Ebrard F. (1994) Geopolis : pour comparer les villes du monde. Paris: Economica. Murphey R. (1989) On the evolution of the port city. In: Broeze F. (Ed.), Brides of the Sea:
Port Cities of Asia from the 16th - 20th Centuries, University of Hawaii Press, Honolulu, pp.
223-245.
Neffke F., Henning M., Boschma R. (2011) How do regions diversify over time? Industry relatedness and the development of new growth paths in regions. Economic Geography, 87(3): 237-265.
Nelson A. (2008) Travel time to major cities: A global map of accessibility. Global Environment Monitoring Unit, Joint Research Centre of the European Commission, Ispra, Italy.
Newman M.E.J. (2002) Assortative mixing in networks. Physical Review Letters, 89: 208701. Ng A.K.Y., Ducruet C. (2014) The changing tides of port geography (1950-2012). Progress in
Human Geography, 38(6): 785-823.
Noin D. (1999) La population des littoraux du monde. L’Information Géographique, 63(2): 65-73.
Notteboom T.E. (2016) The adaptive capacity of container ports in an era of mega vessels: The case of upstream seaports Antwerp and Hamburg. Journal of Transport Geography, 54: 295-309.
Notteboom T.E., Rodrigue J.P. (2005) Port regionalization: Towards a new phase in port development. Maritime Policy and Management, 32(3): 297-313.
O’Connor K. (2010) Global city-regions and the location of logistics activity. Journal of Transport Geography, 18(3): 354-362.
Ottaviano G.I.P., PERI G. (2006) The economic value of cultural diversity: evidence from US cities. Journal of Economic Geography, 6: 9-44.
Overman H.G., Winters L.A. (2005) The port geography of UK international trade. Environment and Planning A, 37(10): 1751-1768.
Paulus F. (2004) Coévolution dans les systèmes de villes : croissance et spécialisation des aires urbaines françaises de 1950 à 2000. Unpublished PhD in Geography, University of Paris I Panthéon-Sorbonne.
Peris A. (2016) Penser les villes en réseaux : une analyse des théories sur les liens interurbains. Master Dissertation in Geography, University of Paris I Panthéon-Sorbonne.
Pflieger G., Rozenblat C. (2010) Introduction. Urban networks and network theory: the city as the connector of multiple networks. Urban Studies, Special Issue: Urban Networks and Network Theory, 47(13): 2723-2735.
Pred A. (1973) Systems of Cities and Information Flows. Lund Studies in Geography, Serie B, No. 38.
Pred A. (1977) City Systems in Advanced Economies: Past Growth, Present Processes, and Future Development Options. Wiley.
Pumain D. (1997) Pour une théorie évolutive des villes. Espace Géographique, 26(2): 119-134. Pumain D., Sanders L., Saint-Julien T. (1989) Villes et Auto-Organisation. Paris: Economica. Quigley J.M. (1998) Urban diversity and economic growth. Journal of Economic Perspectives,
12: 127-138.
Reggiani A. (2017) Complex urban networks: Resilience, vulnerability and accessibility. Keynote speech, The Future of Urban Networks Conference, Ghent, September 18-20. Rimmer P.J. (1967) The changing status of New Zealand seaports, 1853-1960. Annals of the
Association of American Geographers, 57(1): 88-100.
Rimmer P.J. (2015) Foreword. In: Ducruet C. (Ed.), Maritime Networks: Spatial Structures and Time Dynamics, London and New York: Routledge, pp. xxi-xxiii.
Rimmer P.J., Comtois C. (2005) China's extra- and intra-Asian liner shipping connections, 1990-2000. Journal of International Logistics and Trade, 3: 75-97.
Robic M.C. (1982) Cent ans avant Christaller... Une théorie des lieux centraux. L’Espace Géographique, 11(1): 5-12.
Robinson R. (1968) Spatial Structuring of Port-Linked Flows: The Port of Vancouver, Canada, 1965. Unpublished PhD Dissertation in Geography, University of British Colombia.
Robinson R. (2002) Ports as elements in value-driven chain systems: the new paradigm. Maritime Policy and Management, 29(3): 241-255.
Robinson R. (2015) Afterword. In: Ducruet C. (Ed.), Maritime Networks. Spatial Structures and Time Dynamics. London and New York: Routledge, pp. 374-377.
Sanders L. (1992) Systèmes de Villes et Synergétique. Paris: Economica.
Sassen S. (1991) The Global City: New York, London, Tokyo. Princeton: Princeton University Press.
Savy M. (1991) Port, ville et territoire. In: Villes Portuaires et Nouveaux Enjeux Internationaux, Le Havre: International Association Cities and Ports, pp. 91-101.
Schwanen T. (2017) Geographies of transport II: Reconciling the general and the particular. Progress in Human Geography, 41(3): 355-364.
Slack B., Gouvernal E. (2015) Container transshipment and logistics in the context of urban economic development. Growth and Change, 47(3): 406-415.
Taaffe E.J., Morrill R.L., Gould P.R. (1963) Transport expansion in underdevelopped countries: A comparative analysis. Geographical Review, 53: 503-529.
Taylor P.J., Hoyler M., Verbruggen R. (2010) External urban relational process: Introducing central flow theory to complement central place theory. Urban Studies, 47(13): 2803-2818. Taylor P.J., Walker D.R.F., Catalano G., Hoyler M. (2002) Diversity and power in the world
city network. Cities, 19: 231-241.
Törnqvist G. (1968) Flows of information and the location of economic activities. Geografiska Annaler Series B, 50(1): 99-107.
Ullman E.L. (1949) Mapping the world's ocean trade: A research proposal. The Professional Geographer, 1(2): 19-22.
Ullman E.L. (1954) Geography as spatial interaction. In: Proceedings of the Western Committee on Regional Economic Analysis, Berkeley, pp. 63-71.
Urry J., Savitzky S., Birtchnell T. (2015) Cargomobilities: Moving Materials in a Global Age. London: Routledge.
Vance J.E. (1970) The Merchant’s World. The Geography of Wholesaling. Englewood Cliffs: Prentice-Hall.
Wackermann G. (1998) Façades maritimes en mutation: une géographie socioéconomique des littoraux. Paris: Ellipses.
Xie Y. (1996) A generalized model for cellular urban dynamics. Geographical Analysis, 28(4): 350-373.
Author(s) Year Network(s) Area
Holl 2004 Road Portugal
Chapelon 2006 Road Europe Nelson 2008 Road, rail, river, maritime World Jin et al. 2010 Road, rail China
Neal 2011 Air USA
Wang et al. 2011 Air China Dobruszkes et al. 2011 Air Europe Berroir et al. 2012 Rail, commuting, air France Duranton et al. 2014 Road, freight USA Guerrero and Proulhac 2014 Freight France Ducruet and Itoh 2016 Maritime World
Table 1: Selection of works on weighted urban networks
Class Coastal cities All cities
K BC CC EX K BC CC EX 1 5 410 1.62 0.60 5 200 1.37 0.58 2 7 666 2.11 0.63 7 334 1.70 0.60 3 9 1,034 2.35 0.65 9 478 1.86 0.62 4 13 1,558 2.52 0.68 12 691 2.06 0.65 5 20 2,817 2.85 0.71 19 1,431 2.31 0.68 6 51 13,587 3.85 0.79 49 7,367 3.21 0.77
Table 2: Average centrality by city size and type, 1890-2010
N.B. measures correspond to degree centrality (K), betweenness centrality (BC), clustering coefficient (CC) and eccentricity (EX)
Figure 1: Evolution of schools of thought about systems of cities Source: adapted from Peris (2016)
Figure 2: Methodology for port-city matching Source: own realization
Figure 4: Sample evolution, 1890-2010 Source: own realization
Figure 5: Traffic distribution and urban hierarchies, 1890-2010 Source: own realization
Figure 6: Correlation between vessel calls and urban population by city types, 1890-2010 Source: own realization
Figure 7: Sailing and steamer traffic distribution at coastal cities, 1890-1925 Source: own realization
Figure 8: Traffic diversity and city size, 1975-2010 Source: own realization
Figure 9: City size and scope of maritime interactions, 1890-2010 Source: own realization
Figure 10: Assortativity and rich-club effects by city type, 1890-2010 Source: own realization
Figure 11: Network centrality and city size, 1890-2010 Source: own realization
Figure 12: Main hubs and their nodal regions, 1890-2010 Source: own realization
Figure 12: Main hubs and their nodal regions, 1890-2010 (continued)