HAL Id: insu-01324449
https://hal-insu.archives-ouvertes.fr/insu-01324449
Submitted on 1 Jun 2016
HAL is a multi-disciplinary open access archive for the deposit and dissemination of sci-entific research documents, whether they are pub-lished or not. The documents may come from teaching and research institutions in France or abroad, or from public or private research centers.
L’archive ouverte pluridisciplinaire HAL, est destinée au dépôt et à la diffusion de documents scientifiques de niveau recherche, publiés ou non, émanant des établissements d’enseignement et de recherche français ou étrangers, des laboratoires publics ou privés.
Distributed under a Creative Commons Attribution| 4.0 International License
To cite this version:
Laura Cordero-Llana, Karim Ramage, Kathy S. Law, Philippe Keckhut. LABEX L-IPSL Arctic Metadata Portal. CODATA Data Science Journal, Committee on Data for Science and Technology (CODATA), 2016, 15, pp.1-11. �10.5334/dsj-2016-002�. �insu-01324449�
PRACTICE PAPER
LABEX L-IPSL Arctic Metadata Portal
Laura Cordero-LLana
1, Karim Ramage
2, Kathy S. Law
1and Philippe Keckhut
11 LATMOS/IPSL, UVSQ Université Paris-Saclay, UPMC Univ. Paris 06, CNRS, Guyancourt, France [email protected], [email protected], [email protected]
2 IPSL, Ecole Polytechnique Palaiseau, France [email protected]
The Institut Pierre Simon Laplace (IPSL) encompasses a wide diversity of projects that focus on the Arctic. From these observations the IPSL has generated a large number of datasets gathering Arctic observations. These observations include measurements on atmospheric chemical composition, snow micro-physical properties or ocean measurements. However, some of these datasets remain locally stored and there is a lack of public awareness regarding these resources, which has hindered their visualisation and sharing. This motivated the creation of the LABEX L-IPSL Arctic metadata Portal (http://climserv.ipsl.polytechnique.fr/arcticportal/), presented here, which improves the visibility of the variety of observations collected within the institute as well as the evaluation of numerical models. The LABEX L-IPSL Arctic metadata Portal will also pro-mote new avenues in Arctic research within the IPSL and with other collaborating institutions. Keywords: Arctic; Metadata; Observations; atmosphere; ocean; ice
1 Introduction
The Arctic region surrounds the Earth’s North Pole, although its geographic limit varies depending on the criteria followed (Figure 1). The Arctic is undergoing unprecedented changes as a result of global warm-ing, such as the sea ice extent decline since late 1970s consistent in all months of the year, with the retreat speeding up since the early 1990s (Budikova, 2009). Also the observed increase in mass loss from the Greenland ice sheet during the last decade (Rignot and Kanagaratnam, 2006; Schrama and Wouters, 2011; Velicogna, 2009; van de Wal et al., 2008), is of great concern for its future contribution of sea level, since if melted completely, sea level would rise a global average of 7.3 m (Lemke et al., 2007). The causes of such changes and their impacts on the environment and society are not yet well understood, hence limiting our ability to predict the future climate challenges. In particular, it is essential to improve the performance of global climate models, including treatments of many processes and their interactions within the atmos-phere, ocean, sea ice, ice sheet and biosphere systems. Processes-based studies combining analysis of avail-able observations and models of varying complexity and scales are needed to make climate models more realistic, which is an important task for future predictions of climate scenarios.
The IPSL (http://www.ipsl.fr/) is focussed on research topics concerning the global environment and par-ticularly on the Arctic, which has been recently highlighted as a research priority within the institute and at national level. This priority motivated the creation in 2010 of the new French Arctic initiative Chantier arctique (http://www.chantier-arctique.fr/en/), which aimed at mobilising the existent multidisciplinary scientific community focussed on Arctic research to help identify the key scientific issues. The IPSL focuses on the environmental research part, which has identified the need for increasing observations in the Arctic, from different scientific communities, as well as to identify existing datasets. The latter motivated the devel-opment of the LABEX L-IPSL Arctic metadata portal, presented here as a tool to identify Arctic data within the IPSL and linked institutes. LABEX (Laboratoires d’Excellence) L-IPSL (http://labex.ipsl.fr/) is a scientific program that focusses on the study of climate change as part of the IPSL. The goal of the project was to provide an assessment of the potential consequences of climate change at different time and spatial scales, which are important for political or economical issues. The project is strongly focussed on regional scales, for instance the Arctic. The creation of the LABEX L-IPSL Arctic metadata portal was part of one of the work packages within the project.
A lot of effort can be put into unifying data format, however, if this is not accompanied by comprehensive metadata, the visibility and accessibility of this information is compromised. This could mean that valu-able data remain untapped in local computers or servers. Starting a metadata compilation is a long process that can not be automated, but once it is in place, acts as driving force for a wide scientific community, facilitating data sharing and collaborations. The main objective of this paper is to showcase the different observations that exist as part of the IPSL, compiled in the metadata portal, without elaborating into the technical aspects of the metadata interface itself. This metadata portal is an important starting point for Arctic research at the IPSL level, but also for the development of national collaborations and links with other international efforts and shared resources.
The portal represents all the Arctic datasets created by the IPSL researchers with a total of 32 datasets identified (the complete dataset list can be found in the supplementary material). Some of the existing data-sets at the IPSL are already archived through various data centres, such as The ICARE (Cloud Aerosol Water Radiation Interactions) Thematic Centre (http://www.icare.univ-lille1.fr/) and Ether (http://www.pole-ether. fr/etherTypo/index.php?id=1450&L=1), which is and Atmospheric Chemistry Data Centre. However these Figure 1: Summary of the different geographic limits for the Arctic commonly used. The geographic
lim-its are defined in a variety of ways, such as by the distribution of permafrost, the Arctic Circle, the 10°C isotherm, the tree-line and/or the salinity boundary in the sea. Most boundaries of the Arctic are drawn further north in Norway and Scandinavia than in the rest of the world. This is because a branch of the warm Gulf Stream flows northwards along the coast of Norway and continues past Svalbard into the polar regions (Source http://www.arcticsystem.no/en/arctic-inc/headquarters.html).
data centres are not specifically focussed on the Arctic. The purpose of the portal was to provide metadata information that could be easily accessed by the user for their own research and to create a tool that gath-ered all relevant metadata information for each dataset. The metadata template used for this purpose was created in a comprehensive way aimed at a wide scientific community, due to the multidisciplinary research focus of the IPSL, which facilitates the compilation of different types of observations, from satellite to buoys measurements. The portal contains standardised information about each of the datasets as part of the meta-data, together with links to relevant publications, principal investigators (PIs) and to the data distribution sources. Also plots showing potential usage of the data are shown. This article compiles all the datasets that form the LABEX L-IPSL Arctic metadata portal, including the description of the metadata format develop-ment as well as the schematic content of the dataset template.
2 Methodology
The objective of this paper is to highlight why the portal is a useful tool for the IPSL and also for the scien-tific community focussed on Arctic research. The idea was not to develop an innovative technique to design a metadata portal, therefore the reader should not expect a technical paper showing the code of the portal interface development. Nevertheless, the motivation for the chosen metadata format is explained in Subsec-tion 2.1.
The development of the portal started in September 2013 and was initially planned as a one year task within the LABEX L-IPSL program. It was finally launched in December 2014. The portal is now publicly visible (http://climserv.ipsl.polytechnique.fr/arcticportal/). The portal interface was based on the LABEX L-IPSL Climatology data portal, which is still in preparation, hence the delay with some technical aspects. Despite these delays, all existing datasets collected prior to December 2014 are included in the LABEX L-IPSL Arctic data portal.
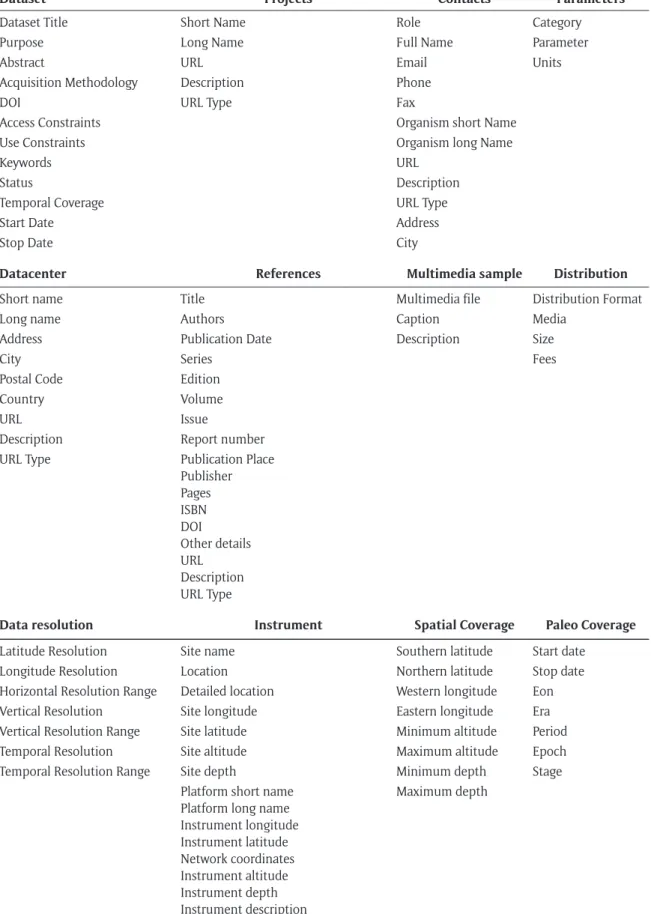
The process of dataset integration was challenging; first the identification of all the potential groups and researchers involved with Arctic observations was carried out and a list of contact details created. Due to the different formats and levels of data processing as well as the common lack of an unified way of storing metadata, a standardised data template (Table 1) was created and distributed within the contacts list; the development of the metadata template is explained below (Subsection 2.1).
It is worth pointing out that not all the fields from the template were filled out (Table 1), on the one hand because some of them are not relevant to specific datasets and on the other hand because some metadata information was not available by interviewing the contacts nor by online searching. Once the portal inter-face is finalised, future observations and datasets updates will be done directly by the PIs or data coordina-tors. This is one of the final aims of the portal, i.e. to be a public tool for people linked to the IPSL.
2.1 Development of the metadata scheme
When embarking on the development of a metadata portal, one starts by looking for a metadata standard format. However, one quickly realises the fact that there is not one standard format, but many different ones. Some are built to meet generic needs, such as the International Organization for Standardization (ISO) standards; others on the other hand are thought for a specific community (see for example the meta-data standards for Marine metameta-data https://marinemetameta-data.org/conventions/vocabularies). In the case or earth science, many metadata standards exist to describe the observations; the ISO 19115 standard defines a general schema to provide information on the identification, extent, quality, spatial and temporal aspects, content, spatial reference, data representation, distribution and other properties of digital geographic data and services. To document a dataset including the description of the platform or the acquisition sensor, it is necessary to include other ISO schemes, such as ISO 19115-2.
For the LABEX L-IPSL Arctic portal, it was decided to rely on an already widely used standard format, the Global Change Master Directory (GCMD) Directory Interchange Format (DIF), which provides metadata lists including both the elements necessary for the description of the dataset and those useful to describe the acquisition sensors and platforms (Table 1). The decision to choose DIF over ISO 19115-1 (and -2) was taken firstly because DIF had been already used for IPSL meta-catalogue projects, hence facilitating and speeding up the metadata building process. Due to time limitations (the whole portal had to be devel-oped in one year) and because DIF presents a simpler package than ISO, the former appeared to be more suitable for the portal needs. Another important point is that the different datasets gathered for the por-tal present different granularity and there is a clear heterogeneity within observations, which made the process of defining datasets more complex. The use of DIF facilitated this last point due to its flexibility in datasets definition.
Dataset Projects Contacts Parameters
Dataset Title Short Name Role Category
Purpose Long Name Full Name Parameter
Abstract URL Email Units
Acquisition Methodology Description Phone
DOI URL Type Fax
Access Constraints Organism short Name
Use Constraints Organism long Name
Keywords URL
Status Description
Temporal Coverage URL Type
Start Date Address
Stop Date City
Datacenter References Multimedia sample Distribution
Short name Title Multimedia file Distribution Format
Long name Authors Caption Media
Address Publication Date Description Size
City Series Fees
Postal Code Edition
Country Volume
URL Issue
Description Report number
URL Type Publication Place
Publisher Pages ISBN DOI Other details URL Description URL Type
Data resolution Instrument Spatial Coverage Paleo Coverage
Latitude Resolution Site name Southern latitude Start date
Longitude Resolution Location Northern latitude Stop date
Horizontal Resolution Range Detailed location Western longitude Eon
Vertical Resolution Site longitude Eastern longitude Era
Vertical Resolution Range Site latitude Minimum altitude Period
Temporal Resolution Site altitude Maximum altitude Epoch
Temporal Resolution Range Site depth Minimum depth Stage
Platform short name Platform long name Instrument longitude Instrument latitude Network coordinates Instrument altitude Instrument depth Instrument description Maximum depth
Table 1: Summary of all the metadata included in the portal for each dataset.
The metadata scheme used to document the different datasets is built upon the DIF (DIF Writer’s Guide, 2014 Global Change Master Directory, NASA, http://gcmd.nasa.gov/add/difguide/). Some meta-data were added to the list provided by the DIF, such as a field to document the Digital Object Identifier (DOI) of the dataset or the ability to describe a network of sensors. The DIF is a metadata format used to
create directory entries that describe scientific data sets. A DIF holds a collection of fields, with specific information about the data. The DIF format defines three groups of metadata: required, highly recom-mended and recomrecom-mended metadata, providing relatively large freedom to document a dataset. The mandatory metadata refers to the minimum information required to identify and access a dataset. This includes the title and summary of the dataset and a link to the data centre hosting the dataset. The DIF is compliant with the ISO 19115 metadata standard, i.e. the information included in a DIF file covers the required one by the ISO 19115 standard. The GCMD also provides predefined names lists for several of the DIF metadata fields. These lists allow us to limit the choices for these fields, avoiding having different names or acronyms for the same object (for example, the list of categories of geophysical parameters or the list of instrumental platform types). For the geophysical parameters, the standard names defined by the Climate and Forecast standard (http://cfconventions.org/) were also used to complement the pre-defined names lists proposed by the GCMD. This standard is widely used by the community of climate studies and was recently incorporated as an Open Geospatial Consortium (OGC) standard in connection with the Network Common Data Form (NetCDF) file format.
Following the recommendations of the Infrastructure for Spatial Information in the European Community directive (INSPIRE, http://inspire.ec.europa.eu/) regarding the metadata access (Table 1), the portal aims to facilitate the access to the documentation of the datasets. The INSPIRE directive, an European Union initiative, enables the sharing of environmental spatial information among public sector organizations and better facilitate public access to spatial information across Europe. One of the improvements of the portal interface since its creation is the auto-completion tool with the DIF predefined name list. This tool will allow the future user to add a new dataset or update and existent one, without the need of the DIF or further background information or knowledge; this will allow a wider community to have access to the metadata template.
3 Dataset Description
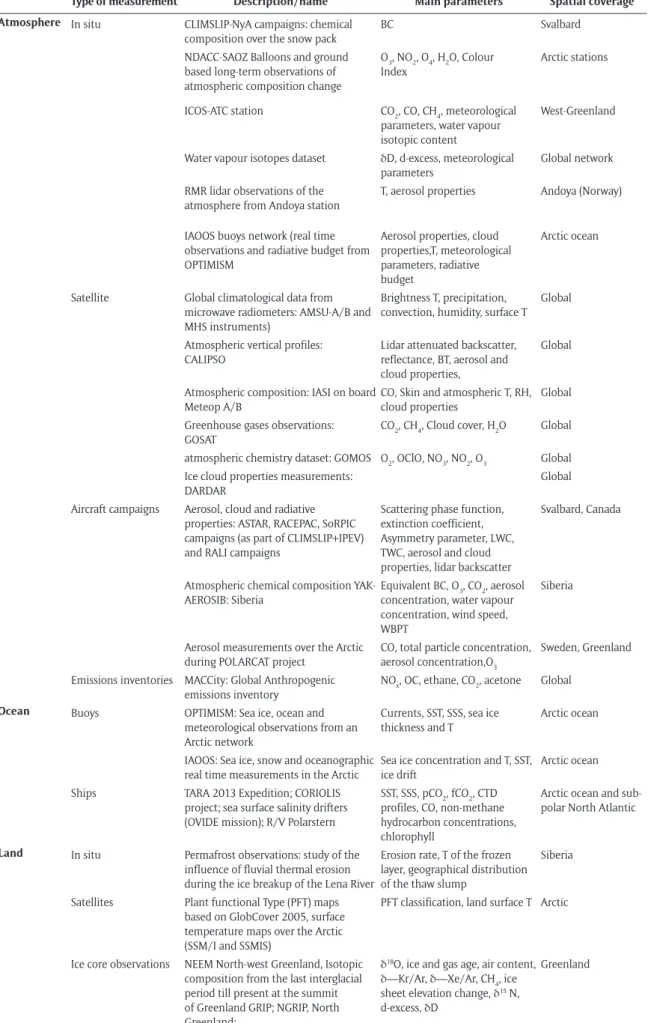
Due to the large number of datasets included in the portal it was decided to gather them in different cat-egories, summarised in Table 2. The datasets are first divided in three main categories (atmosphere, ocean and land) based on where the observations are carried out; although some datasets include observations for more than one type. The second categorisation is made according to the type of measurement: in situ observations or remotely sensed observations from satellites and aircraft campaigns.
As part of the metadata portal we have also added links to additional observations that are carried out in collaboration with other institutes; this is the case of the project Climate impacts of short-lived pol-lutants and methane in the Arctic-Agence Nationale de Recherche (CLIMSLIP-ANR) project, aimed at the examination of the roles of these short-lived pollutants in the Arctic and their impacts on the regional climate. The project includes data collection and analysis as well as regional and global modelling. The datasets linked with the CLIMSLIP-ANR project are CLIMLISP-NyA, ASTAR, RACEPAC and SoRPIC and YAK-AEROSIB and POLARCAT fields campaigns (Table 2). One important feature of the portal is the search tool that enables the user to locate datasets using the categories from Table 2 as well as using keywords (http:// climserv.ipsl.polytechnique.fr/arcticdatadb/Datasets/search). The search tool available at the moment is just a preliminary sample where one can search by specific category, for example by variable. The final idea is an open search with key words that will not prevent the multidisciplinary public from accessing any kind of metadata, even if it is out of their area of expertise.
4 Dataset Availability
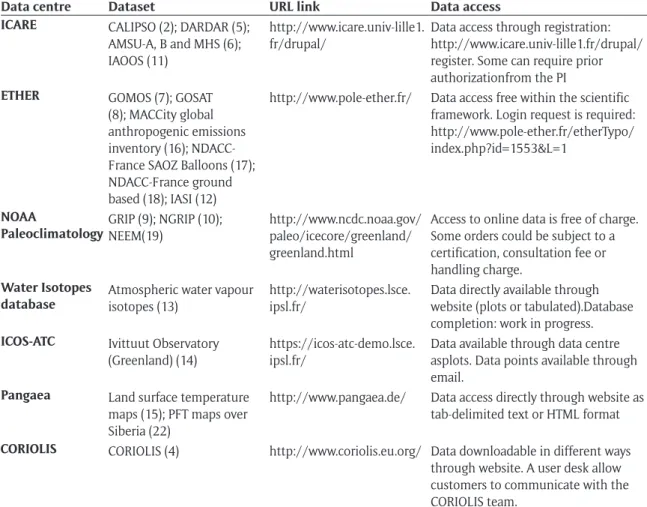
The metadata associated with this paper is dedicated to the public domain and is available through the IPSL Mesocentre, which is a service of data and computation of the LABEX L-IPSL, http://climserv.ipsl.polytech-nique.fr/arcticportal/. As mentioned above, some of the data are already available for scientific use, Table 3 lists the different data-centres that can be accessed.
The datasets linked to the CLIMSLIP-ANR (1, 3, 23, 24, 26, 30 and 32) project mentioned before are not yet associated to a data-centre, the same happens for OPTIMISM (20), permafrost investigations in central Yakutia/ Siberia (21), R/V POLARSTERN (25), RALI (27), RMR lidar observations in Andoya/Norway (28), OVIDE mis-sion (29) and TARA Expedition 2013 (31).
The fact that many of the datasets are not yet stored in public data-centres, highlights the importance of the creation of the LABEX L-IPSL Arctic data portal, which allows the public visibility of these observations. The portal has also helped gathering, for the first time, the metadata information in a standardised format, crucial for example for climate models evaluation.
Type of measurement Description/name Main parameters Spatial coverage Atmosphere In situ CLIMSLIP-NyA campaigns: chemical
composition over the snow pack
BC Svalbard
NDACC-SAOZ Balloons and ground based long-term observations of atmospheric composition change
O3, NO2, O4, H2O, Colour Index
Arctic stations
ICOS-ATC station CO2, CO, CH4, meteorological parameters, water vapour isotopic content
West-Greenland
Water vapour isotopes dataset δD, d-excess, meteorological parameters
Global network RMR lidar observations of the
atmosphere from Andoya station
T, aerosol properties Andoya (Norway)
IAOOS buoys network (real time observations and radiative budget from OPTIMISM
Aerosol properties, cloud properties,T, meteorological parameters, radiative budget
Arctic ocean
Satellite Global climatological data from microwave radiometers: AMSU-A/B and MHS instruments)
Brightness T, precipitation, convection, humidity, surface T
Global
Atmospheric vertical profiles: CALIPSO
Lidar attenuated backscatter, reflectance, BT, aerosol and cloud properties,
Global
Atmospheric composition: IASI on board Meteop A/B
CO, Skin and atmospheric T, RH, cloud properties
Global Greenhouse gases observations:
GOSAT
CO2, CH4, Cloud cover, H2O Global atmospheric chemistry dataset: GOMOS O2, OClO, NO3, NO2, O3 Global Ice cloud properties measurements:
DARDAR
Global Aircraft campaigns Aerosol, cloud and radiative
properties: ASTAR, RACEPAC, SoRPIC campaigns (as part of CLIMSLIP+IPEV) and RALI campaigns
Scattering phase function, extinction coefficient, Asymmetry parameter, LWC, TWC, aerosol and cloud properties, lidar backscatter
Svalbard, Canada
Atmospheric chemical composition YAK-AEROSIB: Siberia
Equivalent BC, O3, CO2, aerosol concentration, water vapour concentration, wind speed, WBPT
Siberia
Aerosol measurements over the Arctic during POLARCAT project
CO, total particle concentration, aerosol concentration,O3
Sweden, Greenland Emissions inventories MACCity: Global Anthropogenic
emissions inventory
NOx, OC, ethane, CO2, acetone Global Ocean Buoys OPTIMISM: Sea ice, ocean and
meteorological observations from an Arctic network
Currents, SST, SSS, sea ice thickness and T
Arctic ocean
IAOOS: Sea ice, snow and oceanographic real time measurements in the Arctic
Sea ice concentration and T, SST, ice drift
Arctic ocean
Ships TARA 2013 Expedition; CORIOLIS
project; sea surface salinity drifters (OVIDE mission); R/V Polarstern
SST, SSS, pCO2, fCO2, CTD profiles, CO, non-methane hydrocarbon concentrations, chlorophyll
Arctic ocean and sub-polar North Atlantic
Land In situ Permafrost observations: study of the influence of fluvial thermal erosion during the ice breakup of the Lena River
Erosion rate, T of the frozen layer, geographical distribution of the thaw slump
Siberia
Satellites Plant functional Type (PFT) maps based on GlobCover 2005, surface temperature maps over the Arctic (SSM/I and SSMIS)
PFT classification, land surface T Arctic
Ice core observations NEEM North-west Greenland, Isotopic composition from the last interglacial period till present at the summit of Greenland GRIP; NGRIP, North Greenland;
δ18O, ice and gas age, air content,
δ―Kr/Ar, δ―Xe/Ar, CH4, ice
sheet elevation change, δ15 N,
d-excess, δD
Greenland
Table 2: Summary of all the datasets included in the Arctic metadata portal, illustrated in different categories to facilitate the visualisation.
Data centre Dataset URL link Data access ICARE CALIPSO (2); DARDAR (5);
AMSU-A, B and MHS (6); IAOOS (11)
http://www.icare.univ-lille1. fr/drupal/
Data access through registration: http://www.icare.univ-lille1.fr/drupal/ register. Some can require prior authorizationfrom the PI ETHER GOMOS (7); GOSAT
(8); MACCity global anthropogenic emissions inventory (16); NDACC-France SAOZ Balloons (17); NDACC-France ground based (18); IASI (12)
http://www.pole-ether.fr/ Data access free within the scientific framework. Login request is required: http://www.pole-ether.fr/etherTypo/ index.php?id=1553&L=1
NOAA
PaleoclimatologyGRIP (9); NGRIP (10); NEEM(19) http://www.ncdc.noaa.gov/paleo/icecore/greenland/ greenland.html
Access to online data is free of charge. Some orders could be subject to a certification, consultation fee or handling charge.
Water Isotopes
database Atmospheric water vapour isotopes (13) http://waterisotopes.lsce.ipsl.fr/ Data directly available through website (plots or tabulated).Database completion: work in progress. ICOS-ATC Ivittuut Observatory
(Greenland) (14)
https://icos-atc-demo.lsce. ipsl.fr/
Data available through data centre asplots. Data points available through email.
Pangaea Land surface temperature maps (15); PFT maps over Siberia (22)
http://www.pangaea.de/ Data access directly through website as tab-delimited text or HTML format CORIOLIS CORIOLIS (4) http://www.coriolis.eu.org/ Data downloadable in different ways
through website. A user desk allow customers to communicate with the CORIOLIS team.
Table 3: List of the data-centres that contain part or all the datasets from the portal presented in this paper. The numbers correspond to the item number of each dataset described before as numbered in the supplementary material document.
5 Applications of the Arctic Metadata Portal
The different observations gathered in the metadata portal will improve current knowledge about processes in the Arctic, as well as improve regional and global climate models based on evaluation using observations. In this section, four examples of scientific applications of the portal are presented.
5.1 Land cover mapping from satellite observations
It is known that high-latitude ecosystems play an important role in the global carbon cycle and also in the climate system. Moreover these ecosystems have experienced rapid environmental change, showing the need to increase accurate land cover observations to monitor these changes and also to use the observations to improve current Earth system models initialisations (Ottlé et al., 2013). These models require specific land cover classification systems based on Plant Functional Types (PFTs).
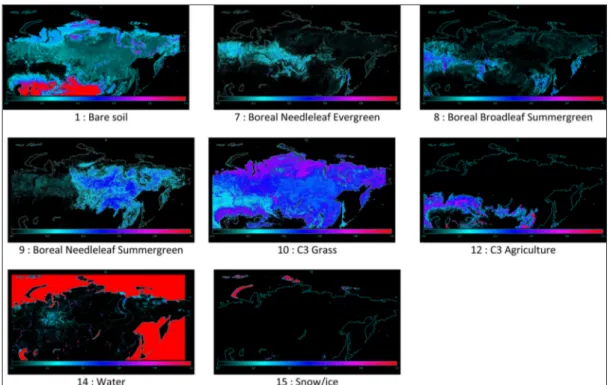
The dataset presented here comprises PFTs maps for the Organising Carbon and Hydrology In Dynamic Ecosystems (ORCHIDEE) model – the land surface model of the IPSL earth system model (http: //labex. ipsl.fr/orchidee/) – at one kilometre resolution that have been produced across Siberia (see Figure 2). A complete description for the ORCHIDEE model was first described by Krinner et al. (2005). These PFTs maps are based on the land cover product GlobCover Land Cover maps 2005 (European Space Agency initiative) with an updated cross-walking approach to link land cover classes to the 16 PFT classes in ORCHIDEE. Ottlé et al. (2013), who is the PI of this dataset (dataset number 22 in the supplementary material) compares over Siberia, multiple land cover data sets against one another and with auxiliary data to identify key uncertainties that contribute to variability in PFT classifications that would intro-duce errors in Earth system modelling. This dataset highlights the importance of accurate observations to improve current climate models.
Figure 2: Plant Functional Types (PFT) maps used in ORCHIDEE land surface model. The respective frac-tions of the following eight classes are represented in colour scale, from blue (0%) to red (100%): bare soil (PFT1), boreal needle-leaf evergreen (PFT7), boreal broad-leaf summer-green (PFT8), boreal needle-leaf sum-mer-green (PFT9), C3 grass (PFT10), C3 agriculture (PFT12), water (PFT14), and snow/ice (PFT15) (Source (Ottlé et al., 2013)).
5.2 Arctic clouds: models versus observations
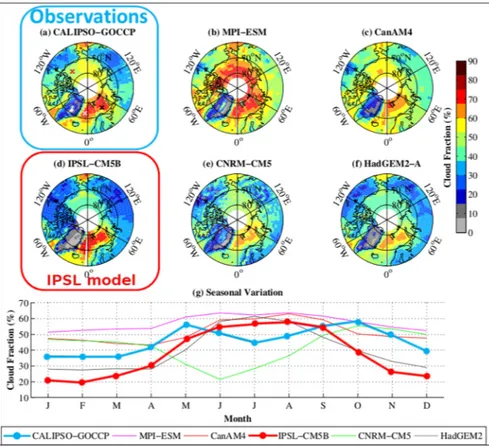
Clouds are also an important factor in terms of climate model uncertainties when estimating climate sensitiv-ity, since they are the primary modulators of the Earth’s radiation budget (Cesana and Chepfer, 2012). Focus-sing on the Arctic, Figure 3 shows Arctic annual mean low-level cloud cover observed by the General Circula-tion Model (GCM)-Oriented Cloud-Aerosol Lidar and Infrared Pathfinder Satellite ObservaCircula-tion CALIPSO Cloud Product (GOCCP), designed to evaluate the cloudiness simulated by GCMs (Chepfer et al, 2010) and compared the Coupled Model Intercomparison Project Phase 5 (CMIP5) climate models (Dufresne et al., 2013; Taylor
et al., 2012). The annual mean low-level cloud cover (z <3.36 km) observed by CALIPSO-GOCCP in the Arctic
shows that the atmosphere contains small but significant amount of low clouds (30% to 45%), with the exception of Greenland and high regions. Above the ocean, the moister atmosphere produces a larger low-level cloud cover (typically from 60 to 80%). Their significantly asymmetric distribution is linked to the sea surface temperature with larger cloud coverage above the warmest ocean (Barents and Greenland Seas) and smaller above the cold Beaufort Sea. All CMIP5 models, except the Max Planck Institute-Earth System Model (MPI-ESM), reproduce this asymmetry, but they do not reproduce the correct fraction of low cloud cover, showing a large inter-model spread, highlighting the inability of representing clouds by models.
Dataset (2) (supplementary material) from the LABEX L-IPSL Arctic metadata portal includes global satel-lite observations of cloud and aerosols vertical profiles by CALIPSO (http://smsc.cnes.fr/CALIPSO/), which is a Franco-American mission launched by the NASA to provide vertical profiles of the atmosphere, use-ful for learning more about the vertical distribution of the properties of aerosols and thin clouds. There are three instruments on-board CALIPSO: the Cloud-Aerosol Lidar with Orthogonal Polarization (CALIOP), the Imaging Infrared Radiometer (IRR) and a Wide Field Camera (WFC). Of particular interest for the por-tal, CALIPSO output robustly document the frequent presence of low level clouds over the Arctic, of great importance for Arctic research. This dataset is also stored on ICARE data centre (Table 3).
5.3 Arctic aerosols: satellite observations and model output comparison
As mentioned in the previous subsection, aerosol vertical profiles from CALIPSO are also included in the portal (Dataset (2) from the supplementary material). Ancellet et al. (2014) showed that the CALIOP lidar Level 1 uncorrected product is a useful tool for mapping aerosol vertical and horizontal distribution. Under-standing the sources of aerosols in the Arctic is important because, despite the fact that there are few
Figure 3: Annual mean Arctic low cloud cover. (a) Observations CALIPSO-GOCCP (highlighted with a blue box). (b–f) CMIP5 Climate models, with the IPSL-CM5B highlighted with a red box. (g) Seasonal variation over open ocean (60°N―82°N without land), blue circles represents de observations CALIPSO-GOCCP and red circles the IPSL-CM5B model (Modified from Cesana and Chepfer (2012)).
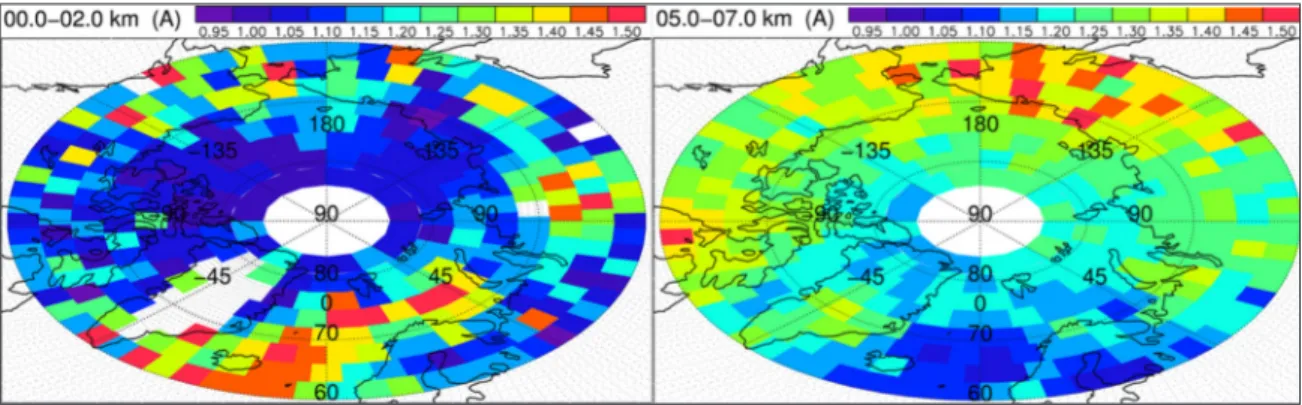
pollution sources, there is long-range transport of anthropogenic and biomass burning emissions from lower latitudes, mostly from Europe and Asia (Ancellet et al., 2014; Law and Stohl, 2007; Law et al., 2014). Figure 4 shows the distribution of the CALIPSO aerosol backscatter ratio, defined as the backscattering by particle versus total scattering, during spring 2008 for two altitude ranges.
As well as improving observations of aerosol distribution and its sources, CALIOP observations can help to validate and improve current climate models, since global climate models tend to underestimate aerosols concentrations in the Arctic (Eckhardt, 2015).
5.4 Arctic sea ice monitoring from in situ observations
The final example of scientific applications of the portal illustrates data from the Observing processes impacting the sea ice mass balance from in situ measurements (OPTIMISM) project (Dataset (20) from the supplementary material). This is an on going effort launched in 2009, which consists on a network of auto-mated buoys providing real-time measurement of sea-ice thickness and fluxes at the interfaces in the Arctic ocean. There are still no publications, animations of the buoys’ trajectories and preliminary observations are displayed on the project website. These include thermal profiles in the air/ice/ocean interface and ice thick-ness measurements (http://optimism.locean-ipsl.upmc.fr/).
6 Concluding Remarks
The LABEX L-IPSL Arctic metadata portal presented here improves the visibility of the different observations carried out within the IPSL and links with other institutes as well as new activities related to the French Chantier Arcticque. It will facilitate the use of the observations for the evaluation of theoretical models, especially the global IPSL climate model and regional models focussed on the Arctic. In the future the datasets will be updated directly by the researchers involved. It will also be possible to include new datasets with a specific interactive tool, which will include an auto-completion tool to facilitate the task. The search catalogue tool (http://climserv.ipsl.polytechnique.fr/arcticdatadb/Datasets/search), which is currently under development, will allow the public to search by the categories shown in Table 2 as well
as by using keywords listed in each dataset. There is scope to also include climate models outputs and cli-matological data to the existing datasets, as well as the potential for expanding to other national and inter-national projects. Currently there is not a global initiative (e.g. GCMD) to harvest the metadata; however as part of the French Chantier Arcticque there is scope to achieve this in the future.
7 Competing Interest
The authors declare that they have no competing interests.
8 Acknowledgements
This work benefited from the support of the French Agence Nationale de la Recherche (ANR) grant ANR-10-LABX-18-01 of the national Programme Investissements d’Avenir.
9 References
Ancellet, G., Pelon, J., Blanchard, Y., Quennehen, B., Bazureau, A., Law, K. S., and S. A. (2014) Transport of aero-sol to the arctic: analysis of caliop and french aircraft data during the spring 2008 polarcat campaign.
Atmospheric Chemistry and Physics, 14: 8235–8254. DOI: http://dx.doi.org/10.5194/acp-14-8235-2014
Budikova, D. (2009) Role of arctic sea ice in global atmospheric circulation: A review. Global and Planetary
Change, 68: 149–163. DOI: http://dx.doi.org/10.1016/j.gloplacha.2009.04.001
Cesana, G., & Chepfer, H. (2012) How well do climate models simulate cloud vertical structure? A compari-son between calipso-goccp satellite observations and cmip5 models. Geophys. Res. Lett, 39: 1–6. DOI: http://dx.doi.org/10.1029/2012GL053153
Chepfer, H., Bony, S., Winker, D., Cesana, G., Dufresne, J. L., Minnis, P., Stubenrauch, C. J., & Zeng, S. (2010) The gcm-oriented calipso cloud product (calipso-goccp). Journal of Geophysical Research: Atmospheres,
115(D4): 1–13. DOI: http://dx.doi.org/10.1029/2009jd012251
Dufresne, J., Foujols, D. S. M., Caubel, A., Marti, O., Aumont, O., Balkanski, Y., Bekki, S., Bellenger, H., Benshila, R., Bony, S., Bopp, L., Braconnot, P., Brockmann, P., Cadule, P., Cheruy, F., Codron, F., Cozic, A., Cugnet, D., de Noblet, N., Duvel, J.-P., Eth, C., Fairhead, L., Fichefet, T., Flavoni, S., Friedlingstein, P., Grandpeix, J.-Y., Guez, L., Guilyardi, E., Hauglustaine, D., Hourdin, F., Idelkadi, A., Ghattas, J., Joussaume, S., Kageyama, M., Krinner, G., Labetoulle, S., Lahellec, A., Lefebvre, M.-P., Lefevre, F., Levy, C., Li, Z. X., Lloyd, J., Lott, F., Madec, G., Mancip, M., Marchand, M., Masson, S., Meurdesoif, Y., Mignot, J., Musat, I., Parouty, S., Polcher, J., Rio, C., Schulz, M., Swingedouw, D., Szopa, S., Talandier, C., Terray, P., Viovy, N., & Vuichard, N. (2013) Climate change projections using the ipsl-cm5 earth system model: from cmip3 to cmip5. Climate Dynamics,
40(9–10): 2123–2165. DOI: http://dx.doi.org/10.1007/s00382-012-1636-1
Eckhardt, S. (2015) In preparation.
Krinner, G., Viovy, N., de Noblet-Ducoudré, N., Ogée, J., Polcher, J., Friedlingstein, P., Ciais, P., Sitch, S., & Pren-tice, I. C. (2005) A dynamic global vegetation model for studies of the coupled atmosphere-biosphere system. Global Biogeochemical Cycles, 19: GB1015. DOI: http://dx.doi.org/10.1029/2003GB002199 Law, K. S., & Stohl, A. (2007) Arctic air pollution: Origins and impacts. Science, 315: 1537–1540.
Law, K. S., Stohl, A., Quinn, P. K., Brock, C., Burkhart, J., Paris, J.-D., Ancellet, G., Singh, H. B., Roiger, A., Schlager, H., Dibb, J., Jacob, D. J., Arnold, S. R., Pelon, J., & Thomas, J. L. (2014) Arctic air pollution: Figure 4: Map of the 532 nm backscatter ratio using the April 2008 filtered level 1 CALIOP data in the 0–2 km (left) and in the 5–7 km (right) altitude range. Colour scales are in relative units (modified from Ancel-let et al. (2014)).
new insights from polarcat-ipy. BAMS American Meteorological Society, early online releases. DOI: http:// dx.doi.org/10.1175/BAMS-D-13-00017.1
Lemke, P., Ren, J., Alley, R. B., Allison, I., Carrasco, J., Flato, G., Fujii, Y., Kaser, G., Mote, P., Thomas, R. H., & Zhang, T. (2007) Observations: changes in snow, ice and frozen ground. In: Climate change 2007: The
physical science basis. Contribution of working group i to the fourth assessment report of the intergovern-mental panel on climate change. Cambridge University Press, Cambridge, United Kingdom and New York,
NY, USA., Chapter 4: 996pp.
Ottlé, C., Lescure, J., Maignan, F., Poulter, B., Wang, T., & Delbart, N. (2013) Use of various remote sensing land cover products for plant functional type mapping over siberia. Earth System Science Data, 5: 331–348. DOI: http://dx.doi.org/10.5194/essd-5-331-2013
Rignot, E., & Kanagaratnam, P. (2006) Changes in the Velocity Structure of the Greenland Ice Sheet. Science,
311(5763): 986 – 990. DOI: http://dx.doi.org/10.1126/science.1121381. PMid: 16484490.
Schrama, E. J. O., & Wouters, B. (2011) Revisiting Greenland ice sheet mass loss observed by GRACE. Journal
of Geophysical Research, 116: B02407. DOI: http://dx.doi.org/10.1029/2009JB006847
Taylor, K. E., Stouffer, R. J., & Meehl, G. A. (2012) An overview of cmip5 and the experiment design. Bull. Amer.
Meteor. Soc., 93: 485–498. DOI: http://dx.doi.org/10.1175/BAMS-D-11-00094.1
van de Wal, R. S. W., Boot, W., van den Broeke, M. R., Smeets, C. J. P. P., Reijmer, C. H. , Donker, J. J. A., & Oerlemans, J. (2008) Large and Rapid Melt-Induced Velocity Changes in the Ablation Zone of the Green-land Ice Sheet. Science, 321(5885): 111–113. DOI: http://dx.doi.org/10.1126/science.1158540. PMid: 18599784.
Velicogna, I. (2009) Increasing rates of ice mass loss from the Greenland and Antarctic ice sheets revealed by GRACE. Geophysical Research Letters, 36: L19503. DOI: http://dx.doi.org/10.1029/2009GL040222
How to cite this article: Cordero-LLana, L, Ramage, K, Law, K S and Keckhut, P 2016 LABEX L-IPSL Arctic Metadata
Portal. Data Science Journal, 15: 2, pp. 1-11, DOI: http://dx.doi.org/10.5334/dsj-2016-002
Submitted: 07 May 2015 Accepted: 19 November 2015 Published: 12 January 2016
Copyright: © 2016 The Author(s). This is an open-access article distributed under the terms of the Creative
Commons Attribution 3.0 Unported License (CC-BY 3.0), which permits unrestricted use, distribution, and reproduction in any medium, provided the original author and source are credited. See http://creativecommons.org/ licenses/by/3.0/.
Data Science Journal is a peer-reviewed open access journal published by Ubiquity OPEN ACCESS Press.