HAL Id: hal-01805262
https://hal.archives-ouvertes.fr/hal-01805262
Submitted on 27 Oct 2020
HAL is a multi-disciplinary open access
archive for the deposit and dissemination of
sci-entific research documents, whether they are
pub-lished or not. The documents may come from
teaching and research institutions in France or
abroad, or from public or private research centers.
L’archive ouverte pluridisciplinaire HAL, est
destinée au dépôt et à la diffusion de documents
scientifiques de niveau recherche, publiés ou non,
émanant des établissements d’enseignement et de
recherche français ou étrangers, des laboratoires
publics ou privés.
carbon budget associated with emission scenarios,
climate projections, and ecosystem simulations using the
ISI-MIP results
K. Nishina, A. Ito, P. Falloon, D. Friend, D. Beerling, P. Ciais, D. Clark, R.
Kahana, E. Kato, W. Lucht, et al.
To cite this version:
K. Nishina, A. Ito, P. Falloon, D. Friend, D. Beerling, et al.. Decomposing uncertainties in the
future terrestrial carbon budget associated with emission scenarios, climate projections, and ecosystem
simulations using the ISI-MIP results. Earth System Dynamics, European Geosciences Union, 2015,
6 (2), pp.435 - 445. �10.5194/esd-6-435-2015�. �hal-01805262�
www.earth-syst-dynam.net/6/435/2015/ doi:10.5194/esd-6-435-2015
© Author(s) 2015. CC Attribution 3.0 License.
Decomposing uncertainties in the future terrestrial
carbon budget associated with emission scenarios,
climate projections, and ecosystem simulations using
the ISI-MIP results
K. Nishina1, A. Ito1, P. Falloon2, A. D. Friend3, D. J. Beerling4, P. Ciais5, D. B. Clark6, R. Kahana2, E. Kato1,9, W. Lucht7, M. Lomas4, R. Pavlick8, S. Schaphoff7, L. Warszawaski7, and T. Yokohata1
1National Institute for Environmental Studies, 16-2, Onogawa, Tsukuba, Ibaraki, Japan 2Met Office Hadley Centre, FitzRoy Road, Exeter, Devon, EX1 3PB, UK
3Department of Geography, University of Cambridge, Downing Place, Cambridge CB2 3EN, UK 4Department of Animal and Plant Sciences, University of Sheffield, Sheffield S10 2TN, UK
5Laboratoire des Sciences du Climat et de l’Environment, Joint Unit of CEA-CNRS-UVSQ, Gif-sur-Yvette, France
6Centre for Ecology and Hydrology, Wallingford, OX10 8BB, UK
7Potsdam Institute for Climate Impact Research, Telegraphenberg A 31, 14473, Potsdam, Germany 8Max Planck Institute for Biogeochemistry, Hans-Knöll-Str. 10, 07745 Jena, Germany
9Institute of Applied Energy, 105-0003 Tokyo, Japan
Correspondence to: K. Nishina (nishina.kazuya@nies.go.jp)
Received: 16 September 2014 – Published in Earth Syst. Dynam. Discuss.: 10 October 2014 Revised: 22 May 2015 – Accepted: 22 June 2015 – Published: 13 July 2015
Abstract. We examined the changes to global net primary production (NPP), vegetation biomass carbon
(VegC), and soil organic carbon (SOC) estimated by six global vegetation models (GVMs) obtained from the Inter-Sectoral Impact Model Intercomparison Project. Simulation results were obtained using five global cli-mate models (GCMs) forced with four representative concentration pathway (RCP) scenarios. To clarify which component (i.e., emission scenarios, climate projections, or global vegetation models) contributes the most to uncertainties in projected global terrestrial C cycling by 2100, analysis of variance (ANOVA) and wavelet clus-tering were applied to 70 projected simulation sets. At the end of the simulation period, changes from the year 2000 in all three variables varied considerably from net negative to positive values. ANOVA revealed that the main sources of uncertainty are different among variables and depend on the projection period. We determined that in the global VegC and SOC projections, GVMs are the main influence on uncertainties (60 % and 90 %, respectively) rather than climate-driving scenarios (RCPs and GCMs). Moreover, the divergence of changes in vegetation carbon residence times is dominated by GVM uncertainty, particularly in the latter half of the 21st century. In addition, we found that the contribution of each uncertainty source is spatiotemporally heterogeneous and it differs among the GVM variables. The dominant uncertainty source for changes in NPP and VegC varies along the climatic gradient. The contribution of GVM to the uncertainty decreases as the climate division be-comes cooler (from ca. 80 % in the equatorial division to 40 % in the snow division). Our results suggest that to assess climate change impacts on global ecosystem C cycling among each RCP scenario, the long-term C dynamics within the ecosystems (i.e., vegetation turnover and soil decomposition) are more critical factors than photosynthetic processes. The different trends in the contribution of uncertainty sources in each variable among climate divisions indicate that improvement of GVMs based on climate division or biome type will be effective. On the other hand, in dry regions, GCMs are the dominant uncertainty source in climate impact assessments of vegetation and soil C dynamics.
1 Introduction
Terrestrial ecosystems play important roles in the C cycling of climate systems and provide various ecosystem services (e.g., water supply and wild habitats for biodiversity); how-ever, these ecosystem functions are threatened by climate change (Scholze et al., 2006; Mooney et al., 2009; Ost-berg et al., 2013). Previous model intercomparison studies (e.g., VEMAP (Kittel et al., 1995), dynamic global vege-tation models (DGVMs) (Cramer et al., 1999; Sitch et al., 2008), Coupled Carbon Cycle Climate Model Intercompar-ison Project (C4MIP) (Friedlingstein et al., 2006), and The fifth phase of the Coupled Model Intercomparison Project (CMIP5) Arora et al., 2013; Jones et al., 2013) have demon-strated a lack of coherence in future projections of terrestrial C cycling for different global land models because of differ-ences in their representations of system processes. For cli-mate change impact assessments, the cascade of uncertainty sources must be considered (Wilby and Dessai, 2010; Fal-loon et al., 2014). Greenhouse gas concentrations, tempera-ture, and precipitation are critical factors in determining the feedback of terrestrial ecosystems in response to atmospheric carbon dioxide (CO2) (Seneviratne et al., 2006). These fac-tors could become more important for terrestrial ecosystem C cycling under future higher CO2 concentrations and cli-mate change conditions (Gerten et al., 2005). The recent International Panel on Climate Change assessments (AR5) took anthropogenic CO2emission uncertainties into account in a representative concentration pathway (RCP) scenario (Moss et al., 2010; Van Vuuren et al., 2011). Future projected changes in temperature and precipitation have large spatial and temporal uncertainties even for the same radiative forc-ing levels because of the different structures and parameters used in global climate models (GCMs) (Knutti and Sedláˇcek, 2013). These differences could affect the global C budget of terrestrial ecosystems. Global vegetation models (GVMs) such as (DGVMs and components of earth system models also have inherently large uncertainties because of differ-ences in model structures and parameters (e.g., Friedlingstein et al., 2006; Sitch et al., 2008). Thus, various sources of un-certainty may cause divergence in projected C cycling.
For climate impact assessments and adaptations, different levels of uncertainty sources should be considered in order to manage climate change risks. Such information in im-pact assessments may benefit from experience gained in the climate-modeling community and vice versa (Falloon et al., 2014). For example, recently, the likelihood of the occur-rence of large Amazon dieback in this century has become lower in simulation studies (Cox et al., 2000; Sitch et al., 2008; Cook et al., 2012) because of the reduction of un-certainties in the projected precipitation in Amazon regions among GCMs (Sitch et al., 2008; Poulter et al., 2010; Cook et al., 2012). However, the improvement of vegetation
pro-cesses in this region could result in the improvement of lo-cal vegetation–climate feedbacks, which might contribute to changes in temperature and precipitation in this region (Sh-iogama et al., 2011). At the global scale, in earth system models in the CMIP5 study, the sensitivities in global land climate–carbon feedback varied considerably (Arora et al., 2013). The reduction of C budget uncertainties in ecosystem models could serve to reduce climate change uncertainties, particularly regarding the climate sensitivity of earth system models. In addition, determining which uncertainty source is dominant in the projection is an important aspect of rec-ognizing the limitations of ecosystem C cycling projections and climate impact assessments via GVM and GCM. How-ever, to date, how each uncertainty source (CO2 concentra-tion, GCM, and GVM) is important in regions and periods affected by climate change still remains to be clarified in cli-mate impact research.
In ecosystem climate impact assessments, how the uncer-tainties of climate impacts matter is still a challenging is-sue, in part due to the lack of standardized impact evalua-tion protocols. The Inter-Sectoral Impact Model Intercom-parison Project (ISI-MIP) is the first attempt to apply ensem-bles of both impact and climate models to obtain robust fu-ture assessments (Warszawski et al., 2014). In assessments of climate impacts on ecosystem functions, regionality is ex-tremely important for the severity and timing of impacts ow-ing to the different types of climate change in each region and the presence of different ecosystem types in different ar-eas (Warszawski et al., 2013; Friend et al., 2014). For com-prehensive climate impact assessments on ecosystems, it is necessary to possess spatiotemporal information for which uncertainty sources can be chosen or ignored, for which some processes contributed to uncertainty, and for which it is known how the contribution of each uncertainty source changed with time. Separation of the different sources of un-certainty in projections of ecosystem models in various as-pects can be used to comprehend the uncertainties and risks in climate impacts on ecosystem conditions and C cycling.
In this study, we examined the C dynamics in six GVMs obtained from the ISI-MIP. In the ISI-MIP, these GVMs were simulated using five GCMs forced with four newly devel-oped climate scenarios, i.e., RCP in the CMIP5 experiments (Taylor et al., 2012). In this model intercomparison project, an orthogonal experimental design with RCP, GCM, and GVM was adopted. In total, 70 independent simulation sets were used in this study, which enabled us to evaluate the rel-ative contributions to total uncertainty of the projection fac-tors (emission scenarios, climate projections, and GVMs) in terrestrial C cycling. Our objective was to explore the com-prehensive uncertainties in future global and regional terres-trial C projections by decomposing the uncertainty sources in terms of time, space, and processes.
Table 1.General properties of biome models.∗PFT indicates plant functional type.
GVM Resolution Vegetation Number of PFTs∗ Fire Nitrogen Soil temp function Permafrost
HYBRID4 720 × 360 DGVM 6 No Yes Exponential with optimum No
JeDi 192 × 145 DGVM 15 No no Exponential No
JULES 192 × 145 DGVM 5 No no Exponential Yes
LPJmL 720 × 360 DGVM 10 Yes no Lloyd & Taylor Yes
SDGVM 720 × 360 Fixed PFT 7 Yes Yes Optimum curve No
VISIT 720 × 360 Fixed PFT 16 Yes no Lloyd & Taylor No
RCP2.6 RCP4.5 RCP6.0 RCP8.5 Δ NPP [Pg−C Year − 1] −20 0 2 0 4 0 HadGEMIPSL MIROC GFDL NorESM Hybrid JeDi JULES LPJml SDGVM VISIT NPP Δ V egC [Pg−C] −200 0 200 400 V egC Δ SOC [Pg−C] −200 0 200 400 SOC Δ V
egC residence time [Year]
1970 2000 2050 2100 Year −4 0 4 8 12 1970 2000 2050 2100 Year 1970 2000 2050 2100 Year 1970 2000 2050 2100 Year V
egC Residence time
Figure 1.Global annual NPP, VegC stock, SOC stock, and VegC residence time changes. The boxplot summarizes the values at the end of the simulation period. Open circles represent outliers if the largest (or smallest) value is greater (or less) than 1.5 times the box length from the 75 % percentile (or 25 % percentile).
2 Data and methods
2.1 Model and simulation protocol
We examined the global annual changes in net primary pro-duction (NPP), vegetation biomass carbon stocks (VegC), and soil organic carbon (SOC) using six GVMs obtained from the ISI-MIP (Warszawski et al., 2014). In addition, we calculated the annual VegC residence time from annual mean VegC divided by annual NPP, which is an index of the turnover rates of plant parts including the mortality rates of individuals, processes modeled using baseline rates, climate sensitivities (including fire), and competitively induced mor-tality, and are affected indirectly through shifts in vegetation composition (Friend et al., 2014).
The GVMs used were HYBRID4 (Friend and White, 2000), JeDi (Pavlick et al., 2013), JULES (Clark et al., 2011),
LPJmL (Sitch et al., 2003), SDGVM (Woodward et al., 1995), and VISIT (Ito and Inatomi, 2012), which conducts model simulations under multiple GCMs and RCPs in the ISI-MIP. HYBRID4, JeDi, LPJmL, and JULES are DGVMs, and a fixed land cover map was used for the other models in this study. The general properties of the participating ecosys-tem models are summarized in Table 1. More detailed in-formation on each model can be found in Warszawski et al. (2013) and Friend et al. (2014).
These models were simulated partly in five GCMs with four RCP scenarios. HadGEM2-ES (HadGEM), IPSL-CM5A-LR (IPSL), MIROC-ESM-CHEM (MIROC), GFDL-ESM2M (GFDL), and NorESM1-M (NorESM) are the GCMs from a CMIP5 experiment (Taylor et al., 2012) with bias correction for temperature and precipitation performed by Hempel et al. (2013). In this study, to focus on climate
change impacts on terrestrial ecosystem C cycling, anthro-pogenic land-use changes were not considered in the simu-lation. Every GVM was used for a separate spin-up for each GCM, with the aim of bringing the carbon and water pools into equilibrium using detrended and bias-corrected daily climate inputs for 3 consecutive decades spanning 1951– 1980. The number of simulations for each GVM–GCM–RCP combination is summarized in the Supplement (Table S2). The global climate variables (atmospheric CO2 concentra-tion, global mean temperature anomaly 1T (◦C), and global precipitation anomaly 1P (%)) in each RCP scenario for all GCMs are summarized in the Supplement (Fig. S1). All the simulation results and bias-corrected climate data are available at the Earth System Grid Federation (ESGF) por-tal (http://esg.pik-potsdam.de/).
2.2 Statistical analysis
We used three-way analysis of variance (ANOVA) for global
1NPP, 1VegC, 1SOC, and 1VegC in each year as factors for RCP, GCM, and GVM and determined their interactions in order to decompose total variance in all ensembles into each factor (Yip et al., 2011). For this analysis, we used only the simulations for the RCP2.6 and 8.5 scenarios due to the fact that incomplete samples were simulated.
To avoid internal variability of GCMs, we used decadal-averaged values for 1NPP, 1VegC, 1SOC, and 1VegC. Subsequently, we calculated the Type II sums of squares in ANOVA using R (R Core Team, 2012). In this study, the overall uncertainty, denoted as variance (SSoverall), can be ex-pressed as follows:
SSoveralli t=SSRCPi t+SSGCMi t+SSGVMi t
+SSRCP × GCMi t+SSRCP × GVMi t+SSGCM × GVMi t
+SSRCP × GCM×GVMi t,
in which i indicates each variable (i.e., 1NPP, 1VegC,
1SOC, and 1VegC) and t indicates decadal time steps from the 2000s to the 2090s. SSoveralli t is the total sum of squares,
and the other SS terms indicate the sums of squares for each main effect and each interaction effect.
For grid-based assessment, we conducted additional ANOVA for 1NPP, 1VegC, and 1SOC in each grid for two projection periods (2055 and 2099). For simplicity, we did not consider the interaction terms (i.e., SSRCP × GCM,
SSRCP × GVM, SSGCM × GVM, SSRCP × GCM × GVM) in the grid-based assessment. We used only the main effects to cal-culate the relative importance of each uncertainty source as follows:
SSmaini t=SSRCPi t+SSGCMi t+SSGVMi t.
The relative fractions of uncertainty are expressed as Sit for
each main effect divided by SSmaini t.
In addition, using the grid-based maps, we compiled the dominant uncertainty in each grid source on the basis of the
observation-based present-day Köppen–Geiger climatic divi-sions (Kottek et al., 2006). The five major climate types are equatorial (A), arid (B), warm-temperature (C), snowy (D), and polar (E). In this analysis, we selected the dominant un-certainty source in each grid and expressed them as fractions of the total grid numbers in each climatic division.
3 Results
3.1 Global NPP, VegC, SOC, and VegC residence time changes during 1970–2099
At the end of the simulation period, 1NPP ranged from −7.0 to 54.3 Pg C year−1, 1VegC ranged from −27 to 543 Pg C, and 1SOC ranged from −195 to 471 Pg C in the entire sim-ulation set. The variance of 1NPP increased with time and was highest in RCP8.5. This was true for the other variables (1VegC and 1SOC). NPP increased in RCP8.5, except in the HYBRID4 model. NPP in HYBRID4 forced with two GCMs (HadGEM and MIROC) showed negative values by 2099. Global VegC stocks increased in almost all RCPs and GVMs compared with global VegC in 2000. However, the global Veg stocks in LPJmL peaked at ca. 2050 and then de-clined toward 2100. In the projection period (2000–2099), the SOC stock in the five models (except for HYBRID4) in-creased in all RCPs compared with that in 2000.
1VegC residence time at the global scale showed in-creased divergence in scenarios with higher radiative forc-ing. In spite of radiative forcing, 1VegC declines residence time increased in HYBRID4 and decreased in LPJmL. In RCP2.6, the median value of 1VegC residence time was pos-itive. Conversely, in RCP8.5, the median 1VegC residence time was almost 0 within a considerable range from −2.8 to 9.0 years. In SDGVM, 1VegC residence time remained fairly constant in all RCPs under all GCMs.
3.2 Contribution of each uncertainty source to Global NPP,VegC, andSOC
Figure 2 shows the fraction of uncertainty for each variable. For NPP, the GCM uncertainty dominated before the year 2020, and the RCP uncertainty increased and dominated after 2040. The GVM uncertainties were approximately 20 % for most of the simulation period. For VegC, the RCP uncertainty also increased gradually after 2020 and became approxi-mately 40 % of the total variance by 2100. The GVM uncer-tainty was most prominent for most of the projection period; however, it decreased after 2040 by 40 % of the total vari-ance. For SOC, the GVM uncertainty dominated throughout the projection period, with an average value of 92 % of the to-tal variance. For 1VegC residence time, GVM contribution gradually increased after the 2010s and reached 74 % in the 2090s. Conversely, the contribution of GCM to 1VegC res-idence time decreased from 80 % in the 2000s to 2 % in the 2090s. Although RCP formed a considerable part of VegC
RCP GCM GVM Interactions 0.0 0.2 0.4 0.6 0.8 1.0 Fr action of v ar iance [%] 0.0 0.2 0.4 0.6 0.8 1.0 Fr action of v ar iance [%] 0.0 0.2 0.4 0.6 0.8 1.0 Fr action of v ar iance [%] Year 0.0 0.2 0.4 0.6 0.8 1.0 Fr action of v ar iance [%] 2000s 2020s 2040s 2060s 2080s NPP V egC SOC V
egC Residence time
Figure 2.Fraction of variance derived from the emission scenar-ios (RCPs), GCMs, and GVMs for annual NPP, VegC, SOC, and VegC residence time changes. The variances were estimated by three-way ANOVA. The fractions in interactions include the sum of variations of interaction terms (RCP × GCM, RCP × GVM, and GCM × GVM).
and NPP uncertainties in the latter half of the 21st century, an RCP contribution to the global 1VegC residence time of 5 % was observed in the 2090s.
3.3 Spatial heterogeneity of the contribution of each uncertainty source
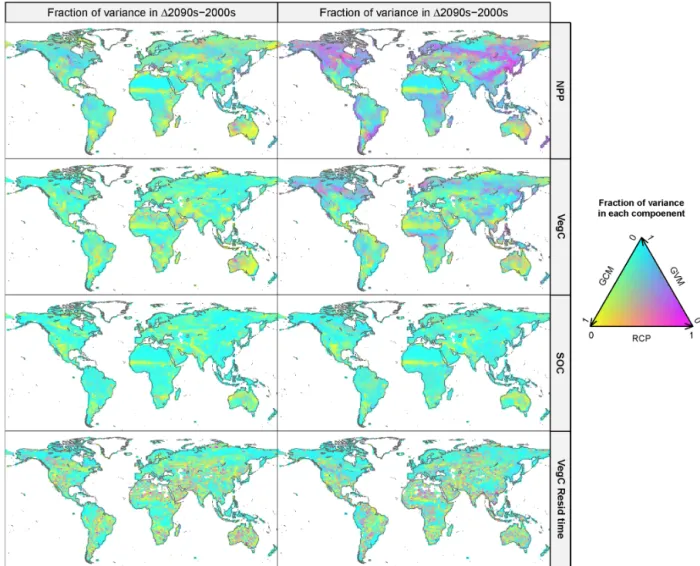
The strength of each uncertainty source relative to total vari-ance showed geographical heterogeneity for each variable (Fig. 3). For 1NPP, GCM had a considerable contribution to total variance in many parts of the world in the 2050s. In the 2090s, variance mainly explained by GCM was observed in limited regions, e.g., the Sahara and central Australia. RCP-dominant uncertainty source regions were present in part of
the tropics (Southeast Asia) to cool temperate regions (North America) in the 2090s for 1NPP. For 1VegC, GCM had a large contribution to each grid total variance in most regions at both times. For 1SOC, GVM was the major uncertainty source for each grid total variance in most regions in both pe-riods. GCM was observed to be the largest uncertainty source in some regions such as the southwestern USA and the Sa-hara region for 1SOC. For 1VegC residence time, GCM dominated more and its contribution was scattered across dif-ferent parts of the globe at both periods (Fig. 3). In northern Arctic regions, GVM was dominant over a wide area from high- to low-latitude regions.
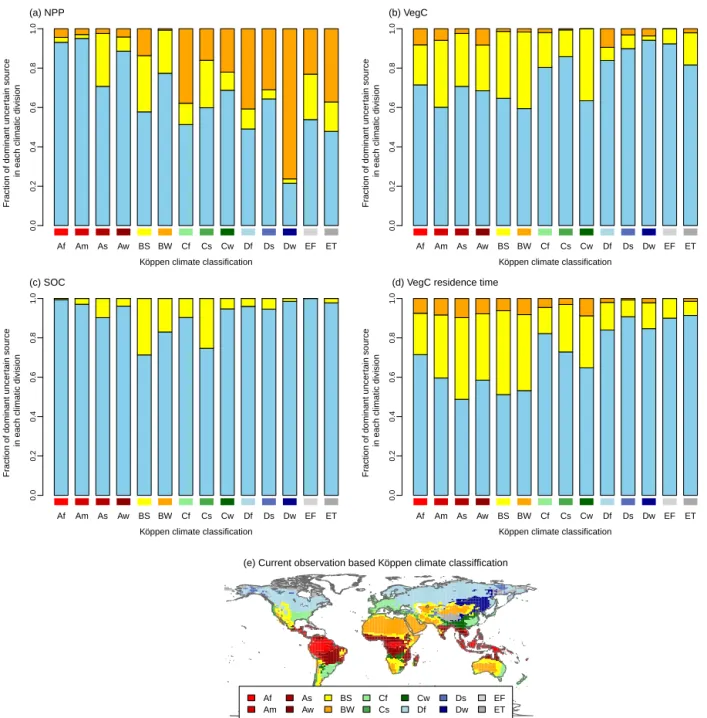
In terms of climatic divisions, the dominant uncertainty source clearly showed different patterns in 1NPP and
1VegC from equatorial climate (A) to snowy climate (D) (Fig. 4). The contribution of GVM to 1NPP variance de-creased as the climate became cooler in NPP (Fig. 4a). In each major climatic division, the seasonally drier divisions (m, s, w) tended to show a higher contribution of GCM com-pared with the division with fully humid seasons (f). Sim-ilarly, in arid climates (BW and BS), the contribution of GCM to the uncertainties of all variables was relatively high (Fig. 4a–c). Unlike global 1NPP and global 1VegC, GVM was dominant in tropical climates (Af–Aw), whereas RCP was not dominant in these regions, even in 2100. In Cf, Ds, Dw, and ET, RCP was the largest or second-largest source of uncertainty (from 30 to 50 % area) in each climatic divi-sion. For 1SOC, GVM was dominant in a broad area of all climate divisions, as shown in the results for global 1SOC. Furthermore, there were negligible areas where RCP domi-nated the uncertainty in 1SOC for all climatic divisions. The contributions of each uncertainty source showed similar pat-terns to the climatic gradients between 1VegC and 1VegC residence time. The contributions of GVM in 1VegC resi-dence time in tropical to arid regions (Af to BW) were larger than those in 1VegC, which ranged from 21 to 42 %.
4 Discussion
For the historical period (1970–2000), the models simulated similar historical NPP, VegC, and SOC trends for different GCMs (Fig. 1). However, at the end of the projection pe-riod, there were marked differences for all variables (Fig. 1). In particular, NPP and SOC varied from a net sink to a net source in the highest baseline emission scenario (RCP8.5). In higher emission scenarios, the total uncertainties for all vari-ables increased to a greater extent. The total uncertainties for each variable in this study were comparable with or greater than those for projected C cycling in a previous model in-tercomparison study (Sitch et al., 2008; Todd-Brown et al., 2013) even with a smaller number of GVMs.
Compared with previous model intercomparison studies of terrestrial C cycling, the ISI-MIP study has an important sim-ulation protocol advantage, i.e., it is a partial factorial
exper-Figure 3.Geographic distribution of the relative importance of the uncertainty derived from the emission scenarios (RCPs), GCMs, and GVMs for annual NPP, VegC, SOC, and VegC residence time changes from 2000 to 2050 and 2099 in each grid cell. The variances were estimated by one-way ANOVA.
iment with three independent treatments for CO2 emission scenarios (RCP), GCM, and GVM. Therefore, uncertainty can be decomposed into the sum of interclass variance (σRCP2 ,
σGCM2 , σGVM2 , and their interactions) and within-class vari-ance (σresid2 ). The ANOVA results revealed that each source made quite a different contribution to the total uncertainty, which varied with projection period (Fig. 2). Whereas GCMs were the dominant sources of uncertainty for NPP early in the projection period (2000–2040), RCP dominated later in the projection period (2050–2100) (Fig. 2). This trend of in-creasing RCP importance is similar to that of VegC (Fig. 2). This may be attributed to the enlargement of CO2 concentra-tion differences among RCPs for this period. The interacconcentra-tion terms as a source of uncertainty were significant (p < 0.05 level, not described) and contributed considerably to total uncertainties (up to 20 %) in NPP. This result indicates that there were different sensitivities to the CO2fertilization
ef-fect on vegetation processes among the GVMs (Friend et al., 2014) that also contributed to projection uncertainties.
Uniqueness in the HYBRID4 model projection was ob-served in the 1VegC residence time (Fig. 1). This is par-tially due to HYBRID4 having strong stomatal responses to elevated vapor pressure deficits, and thus simulated negative
1NPP between 2080 and 2100 even in higher CO2 condi-tions (Friend et al., 2014). In addition, GVM had a con-tribution of less than 20 % to global 1NPP (Fig. 2); how-ever, there were large fractional uncertainties in the 1VegC residence time (over 60 % at the end of the 21st century). The 1VegC residence time represents the turnover rates of plant parts and the mortality rates of individuals, processes modeled using baseline rates, climate sensitivities (including fire), and competitively induced mortality. So 1VegC resi-dence time is affected indirectly through shifts in vegetation composition (Friend et al., 2014). The interaction terms in VegC residence time changes dominated at about 20 %
dur-Af Am As Aw BS BW Cf Cs Cw Df Ds Dw EF ET Köppen climate classification
Fr
action of dominant uncer
tain source
in each climatic division
0.0 0.2 0.4 0.6 0.8 1.0 (a) NPP Af Am As Aw BS BW Cf Cs Cw Df Ds Dw EF ET
Köppen climate classification
Fr
action of dominant uncer
tain source
in each climatic division
0.0 0.2 0.4 0.6 0.8 1.0 (b) VegC Af Am As Aw BS BW Cf Cs Cw Df Ds Dw EF ET
Köppen climate classification
Fr
action of dominant uncer
tain source
in each climatic division
0.0 0.2 0.4 0.6 0.8 1.0 (c) SOC Af Am As Aw BS BW Cf Cs Cw Df Ds Dw EF ET
Köppen climate classification
Fr
action of dominant uncer
tain source
in each climatic division
0.0 0.2 0.4 0.6 0.8 1.0
(d) VegC residence time
Af Am As Aw BS BW Cf Cs Cw Df Ds Dw EF ET (e) Current observation based Köppen climate classiffication
Figure 4.The fraction of dominant uncertainty source in each Köppen climatic divisions in 1NPP (a), 1VegC (b), 1SOC (c), 1VegC residence time (d) in the 2090s, and Köppen climate classification map for the period 1951 to 2000 from the Climatic Research Unit (CRU)
(e). In panels (a–c), the colors indicate each uncertainty source as in Fig. 2 (i.e., orange indicates RCP, yellow indicates GCM, and blue
indicates GVM).
ing the entire simulation period, indicating that GVM has a different response to individual GCMs and RCPs. For ex-ample, the HYBRID4 model notably showed high sensitiv-ity to GVMs (Fig. 1). This term constitutes a non-negligible fraction compared with the main effects of each uncertainty source. Friend et al. (2014) pointed out that the humidity term in the vapor pressure deficit is a critical factor to differenti-ate the projected NPP among GVMs in the ISI-MIP. This is because the adoption of a response function to the vapor
pressure deficit is critical for responses to warmer climate conditions (Kumagai et al., 2004; Friend et al., 2014). Fur-thermore, in this study, only HYBRID4 incorporated a fully coupled N cycle; therefore, besides CO2fertilization effects, implementation of the N cycle in more models is required for more plausible modeling of effects of CO2fertilization in terrestrial C projections (Thornton et al., 2009).
Humidity data for GCMs were not adjusted to the bias-corrected air temperature and precipitation in the ISI-MIP
study (Masaki et al., 2015). This might be another potential source of uncertainty and bias for ecosystem projections and for evapotranspiration in global hydrological water models (Masaki et al., 2015). Our results suggested that an essential factor to reduce uncertainties in the climate assessment of ecosystems is improved understanding of C dynamics after photosynthesis rather than reduction of uncertainties in the exchange of C between the atmosphere and vegetation. In fact, the representations of these processes are quite different among GVMs (Friend et al., 2014).
The uncertainties in SOC changes driven by GVM were significantly large and were dominant over the entire simula-tion period (Fig. 2), possibly suggesting that SOC processes are not well constrained by the observational data or con-sistent between models, suggesting that the uncertainties de-rived from the GVMs overwhelmed those dede-rived from the climate scenarios. In addition, a previous study showed that VegC dynamics did not correlate strongly with that for SOC (Nishina et al., 2014), i.e., SOC processes contributed con-siderably to GVM-driven clustering in the SOC dendrogram. Another ISI-MIP study demonstrated that the sensitivity of global SOC decomposition to increasing global mean tem-perature varied significantly among GVMs (Nishina et al., 2014). Moreover, differences in the initial SOC stock result-ing from different spin-up procedures among GVMs criti-cally contributed to the incoherence in SOC dynamics. In a CMIP5 study, Nishina et al. (2014) demonstrated that mi-crobial decomposition processes are a dominant factor de-termining the amount of global SOC stock rather than C input from photosynthetic products. Determination of the initial SOC stock is important for future soil carbon stock and land surface fluxes (Exbrayat et al., 2014). In our re-sults, there was no regional and ecosystem-type (climatic di-visions) dependency on GVM contributions to uncertainty in SOC changes. Therefore, to reduce GVM uncertainties in SOC projection, improvement of spin-up procedures and mi-crobial decomposition will be effective for reduction of SOC uncertainties at both local and global scale.
Considering the geographic distribution, we determined that the contributions of each uncertainty source to each grid variance were spatially heterogenous (Fig. 4), although the total contributions of each uncertainty source in the grid-based assessment (Fig. 3) were roughly in agreement with Fig. 2 for each period (2050 and 2099). These heterogeneities could be linked with climatic divisions (Fig. 4). For exam-ple, in 1SOC, GVMs are also a main contributor in most regions in both periods (2050 and 2099). However, the grid-based assessment revealed geographically distinct regions for each uncertainty source. Although GCM was not a large contributor to global SOC dynamics (Figs. 3 and 4), GCM had a significant effect on uncertainty in arid (BW) to semi-arid (BS) regions (e.g., sub-Saharan Africa, the southwestern USA, South America (pampa), Central Asia, and Australia) for all variables. In a CMIP5 study, Sillmann et al. (2013) re-ported that changes in precipitation patterns in their regions
showed the low degree of coincidence among GCMs. These results suggest that the projection of precipitation patterns among GCMs is critically important to evaluate the impact of climate change on ecosystem conditions and C stocks in these regions (as shown in the Supplement). Although the carbon stocks and changes in these regions are not large, it is important to predict local climate condition uncertain-ties in order to obtain local climate predictions of ecosys-tem changes during climate change. In NPP and VegC in the 2090s, GVM is the dominant source in semitropical to tropi-cal climate zones (especially in Southeast Asia, Latin Amer-ica, and central Africa), whereas GVM is not dominant for global 1NPP during this period. This implies that modifica-tion of tropical rainforest C cycling is critical for reducing uncertainties in global NPP. In broad terms, the contribution of GVM as an uncertainty source in 1NPP becomes smaller in cooler climatic regions (C–D); however, those of GVM to 1VegC were larger in cooler climatic regions (Fig. 4). This inconsistency can be explained by the large differences between GVMs in the vegetation turnover rate in northern ecosystems because of the different representations of veg-etation dynamic processes (e.g., forest fires, N cycling, and senescence) (Friend et al., 2014). These results highlight that model improvement on the basis of plant functional type (corresponding to climate divisions) could be important for the effective reduction of uncertainty in climate impact as-sessments.
Our results do not mean that GCMs are not important for the uncertainties in VegC and SOC projection from the viewpoint of global C stocks. For example, under RCP8.5, the HYBRID4 model simulation showed that VegC diverged considerably among GCMs by 2100 (from 162 to 547 Pg C). Moreover, in Ahlström et al. (2012), one DGVM forced with 10 different GCMs showed a difference of approximately 500 Pg C among projections of changes in global terrestrial C stock (VegC and SOC) by 2100. Furthermore, the num-bers of GCMs and impact models used in this study likely affected the results. Hence, our results indicate a smaller contribution by GCM to total uncertainties than a lack of inter-GVM constraints owing to insufficient validation for the SOC and VegC processes from global observations. In the case of RCP2.6, the model projections were comparable for 1NPP; however, the results for 1VegC and 1SOC dif-fered significantly. This implies that internal ecosystem pro-cesses such as photosynthate partitioning and mortality were poorly constrained in the GVMs. Moreover, process uncer-tainties considerably affect SOC dynamics as a C source via litter inputs. More observation-based model intercomparison (e.g., MsTMIP, (Huntzinger et al., 2012)) for each compo-nent is required for GVMs to reduce the overall uncertainty. For SOC dynamics, empirical estimations using observation-based heterotrophic respiration (Bond-Lamberty and Thom-son, 2010; Hashimoto, 2012) are available for validation of SOC decomposition processes. In addition to each model modification, in future, multiple land-use scenarios should
be considered in projections to understand additional poten-tial uncertainties (σlanduse2 ) in the global terrestrial C budget. Furthermore, the use of bias-corrected GCM forcing data will probably affect C dynamics as well as the projections in hydrological models (Haddeland et al., 2011; Ehret et al., 2012); however, there is still a lack of validation for the effect of various bias-correction methods on C cycling projections and their relative uncertainty.
5 Conclusions
In conclusion, by combining multiple GVMs, GCMs, and RCP scenarios, we determined the different contributions of each factor to total uncertainty, which is highly depen-dent on the variables (NPP, VegC, SOC, and VegC residence time), projection periods, and regions. The contribution of each source of uncertainty in these variables showed differ-ent patterns compared with the hydrological variables sim-ulated by global hydrological models from another ISI-MIP study (Wada et al., 2013). At the global scale, by the middle of the 21st century, GCM is the dominant uncertainty source in most regions for NPP, VegC, and VegC residence time. However, GVM largely remains the major uncertainty in the impact models in most regions, particularly at the end of the 21st century.
Although RCP can differentiate NPP in temperate and cool climate regions, the uncertainties of VegC and VegC resi-dence time are dominated by GVM. These results suggest that the fate of photosynthetic carbon over the long term is an important uncertainty process for GVM models in climate impact assessments. Thus, our findings indicate that model improvement on the basis of plant functional type (corre-sponding to the climate divisions) could be important for the effective reduction of uncertainty in climate impact assess-ments.
For global SOC projections, the uncertainty driven by GVM was greater than that of the climate scenarios, i.e., RCPs and GCMs. This SOC uncertainty might be at-tributable mainly to the variety of SOC processes among GVMs and a lack of constraints for spin-up procedures. The uncertainties associated with SOC projections are signifi-cantly high, and the global SOC stocks by 2099 shift from net CO2sources to net sinks (from −195 to 471 Pg C). Be-cause of the magnitude of the uncertainty range in projected global SOC stock, the reduction of SOC uncertainties in GVM could be important for the terrestrial C budget.
Particularly in arid to dry climate regions, GCM was the dominant uncertainty source for all compartments and fluxes of ecosystem models even at the end of the 21st century be-cause NPP in these regions is strongly subjected to water-use limitation. The CO2 emission scenario (RCP) as an uncer-tainty source is important for the late projection period for both NPP and VegC. Moreover, the CO2fertilization
sensi-tivity of vegetation processes is quantitatively important for future C projection uncertainties.
The Supplement related to this article is available online at doi:10.5194/esd-6-435-2015-supplement.
Acknowledgements. We wish to thank the ISI-MIP coordination team of the Potsdam Institute for Climate Impact Research. We also acknowledge the World Climate Research Programme’s Working Group on Coupled Modelling, which is responsible for CMIP, and we thank the climate modeling groups for producing and making their model output available. The ISI-MIP Fast Track project was funded by the German Federal Ministry of Education and Research (BMBF), project funding reference no. 01LS1201A. K. Nishina, A. Ito, E. Kato, and T. Yokohata were supported by the Environment Research and Technology Development Fund (S-10) of the Ministry of the Environment, Japan.
Edited by: D. Lapola
References
Ahlström, A., Schurgers, G., Arneth, A., and Smith, B.: Robust-ness and uncertainty in terrestrial ecosystem carbon response to CMIP5 climate change projections, Environ. Res. Lett., 7, 044008, doi:10.1088/1748-9326/7/4/044008, 2012.
Arora, V. K., Boer, G. J., Friedlingstein, P., Eby, M., Jones, C. D., Christian, J. R., Bonan, G., Bopp, L., Brovkin, V., Cadule, P., Hajima, T., Ilyina, T., Lindsay, K., Tjiputra, J. F., and Wu, T: Carbon-concentration and carbon-climate feedbacks in CMIP5 Earth system models, J. Climate, 26, 5289–5314, 2013. Bond-Lamberty, B. and Thomson, A.: Temperature-associated
in-creases in the global soil respiration record, Nature, 464, 579– 582, 2010.
Clark, D. B., Mercado, L. M., Sitch, S., Jones, C. D., Gedney, N., Best, M. J., Pryor, M., Rooney, G. G., Essery, R. L. H., Blyth, E., Boucher, O., Harding, R. J., Huntingford, C., and Cox, P. M.: The Joint UK Land Environment Simulator (JULES), model descrip-tion – Part 2: Carbon fluxes and vegetadescrip-tion dynamics, Geosci. Model Dev., 4, 701–722, doi:10.5194/gmd-4-701-2011, 2011. Cook, B., Zeng, N., and Yoon, J.-H.: Will Amazonia dry out?
Mag-nitude and causes of change from IPCC climate model projec-tions, Earth Interact., 16, 1–27, 2012.
Cox, P. M., Betts, R. A., Jones, C. D., Spall, S. A., and Totterdell, I. J.: Acceleration of global warming due to carbon-cycle feed-backs in a coupled climate model, Nature, 408, 184–187, 2000. Cramer, W., Kicklighter, D., Bondeau, A., Iii, B. M., Churkina,
G., Nemry, B., Ruimy, A., Schloss, A., Intercomparison, T., and Model, P. O. T. P. N.: Comparing global models of terrestrial net primary productivity (NPP): overview and key results, Global Change Biol., 5, 1–15, 1999.
Ehret, U., Zehe, E., Wulfmeyer, V., Warrach-Sagi, K., and Liebert, J.: HESS Opinions “Should we apply bias correction to global and regional climate model data?”, Hydrol. Earth Syst. Sci., 16, 3391–3404, doi:10.5194/hess-16-3391-2012, 2012.
Exbrayat, J.-F., Pitman, A., and Abramowitz, G.: Response of microbial decomposition to spin-up explains CMIP5 soil car-bon range until 2100, Geosci. Model Dev., 7, 2683–2692, doi:10.5194/gmd-7-2683-2014, 2014.
Falloon, P., Challinor, A., Dessai, S., Hoang, L., Johnson, J., and Koehler, A.-K.: Ensembles and uncertainty in climate change impacts, Front. Environ. Sci., 2, doi:10.3389/fenvs.2014.00033, 2014.
Friedlingstein, P., Cox, P., Betts, R., Bopp, L., Von Bloh, W., Brovkin, V., Cadule, P., Doney, S., Eby, M., Fung, I., Govin-dasamy, B., John, J., Jones, C., Joos, F., Kato, T., Kawamiya, M., Knorr, W., Lindsay, K., Matthews, H. D., Raddatz, T., Rayner, P., Reick, C., Roeckner, E., Schnitzler, K.-G., Schnur, R., Strass-mann, K., Thompson, S., Weaver, A. J., Yoshikawa, C., and Zeng, N.: Climate-carbon cycle feedback analysis: results from the C4MIP model intercomparison, J. Climate, 19, 3337–3353, 2006.
Friend, A. D. and White, A.: Evaluation and analysis of a dynamic terrestrial ecosystem model under preindustrial conditions at the global scale, Global Biogeochem. Cy., 14, 1173–1190, 2000. Friend, A. D., Lucht, W., Rademacher, T. T., Keribin, R., Betts, R.,
Cadule, P., Ciais, P., Clark, D. B., Dankers, R., Falloon, P. D., Ito, A., Kahana, R., Kleidon, A., Lomas, M. R., Nishina, K., Ostberg, S., Pavlick, R., Peylin, P., Schaphoff, S., Vuichard, N., Warsza-wski, L., Wiltshire, A., and Woodward, F. I.: Carbon residence time dominates uncertainty in terrestrial vegetation responses to
future climate and atmospheric CO2, P. Natl. Acad. Sci. USA,
111, 3280–3285, 2014.
Gerten, D., Lucht, W., Schaphoff, S., Cramer, W., Hickler, T., and Wagner, W.: Hydrologic resilience of the terrestrial biosphere, Geophys. Res. Lett., 32, L21408, doi:10.1029/2005GL024247, 2005.
Haddeland, I., Clark, D. B., Franssen, W., Ludwig, F., Voß, F., Arnell, N. W., Bertrand, N., Best, M., Folwell, S., Gerten, D., Gomes, S., Gosling, S. N., Hagemann, S., Hanasaki, N., Harding, R., Heinke, J., Kabat, P., Koirala, S., Oki, T., Polcher, J., Stacke, T., Viterbo, P., Weedon, G. P., and Yeh, P.: Multimodel estimate of the global terrestrial water balance: setup and first results, J. Hydrometeorol., 12, 869–884, 2011.
Hashimoto, S.: A new estimation of global soil greenhouse gas fluxes using a simple data-oriented model, PloS One, 7, e41962, doi:10.1371/journal.pone.0041962, 2012.
Hempel, S., Frieler, K., Warszawski, L., Schewe, J., and Piontek, F.: A trend-preserving bias correction – the ISI-MIP approach, Earth Syst. Dynam., 4, 219–236, doi:10.5194/esd-4-219-2013, 2013. Huntzinger, D., Post, W. M., Wei, Y., Michalak, A., West, T. O.,
Jacobson, A., Baker, I., Chen, J. M., Davis, K., Hayes, D., Hoff-man, F. M., Jain, A. K., Liu, S., McGuire, A. D., Neilson, R. P., Potter, C., Poulter, B., Price, D., Raczka, B. M., Tian, H. Q., Thornton, P., Tomelleri, E., Viovy, N., Xiao, J., Yuan, W., Zeng, N., Zhao, M., and Cook, R.: North American Carbon Program (NACP) regional interim synthesis: terrestrial biospheric model intercomparison, Ecol. Model., 232, 144–157, 2012.
Ito, A. and Inatomi, M.: Water-use efficiency of the terrestrial bio-sphere: a model analysis focusing on interactions between the global carbon and water cycles, J. Hydrometeorol., 13, 681–694, 2012.
Jones, C., Robertson, E., Arora, V., Friedlingstein, P., Shevliakova, E., Bopp, L., Brovkin, V., Hajima, T., Kato, E., Kawamiya, M.,
Liddicoat, S., Lindsay, K., Reick, C. H., Roelandt, C.,
Segschnei-der, J., Tjiputra, J.: Twenty-first-century compatible CO2
emis-sions and airborne fraction simulated by CMIP5 earth system models under four representative concentration pathways, J. Clim., 25, 4398–4413, 2013.
Kittel, T., Rosenbloom, N., Painter, T., and Schimel, D.: The VEMAP integrated database for modelling United States ecosys-tem/vegetation sensitivity to climate change, J. Biogeogr., 22, 857–862, 1995.
Knutti, R. and Sedláˇcek, J.: Robustness and uncertainties in the new CMIP5 climate model projections, Nat. Clim. Change, 3, 369– 373, doi:10.1038/nclimate1716, 2013.
Kottek, M., Grieser, J., Beck, C., Rudolf, B., and Rubel, F.: World map of the Köppen-Geiger climate classification updated, Mete-orol. Z., 15, 259–263, 2006.
Kumagai, T., Katul, G. G., Porporato, A., Saitoh, T. M., Ohashi, M., Ichie, T., and Suzuki, M.: Carbon and water cycling in a Bornean tropical rainforest under current and future climate sce-narios, Advances in Water Resources, 27, 1135–1150, 2004. Masaki, Y., Hanasaki, N., Takahashi, K., and Hijioka, Y.:
Prop-agation of biases in humidity in the estimation of global irrigational water, Earth Syst. Dynam. Discuss., 6, 81–132, doi:10.5194/esdd-6-81-2015, 2015.
Mooney, H., Larigauderie, A., Cesario, M., Elmquist, T., Hoegh-Guldberg, O., Lavorel, S., Mace, G. M., Palmer, M., Scholes, R., and Yahara, T.: Biodiversity, climate change, and ecosystem services, Curr. Opin. Environ. Sustain., 1, 46–54, 2009. Moss, R. H., Edmonds, J. A., Hibbard, K. A., Manning, M. R., Rose,
S. K., van Vuuren, D. P., Carter, T. R., Emori, S., Kainuma, M., Kram, T., Meehl, G. A., Mitchell, J. F. B., Nakicenovic, N., Riahi, K., Smith, S. J., Stouffer, R. J., Thomson, A. M., Weyant, J. P., and Wilbanks, T. J.: The next generation of scenarios for climate change research and assessment, Nature, 463, 747–756, 2010. Nishina, K., Ito, A., Beerling, D. J., Cadule, P., Ciais, P., Clark, D.
B., Falloon, P., Friend, A. D., Kahana, R., Kato, E., Keribin, R., Lucht, W., Lomas, M., Rademacher, T. T., Pavlick, R., Schaphoff, S., Vuichard, N., Warszawaski, L., and Yokohata, T.: Quantifying uncertainties in soil carbon responses to changes in global mean temperature and precipitation, Earth Syst. Dynam., 5, 197–209, doi:10.5194/esd-5-197-2014, 2014.
Ostberg, S., Lucht, W., Schaphoff, S., and Gerten, D.: Critical im-pacts of global warming on land ecosystems, Earth Syst. Dynam., 4, 347–357, doi:10.5194/esd-4-347-2013, 2013.
Pavlick, R., Drewry, D. T., Bohn, K., Reu, B., and Kleidon, A.: The Jena Diversity-Dynamic Global Vegetation Model (JeDi-DGVM): a diverse approach to representing terrestrial biogeog-raphy and biogeochemistry based on plant functional trade-offs, Biogeosciences, 10, 4137–4177, doi:10.5194/bg-10-4137-2013, 2013.
Poulter, B., Hattermann, F., Hawkins, E., Zaehle, S., Sitch, S., RESTREPO-COUPE, N., Heyder, U., and Cramer, W.: Robust dynamics of Amazon dieback to climate change with perturbed ecosystem model parameters, Global Change Biol., 16, 2476– 2495, 2010.
R Core Team: R: A Language and Environment for Statistical Com-puting, R Foundation for Statistical ComCom-puting, Vienna, Aus-tria, available at: http://www.R-project.org/ (last access: August 2014), ISBN 3-900051-07-0, 2012.
Scholze, M., Knorr, W., Arnell, N. W., and Prentice, I. C.: A climate-change risk analysis for world ecosystems, P. Natl. Acad. Sci. USA, 103, 13116–13120, 2006.
Seneviratne, S., Lüthi, D., Litschi, M., and Schär, C.: Land-atmosphere coupling and climate change in Europe, Nature, 443, 205–209, 2006.
Shiogama, H., Emori, S., Hanasaki, N., Abe, M., Masutomi, Y., Takahashi, K., and Nozawa, T.: Observational constraints indi-cate risk of drying in the Amazon basin, Nature Comm., 2, 253, doi:10.1038/ncomms1252., 2011.
Sillmann, J., Kharin, V., Zwiers, F., Zhang, X., and Bronaugh, D.: Climate extremes indices in the CMIP5 multimodel ensemble: Part 2. Future climate projections, J. Geophys. Res.-Atmos., 118, 2473–2493, 2013.
Sitch, S., Smith, B., Prentice, I., Arneth, A., Bondeau, A., Cramer, W., Kaplan, J., Levis, S., Lucht, W., Sykes, M., Thonicke, K., and Venevsky, S.: Evaluation of ecosystem dynamics, plant ge-ography and terrestrial carbon cycling in the LPJ dynamic global vegetation model, Global Change Biol., 9, 161–185, 2003. Sitch, S., Huntingford, C., Gedney, N., Levy, P., Lomas, M., Piao,
S., Betts, R., Ciais, P., Cox, P., Friedlingstein, P., Jones, C. D., Prentice, I. C., and Woodward, F. I.: Evaluation of the terres-trial carbon cycle, future plant geography and climate-carbon cycle feedbacks using five Dynamic Global Vegetation Models (DGVMs), Global Change Biol., 14, 2015–2039, 2008. Taylor, K. E., Stouffer, R. J., and Meehl, G. A.: An overview of
CMIP5 and the experiment design, B. Am. Meteorol. Soc., 93, 485–498, 2012.
Thornton, P. E., Doney, S. C., Lindsay, K., Moore, J. K., Ma-howald, N., Randerson, J. T., Fung, I., Lamarque, J.-F., Fed-dema, J. J., and Lee, Y.-H.: Carbon-nitrogen interactions regu-late climate-carbon cycle feedbacks: results from an atmosphere-ocean general circulation model, Biogeosciences, 6, 2099–2120, doi:10.5194/bg-6-2099-2009, 2009.
Todd-Brown, K. E. O., Randerson, J. T., Post, W. M., Hoff-man, F. M., Tarnocai, C., Schuur, E. A. G., and Allison, S. D.: Causes of variation in soil carbon simulations from CMIP5 Earth system models and comparison with observations, Biogeo-sciences, 10, 1717–1736, doi:10.5194/bg-10-1717-2013, 2013. Van Vuuren, D. P., Edmonds, J., Kainuma, M., Riahi, K., Thomson,
A., Hibbard, K., Hurtt, G. C., Kram, T., Krey, V., Lamarque, J.-F., Masui, T., Meinshausen, M., Nakicenovic, N., Smith, S. J., and Rose, S. K.: The representative concentration pathways: an overview, Clim. Change, 109, 5–31, 2011.
Wada, Y., Wisser, D., Eisner, S., Flörke, M., Gerten, D., Haddeland, I., Hanasaki, N., Masaki, Y., Portmann, F. T., Stacke, T., Tessler, Z., and Schewe, J.: Multimodel projections and uncertainties of irrigation water demand under climate change, Geophys. Res. Lett., 40, 4626–4632, doi:10.1002/grl.50686, 2013.
Warszawski, L., Friend, A., Ostberg, S., Frieler, K., Lucht, W., Schaphoff, S., Beerling, D., Cadule, P., Ciais, P., Clark, D. B., Kahana, R., Ito, A., Keribin, R., Kleidon, A., Lomas, M., Nishina, K., Pavlick, R., Rademacher, T. T., Buechner, M., Pi-ontek, F., Schewe, J., Serdeczny, O., and Schellnhuber, H. J.: A multi-model analysis of risk of ecosystem shifts under cli-mate change, Environ. Res. Lett., 8, 044018, doi:10.1088/1748-9326/8/4/044018, 2013.
Warszawski, L., Frieler, K., Huber, V., Piontek, F., Serdeczny, O., and Schewe, J.: The Inter-Sectoral Impact Model Intercompar-ison Project (ISI–MIP): project framework, P. Natl. Acad. Sci. USA, 111, 3228–3232, 2014.
Wilby, R. L. and Dessai, S.: Robust adaptation to climate change, Weather, 65, 180–185, 2010.
Woodward, F., Smith, T., and Emanuel, W.: A global land primary productivity and phytogeography model, Global Biogeochem. Cy., 9, 471–490, 1995.
Yip, S., Ferro, C. A., Stephenson, D. B., and Hawkins, E.: A sim-ple, coherent framework for partitioning uncertainty in climate predictions, J. Climate, 24, 4634–4643, 2011.