HAL Id: hal-02335211
https://hal.archives-ouvertes.fr/hal-02335211
Submitted on 25 Nov 2020
HAL is a multi-disciplinary open access archive for the deposit and dissemination of sci-entific research documents, whether they are pub-lished or not. The documents may come from teaching and research institutions in France or abroad, or from public or private research centers.
L’archive ouverte pluridisciplinaire HAL, est destinée au dépôt et à la diffusion de documents scientifiques de niveau recherche, publiés ou non, émanant des établissements d’enseignement et de recherche français ou étrangers, des laboratoires publics ou privés.
Quantification of Cellular Deoxyribonucleoside
Triphosphates by Rolling Circle Amplification and
Förster Resonance Energy Transfer
Xue Qiu, Olivier Guittet, Carlos Mingoes, Nadine El Banna, Meng-Er Huang,
Michel Lepoivre, Niko Hildebrandt
To cite this version:
Xue Qiu, Olivier Guittet, Carlos Mingoes, Nadine El Banna, Meng-Er Huang, et al.. Quantification of Cellular Deoxyribonucleoside Triphosphates by Rolling Circle Amplification and Förster Resonance Energy Transfer. Analytical Chemistry, American Chemical Society, 2019, 91 (22), pp.14561-14568. �10.1021/acs.analchem.9b03624�. �hal-02335211�
Rapid quantification of cellular deoxyribonucleoside
triphosphates by amplified FRET
Xue Qiu1, Olivier Guittet2, Carlos Mingoes1, Nadine El Banna3, Meng-Er Huang3, Michel Lepoivre2*, Niko Hildebrandt1*
1 NanoBioPhotonics (nanofret.com), Institute for Integrative Biology of the Cell (I2BC),
Université Paris-Saclay, Université Paris-Sud, CNRS, CEA, Orsay, France
2 Cellular activation and signal transduction, Institute for Integrative Biology of the Cell
(I2BC), Université Paris-Saclay, Université Paris-Sud, CNRS, CEA, Orsay, France
3 CNRS UMR3348, Institut Curie, PSL Research University, Université Paris-Sud, Université
Paris-Saclay, Orsay, France
*Corresponding authors: michel.lepoivre@u-psud.fr, niko.hildebrandt@u-psud.fr
ABSTRACT
The quantification of cellular deoxyribonucleoside triphosphate (dNTP) levels is important for studying pathologies, genome integrity, DNA repair, and the efficacy of pharmacological drug treatments. Current standard methods, such as enzymatic assays or HPLC, are complicated, costly, and labor intensive, and alternative techniques that simplify dNTP quantification would present very useful complementary approaches. Here, we present a dNTP assay based on isothermal rolling circle amplification (RCA) and rapid time-gated Förster resonance energy transfer (TG-FRET), which used a commercial clinical plate reader system. Despite the relatively simple assay format, limits of detection down to a few picomoles of dNTP in cell extract samples of 30 µL and excellent specificity for each dNTP against the other dNTPs, rNTPs, and dUTP evidenced the strong performance of the assay. Direct applicability of RCA-FRET to applied nucleic acid research was demonstrated by quantifying all dNTPs in CEM-SS leukemia cells with and without hydroxyurea (HU) or auranofin treatment. Both pharmacological agents could reduce the dNTP production in a time- and dose-dependent manner. RCA-FRET provides simple, rapid, sensitive, and specific quantification of intracellular dNTPs and has the potential to become a useful tool for both fundamental and applied dNTP research.
INTRODUCTION
The maintenance of a balanced deoxyribonucleoside triphosphate (dNTP) pools is essential for reliable DNA synthesis during DNA replication and repair. Perturbation of the absolute and relative concentrations of intracellular dNTPs is observed in a large number of genetic diseases resulting from mutations in enzymes of nucleotide metabolism affecting nuclear or mitochondrial DNA synthesis (1). Furthermore, the pharmacological activity of a variety of anti-cancer or anti-viral drugs is dependent on a dysregulation of dNTP pools (2). The quantification of cellular dNTP levels is therefore of fundamental importance for understanding the mechanisms of these pharmacological agents (3). A renewed interest in the measurement of dNTP pools has also raised from recent progress in our understanding of physiological processes controlling genome integrity and DNA repair through regulation of dNTP supply (4, 5) and pathological situations that arise from altered dNTP biosynthesis (6, 7).
dNTPs present in extracts from cultured cells are usually quantified by two independent methods, namely enzymatic assays (8–11) or high-performance liquid chromatography (HPLC) measurements (12). Most currently available DNA polymerase-based assays need to incorporate radioisotopes that require specific laboratory security levels and are not environmentally friendly (8–11). Enzymatic methods for dNTP detection are usually based on the incorporation of a certain labeled dNTP into defined synthetic oligonucleotides by a DNA polymerase. Different oligonucleotides (DNA templates and/or DNA primers) need to be constructed for each dNTP to be determined (8–11). In another report, a dual-quenched fluorophore-labeled probe was used to detect the synthetic oligonucleotides by a Taq DNA polymerase (13). However, due to the limited lengths of the DNA templates applied, multiple DNA templates and/or multiple additional detecting probes were necessary to quantify four dNTPs, which made the sensor more complicated and expensive. Alternative methods that are reproducible, simple to apply, and can quantify and distinguish the four dNTPs at low concentrations from cells have the potential to significantly advance fundamental and applied biological research and clinical diagnostics.
Recently, we have developed a new technology that combines the specificity and sensitivity of rolling circle amplification (RCA) with the rapid and separation-free assay format of time-gated Förster resonance energy transfer (TG-FRET) for the quantification of extremely low concentrations (down to attomoles) of short DNA and RNA strands with single-nucleotide variant specificity (14, 15). In this method, the target is used as a primer to initiate RCA and dNTPs are used as the “fuel” for a phi29 polymerase to perform the RCA. Here, we inverse RCA-FRET and use DNA as fuel and dNTPs as targets, thereby providing a simple, sensitive,
and specific technique to quantity the four different dNTPs from cell extracts with a single primer and a single DNA template. Careful adaption of RCA-FRET to specific dNTP detection accomplished limits of detection (LODs) of 0.8 pmol dATP, 1.0 pmol dTTP, 0.9 pmol dCTP, and 0.5 pmol dGTP. To demonstrate the immediate applicability of this dNTP detection technology in research, clinical diagnostics, and pharmacology, we quantified the dysregulation of intracellular dNTPs in CEM-SS leukemia cells treated either with hydroxyurea (HU) or auranofin.
MATERIALS AND METHODS
Materials. Lumi4-Tb-NHS was provided by Lumiphore, Inc. All oligonucleotides were
purchased from Eurogentec. The primer DNA was purified by the supplier with cartridge gold desalting method. The padlock DNA was purified by the supplier with polyacrylamide gel electrophoresis. Tb and Cy5.5 probes were purified by the supplier with HPLC. All sequences and modifications of nucleic acids used in this study are summarized in Table 1. Tb-DNA conjugation was performed via Lumi4-Tb-NHS on the amino-functionalized Tb DNA probe as described elsewhere (16). Tb concentrations were determined by absorbance measurements at 340 nm using a molar absorptivity of 26,000 M-1cm-1 as provided by the manufacturer. DNA was quantified by absorbance measurements at 260 nm. Conjugation ratio was determined by linear combination of the respective absorbance values of Tb and oligo within the Tb-oligo conjugate and was around 1 Tb/DNA. Taq DNA ligase, phi29 polymerase, dNTP solution set, ribonucleotide solution set, 10× Taq DNA ligase reaction buffer (BUFFER-1, 1× buffer components: 20 mM Tris.HCl, 25 mM potassium acetate, 10 mM magnesium acetate, 10 mM DTT, 1 mM NAD, 0.1% Triton X-100, pH 7.6), 10× phi29 DNA polymerase reaction buffer (BUFFER-2, 1× buffer components: 50 mM Tris.HCl, 10 mM MgCl
2, 10 mM (NH4)2SO4, 4
mM DTT, pH 7.4), and nuclease-free water were purchased from New England Biolabs. Trizma base, HCl and bovine serum albumin (BSA) were purchased from Sigma-Aldrich. NaCl was purchased from Duchefa. All chemicals were used as received. Deionized water was purified by a Purelab Option-Q system equipped with bio-filter (ELGA LabWater).
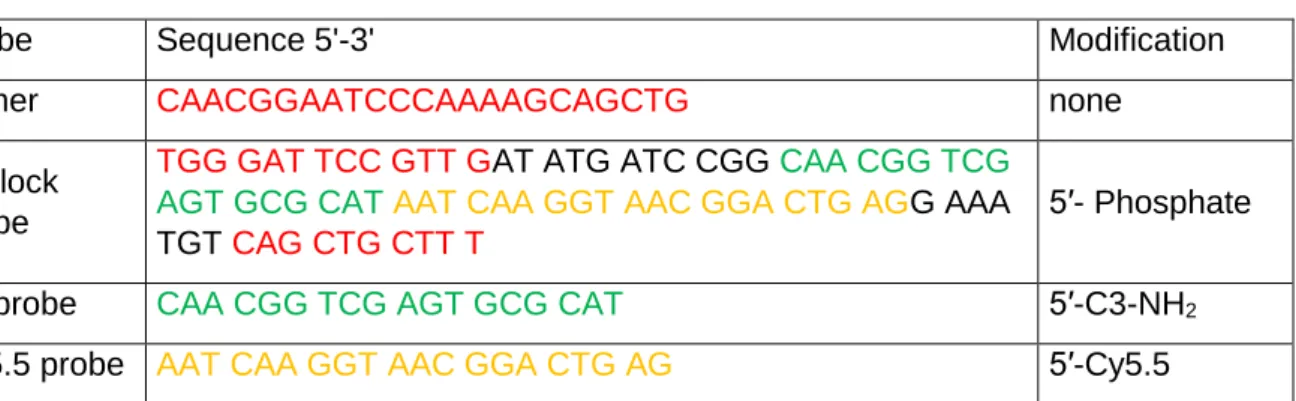
Table 1. Sequences of DNA oligonucleotides used in this study
Probe Sequence 5'-3' Modification
primer CAACGGAATCCCAAAAGCAGCTG none
padlock probe
TGG GAT TCC GTT GAT ATG ATC CGG CAA CGG TCG AGT GCG CATAAT CAA GGT AAC GGA CTG AGG AAA TGT CAG CTG CTT T
5′- Phosphate
Tb probe CAA CGG TCG AGT GCG CAT 5′-C3-NH2
Cy5.5 probe AAT CAA GGT AAC GGA CTG AG 5′-Cy5.5
Photophysical properties. Absorption spectra (Lambda 35 UV/Vis System, PerkinElmer)
and emission spectra (Xenius, SAFAS) were recorded in HEPES buffer (100 mM, pH 7.4) and deionized water for Tb and Cy5.5 samples, respectively.
Extraction of intracellular dNTPs. The human leukemia cell line CEM-SS was maintained
in RPMI medium supplemented with antibiotics and 5% heat-inactivated fetal calf serum. For dNTP measurements, cells were plated at a density of 0.6 × 10⁶ cells/ml and treated either with 2 mM HU for 24 h or with 2 or 6 µM auranofin for 30 min or 2 h. Cells were then harvested by centrifugation and extracted with ice-cold 60% methanol (5 × 10⁶ cells/ml), boiled for 5 min and centrifuged at 17,000g for 30 min as previously described (9). The supernatant was collected and lyophilized, and the dNTP extract was resuspended with nuclease-free water at a concentration of 33,000 CEM-SS cells per µL.
RCA-FRET dNTP quantification assays. In a typical dNTP assay, 0.75 nM padlock probe and 7.5 pM primer were prepared in 20 µL BUFFER-1 and incubated in a thermal cycler with a temperature control program (80°C for 2 min → decreased from 80°C to 22°C with a 2°C/min speed). Then 4 U of Taq DNA ligase prepared in 10 µL BUFFER-1 was added to the mixture and incubated at 37°C for 1 h. Afterwards, 60 µL BUFFER-2, which contains 5 U of phi29 DNA polymerase, 0.5 mM of three dNTPs in excess (dTTP, dCTP and dGTP for example), and varying concentrations of a limiting dNTP (dATP for example), was added and incubated at 37°C for 3 h. Before termination of the polymerization process, 5 nM Tb probe and 5 nM Cy5.5 probe prepared in 60 µL hybridization buffer (BUFFER-3, 20 mM Tris.HCl, 500 mM NaCl,
0.1 % BSA, pH 8.0) were added and incubated in a thermal cycler with a temperature control program (65°C for 10 min → decreased from 65°C to 22°C with a 2°C/min speed → 22°C for 10 min). From the total reaction volume of 150 µL, 140 µL were measured in black 96-well microtiter plates on a clinical immunofluorescence plate reader KRYPTOR compact plus (Thermo Fisher Scientific) with time-gated (0.1-0.9 ms) PL intensity detection using optical
bandpass filters with 494/20 nm (Semrock) for the Tb detection channel, 716/40 nm (Semrock) for the Cy5.5 detection channel. For statistical analysis and the estimation of LODs, all samples were prepared 3 times and measured in triplicates (n = 9) apart from the zero-concentration samples (in the absence of one of the dNTPs), which were prepared 10 times and measured in triplicates (n = 30). For selectivity tests, all samples were prepared and measured once.
RESULTS AND DISCUSSION
Principle of dNTP detection
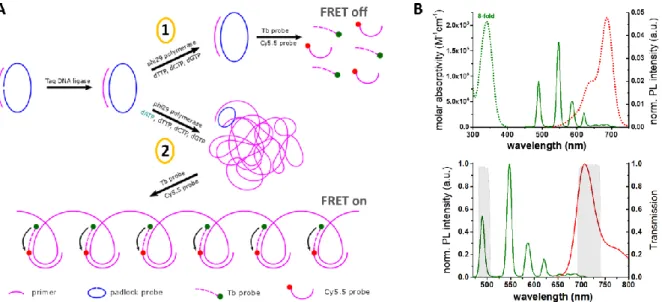
The principle of RCA-FRET-based dNTP detection is shown in Figure 1A. A ssDNA primer composed of 23 nucleotides (nt) hybridizes to the 5'-PO4 and 3'-OH ends of a matching linear
ssDNA padlock probe (79 nt). The padlock nick is then ligated over the primer splint by Taq DNA ligase to provide a primed circular DNA for subsequent RCA by phi29 polymerase. Only in the presences of phi29 polymerase and all dNTPs (including dATP, dTTP dCTP, and dGTP), the primer can be extended approximately 1000 times around the padlock template within a few hours. If one dNTP is provided in a limited amount, RCA will stop once this dNTP is used up. After the completed generation of RCA products (RCPs), two RCP-complementary DNA-probes, labeled with the luminescent terbium complex Lumi4-Tb (Tb) and the organic dye Cy5.5 (see Figure 1B for absorption and emission spectra), hybridize to certain locations of the RCP for specific TG-FRET detection. All four dNTPs can be quantified using the same RCA system (same oligonucleotides for all dNTPs). Sequences and modifications of all used oligonucleotides are summarized in Table 1.
Figure 1. A: Principle of RCA-FRET for dNTP quantification (dATP taken as an example). A ssDNA
that is ligated by Taq DNA ligase. In case one dNTP is missing (1), RCA will not take place (FRET off). Only in the presences of phi29 polymerase and all four dNTPs (2), the primer can be extended thousands of times in a few hours by RCA. The resulting RCP (partly shown on the bottom) provides complementary sequences for the two Tb and Cy5.5 ssDNA probes, which hybridize in close proximity to the RCP for efficient Tb-to-Cy5.5 FRET (FRET on). Thus, when only three dNTPs are provided in excess, the FRET signal intensity will be proportional to the concentration of the fourth dNTP inside the sample. B:Absorption (dotted lines) and photoluminescence (PL) emission (solid lines) spectra of Tb (green) and Cy5.5 (red). The overlap of Tb PL and Cy5.5 absorption (top) led to a Förster distance of
R0 = 5.8 nm. Optical bandpass filters (transmission spectra shown in gray – bottom) were used for Tb
(494/20 nm) and Cy5.5 (716/40 nm) detection in two separate detection channels.
Efficient TG-FRET detection from long PL-lifetime Tb donors to Cy5.5 acceptors (17) leads to suppression of sample background signals (autofluorescence) and allows for highly sensitive detection of dNTPs. TG-FRET detection (PL intensity integrated from 0.1 to 0.9 ms after the excitation pulse: ITG) was performed in two color detection channels to distinguish between FRET-sensitized Cy5.5 and the FRET-quenched Tb PL and to provide ratiometric signal detection (Equation 1) for high accuracy and reproducibility.
𝐹𝑅 = 𝐼𝐶𝑦5.5
𝑇𝐺
𝐼𝑇𝑏𝑇𝐺 (Eq. 1)
The FRET ratio (FR) is directly proportional to the concentration of the limiting dNTP and can
therefore be used for its quantification.
Sensitivity, specificity, and influence of cell extracts
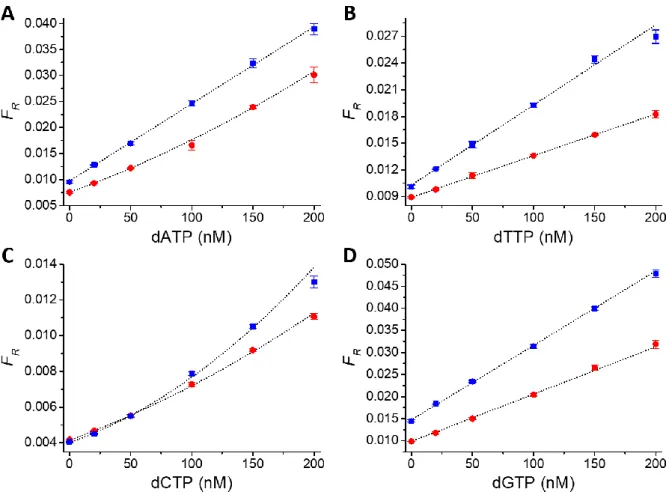
As a first proof-of-concept demonstration of absolute dNTP quantification by RCA-FRET, we prepared assay calibration curves (FRET ratio as a function of dNTP concentration) for all four dNTPs in reaction buffer. The assays were performed on a clinical fluorescence plate reader system (KRYPTOR compact PLUS) in 96-well microtiter plates with a sample volume of 140 µL per well. In addition to the enzymes (ligase and polymerase), the samples contained constant concentrations of primer (1 pM), padlock probe (0.1 nM), and the three dNTPs not to be quantified (0.2 mM). To perform the assay calibration, the samples also contained the dNTP of interest at known concentrations. For all four dNTP assays, the FRET ratio (FR) increased
nearly linearly with increasing concentrations (from 0 to 200 nM) of the dNTP of interest (red data points in Figure 2) and the LODs were sub-pmol for all dNTPs (Table 2). We then performed quantification of the four exogenous dNTPs in the presence of a small volume of extract, corresponding to ~70,000 CEM-SS cells in 2 µL. Similar to the experiments in reaction buffer alone, all calibration curves showed increasing FRET ratios with increasing dNTP concentration (blue data points in Figure 2). Although the calibration curves of the cell extract
experiments were slightly steeper (i.e., higher sensitivity), the standard deviations of the samples without added dNTP of interest (zero concentration) were higher and therefore also the LODs were slightly higher (Table 1). The differences of the curves (offset of FR already at zero
concentration of added dNTP of interest and different slopes) provide good preliminary evidence that the assays can sense the endogenous dNTPs of interest present in the cell extracts. They also show that the concentration of endogenous dCTP was relatively low (very similar curves for buffer and extract experiments). Albeit the low LODs and excellent assay performance, the differences of the calibration curves in the absence and in the presence of cell extracts prohibit their direct use for quantifying dNTPs from unknown samples. Both the different slopes and the unknown amounts of endogenous dNTPs in the cell extracts make a precise correlation of FR and dNTP concentration very imprecise. However, additional
measurements at different volume fractions of cell extracts may allow a precise quantification of the endogenous dNTP concentrations (vide infra).
Figure 2. Calibration curves of RCA-FRET dNTP assays (A: dATP, B: dTTP, C: dCTP, D: dGTP) in
reaction buffer without (red dots) and with (blue squares) 2 µL of cell extracts (from ~70,000 cells). The FRET ratios (FR) were calculated from time-gated (TG) intensities of Cy5.5 acceptor and Tb donor PL
(cf. Equation 1). Concentration-dependent PL decay curves of Cy5.5 acceptor and Tb-donor are shown in Figure S1.
Table 2. LODs (three standard deviations above background, n=30) for the four dNTPs measured in
reaction buffer alone or added with a small volume of cell extracts.
dNTP LOD in 150 µL reaction buffer LOD in 150 µL reaction buffer containing 2 µL of cell extracts
dATP 4.1 nM 0.6 pmol 5.2 nM 0.8 pmol
dTTP 5.5 nM 0.8 pmol 6.6 nM 1.0 pmol
dCTP 5.5 nM 0.8 pmol 6.0 nM 0.9 pmol
dGTP 1.7 nM 0.3 pmol 3.1 nM 0.5 pmol
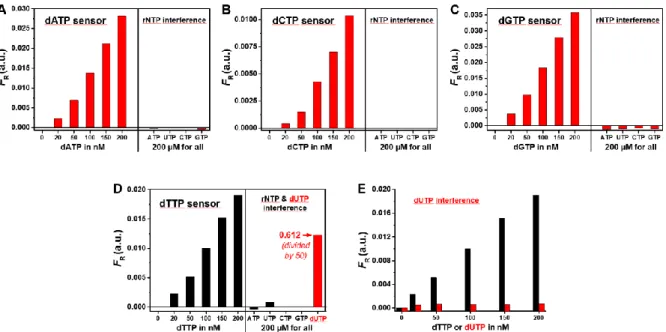
Before the actual quantification of endogenous dNTPs, we evaluated another paramount performance parameter for a functional dNTP assay, namely specificity. A potential problem of DNA polymerase-based detection is the interference from ribonucleotides (rNTPs), which can be present in cell extracts (from quiescent cells in particular) at molar ratios 1000-fold larger than their corresponding dNTP (18). The misincorporation of rNTPs can lead to artificially elevated measurements of dNTPs (8). Phi29 DNA polymerase is widely used in RCA experiments and was reported as preferring dNTPs more than two million fold over rNTPs due to its Tyr254 residue, which can discriminate against the 2'-OH group of an incoming ribonucleotide (19). To demonstrate the selectivity of dNTP quantification by RCA-FRET, we measured FR of the four dNTPs in a concentration range from 0 to 200 nM. We also investigated
the influence on FR of the four rNTPs (ATP, UTP, CTP, and GTP) as well as dUTP, which
could interfere with dTTP in polymerase based assays as most DNA polymerases do not discriminate between dUTP and dTTP (20). A 1000-fold molar excess of rNTPs (200 µM) did not result in a significant increase of FR for any of the dNTP assays (Figure 3A-D). The only
nonspecific signal arose from a 1000-fold molar excess of dUTP for dTTP detection (Figure
3D). However, the level of dUTP is usually kept much lower than that of dTTP (20). Thus, we
compared the FR response of dUTP and dTTP in the same concentration range (0 to 200 nM)
Figure 3: Selectivity of dNTP detection. A-D: 1000-fold molar excess of possibly interfering rNTPs (ATP,
UTP, CTP and GTP) did not significantly influence the FRET ratio (FR). Only a 1000-fold molar excess
of dUTP led to a significant increase of FR for the dTTP sensor (D). In the concentration range of 0-200
nM, dUTP did not result in nonspecific FR signals for dTTP (E). Note: For all dNTP sensors, the
corresponding dNTP concentration varied from 0 to 200 nM while concentrations of rNTPs (ATP, UTP, CTP and GTP) and dUTP were kept constant at 200 µM.
Quantification of dNTPs in leukemia cell extracts before and after HU treatment
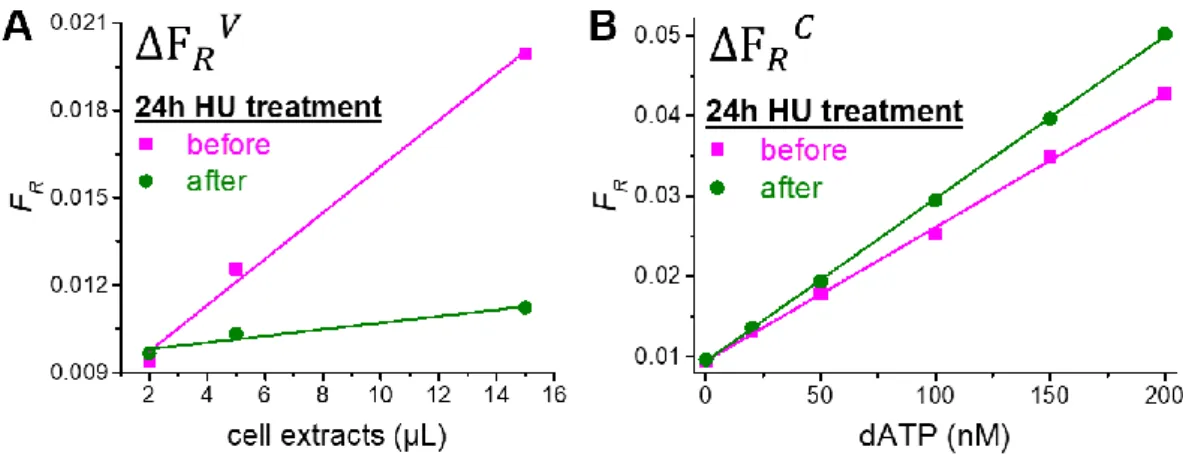
Motivated by the high sensitivity and selectivity of RCA-FRET dNTP detection, we challenged the assays by analyzing dNTP pools in CEM-SS leukemia cells before and after a 24h treatment with HU. This inhibitor decreases the de novo synthesis of dNTPs via inhibition of the key enzyme ribonucleotide reductase (RNR) by scavenging the tyrosyl free radical of the small subunits R2 or p53R2 (21). Because quantification of endogenous intracellular dNTPs from cell extracts cannot be performed by directly using the assay calibration curves measured in reaction buffer (vide supra), we needed a few additional measurements. These experiments consisted in measuring FR at different volume fractions of cell extracts without the addition of
any exogenous target dNTPs. Thus, we could determine the slope of FR as a function of the
volume fractions of cell extracts inside the entire measuring volume (FRV, Figure 4A) and
divide it by the slope of FR as a function of dNTP concentration (FRC, Figure 4B). This ratio
of slopes resulted in the concentration of dNTPs (Equation 2) and could be measured for both HU-treated and untreated cells.
𝑐(𝑑𝑁𝑇𝑃) =∆𝐹𝑅𝑉
The independence of FRC from the volume fraction (a necessary requirement for the
application of Equation 2) was confirmed by finding the same slopes of dNTP assay calibration curves for 2/150 (~6.7×10⁴ cells), 5/150 (~1.7×10⁵ cells), and 15/150 (~5×10⁵ cells) volume fractions (Supporting Figure S2).
Figure 4. RCA-FRET assay calibration curves for dATP inside CEM-SS cells before and after 24h of
treatment with HU. A: FR as a function of the volume fractions of cell extracts inside the entire measuring
volume for the determination of FRV (i.e., slopes of the linear fits multiplied by the total measuring
volume of 150 µL). B: FR as a function of dNTP concentration for the determination of FRC (i.e., slopes
of the linear fits). Determination of FRV and FRC for dTTP, dCTP, and dGTP is shown in
Supplementary Figure S3.
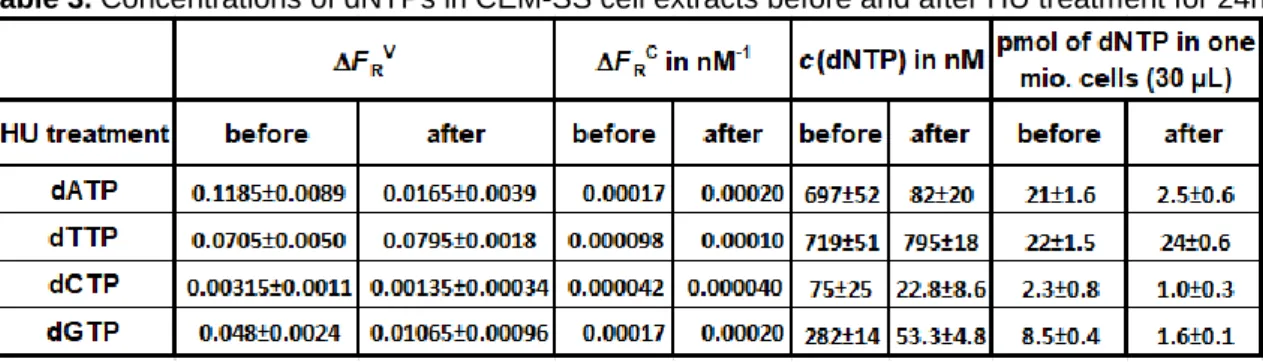
Using the slopes of the volume fraction and concentration calibration curves for all dNTPs (Figure 4 and Supporting Figure S3) and Equation 2, we could quantify all four dNTPs in the CEM-SS cell extracts under the two experimental conditions (with and without HU treatment). As shown in Table 3, 24 h treatment with HU resulted in a strong decrease of the purine deoxynucleotide concentrations (dATP -88% and dGTP -81%), whereas the concentrations of the pyrimidine dNTPs decreased less strongly for dCTP (-55%) and slightly increased for dTTP (+11%). These results are consistent with previous studies, which showed that recycling and phosphorylation of deoxyribonucleosides by the salvage pathway is much more efficient to maintain pyrimidine dNTP pools compared to the purine ones when ribonucleotide reductase activity is inhibited (22, 23). Notably, the concentrations of dCTP were very low in our experiments (close to the LOD of the RCA-FRET dCTP assay – cf. Table 2), which made the interpretation of the dCTP concentration change less reliable than for the other three dNTPs.
Table 3. Concentrations of dNTPs in CEM-SS cell extracts before and after HU treatment for 24h.
Quantification of dNTPs in leukemia cells before and after auranofin treatment
To further demonstrate the applicability of RCA-FRET for a simple quantification of intracellular dNTPs in the context of investigating therapeutic agents, we analyzed the nucleotide pool content of the CEM-SS leukemia cell line in exponential growth and following treatment with two doses of auranofin. Auranofin is a gold (Au)-containing compound that emerged as a potential candidate for multiple repurposed therapies including microbial infections and cancers (24). A central mechanism proposed for antiproliferative and anticancer activity of auranofin is the inhibition of thioredoxin reductase (TrxR) activity through auranofin's high affinity for selenol-containing residues of the active site of TrxR. A higher concentration of auranofin was also found to affect the glutathione pathway (25).
In contrast to the HU treatment experiments (vide supra) the CEM-SS cell culture was still in exponential growth phase at the time of harvest and therefore, the dNTP concentrations in the control samples (without auranofin treatment) were significantly higher (Figure 5 compared to
Table 3) and corresponded well to previous HPLC measurements performed on the same cell
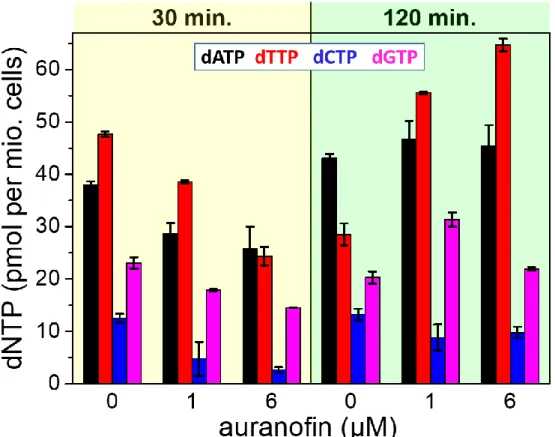
line (Supporting Table S1). Knowing that RNR is dependent on thioredoxins (Trx) and glutaredoxins (Grx) as the electron donors and that Trx and Grx ultimately obtain the electrons from NADPH via thioredoxin reductase (TrxR) or via glutathione reductase (GR) and glutathione (GSH) (26), we expected that auranofin treatment would affect RNR activity and dNTP synthesis. Indeed, as shown in Figure 5, all four dNTPs showed dose-dependent decreases when treated with auranofin for 30 minutes. A dose of 6 µM auranofin resulted in a more drastic decrease of the four dNTP concentrations compared to 2 µM auranofin. This behavior was consistent with the expectation that 2 µM auranofin would inhibit only TrxR activity, whereas 6 µM auranofin should impact both TrxR and the GSH pathway. Interestingly, the decreased dATP, dTTP, and dGTP levels got recovered after 2 h of treatment with
auranofin. This dynamic change could be explained by the fact that the TrxR-Trx system, which is the main target of auranofin even at low concentrations (2 µM), is the major electron donor for RNR during nucleotide biosynthesis, while the GSH-Grx system, affected only in the presence of higher concentration of auranofin, could be induced and compensate for the lack of the TrxR-Trx system. Furthermore, a recently described NADPH-independent pathway via methionine cycle, transsulfuration, and GSH synthesis (27), which may not be affected by auranofin, can also support RNR, contributing to the recovery of dNTP levels.
Figure 5. The concentrations of four dNTPs in cell extracts of CEM-SS cells that were treated for
different periods of time (30 or 120 min) with different concentrations of auranofin (0 µM auranofin corresponds to untreated control samples). All values (including comparative measurements with HPLC) are also shown in Supporting Table S1. Auranofin was dissolved in DMSO. The final concentration of DMSO was <0.1% and had no any impact on cell growth and proliferation.
CONCLUSIONS
A simple and reproducible sensor to quantify dNTP levels in cells would present a highly interesting complementary tool to rather labor-intensive, time-consuming, and costly enzymatic or HPLC assays, which are the commonly used analytical techniques. We have developed and tested a dNTP sensor based on isothermal RCA and rapid TG-FRET detection, which can be applied on a commercial clinical plate reader system (KRYPTOR compact PLUS). The dNTP assay provides LODs down to a few hundred femtomoles of dNTP in the 150 µL reaction
volume (corresponding to a few picomoles of dNTP in cell extract samples of 30 µL) and very high specificity for each of the four dNTPs, which was tested against the other dNTPs, rNTPs, and dUTP. To demonstrate the immediate applicability of RCA-FRET to nucleic acid research, we investigated the influence of the two pharmacological agents HU and auranofin on the inhibition of dNTP production in CEM-SS leukemia cells. 24 h treatment with 2 mM HU resulted in a decrease of the purine dNTPs by more than 80 %, whereas dCTP concentration was reduced by only 55 % and dTTP levels remained approximately constant (+ 11%). The effects of auranofin were tested with cells in exponential growth phase and concentrations of all dNTPs were reduced significantly within 30 min. of treatment in a dose-dependent manner (higher reduction of dNTP concentration for 6 µM than for 2 µM of auranofin). After 2 h of auranofin treatment the concentrations of dATP, dTTP, and dGTP recovered, which was related to a combination of the exponential growth phase of the cells and dNTP production pathways that were not influenced by these concentrations of auranofin (probably induction of the Grx/GSH/GSH reductase and Grx/GSH/methionine pathways). For comparison with the standard technologies, we compared the concentrations determined by RCA-FRET with HPLC and found excellent agreement between the two methods. Our results demonstrated that RCA-FRET allows for a simple, rapid, sensitive, and specific quantification of intracellular dNTPs and has the potential to become an important technique in fundamental and applied dNTP research.
AVAILABILITY
All source data of RCA-FRET measurements and all other relevant data are available from the corresponding authors upon request.
SUPPLEMENTARY DATA
Supplementary Data are available at NAR online.
ACKNOWLEDGEMENT
We thank Lumiphore, Inc. for the gift of Lumi4® reagents and Dr. Yong Wang for the lyophilization of the dNTP cell extracts.
FUNDING
This work was supported by the French National Research Agency (Investissements d’Avenir project “Labex NanoSaclay: ANR-10-LABX-0035” and ANR project “AMPLIFY”), the
Institut Universitaire de France (IUF), and the French “Institut National Du Cancer” and “Direction générale de l’offre de soins” (INCa and DGOS; project PRTk 16158 – Gynomir).
CONFLICT OF INTEREST
The authors declare no competing interests.
REFERENCES
1. Wang,L. (2016) Mitochondrial purine and pyrimidine metabolism and beyond. Nucleosides, Nucleotides and Nucleic Acids, 35, 578–594.
2. Jordheim,L.P., Durantel,D., Zoulim,F. and Dumontet,C. (2013) Advances in the development of nucleoside and nucleotide analogues for cancer and viral diseases. Nat. Rev. Drug Discov., 12, 447–464.
3. Cohen,S., Jordheim,L.P., Megherbi,M., Dumontet,C. and Guitton,J. (2010) Liquid chromatographic methods for the determination of endogenous nucleotides and nucleotide analogs used in cancer therapy: A review. J. Chromatogr. B Anal. Technol. Biomed. Life Sci., 878, 1912–1928.
4. Niida,H., Katsuno,Y., Sengoku,M., Shimada,M., Yukawa,M., Ikura,M., Ikura,T., Kohno,K., Shima,H., Suzuki,H., et al. (2010) Essential role of Tip60-dependent recruitment of ribonucleotide reductase at DNA damage sites in DNA repair during G1 phase. Genes Dev., 24, 333–338.
5. D’Angiolella,V., Donato,V., Forrester,F.M., Jeong,Y.T., Pellacani,C., Kudo,Y., Saraf,A., Florens,L., Washburn,M.P. and Pagano,M. (2012) Cyclin F-mediated degradation of ribonucleotide reductase M2 controls genome integrity and DNA repair. Cell, 149, 1023–1034.
6. Kumar,D., Abdulovic,A.L., Viberg,J., Nilsson,A.K., Kunkel,T.A. and Chabes,A. (2011) Mechanisms of mutagenesis in vivo due to imbalanced dNTP pools. Nucleic Acids Res., 39, 1360–1371.
7. Bourdon,A., Minai,L., Serre,V., Jais,J.P., Sarzi,E., Aubert,S., Chrétien,D., De Lonlay,P., Paquis-Flucklinger,V., Arakawa,H., et al. (2007) Mutation of RRM2B, encoding p53-controlled ribonucleotide reductase (p53R2), causes severe mitochondrial DNA depletion. Nat. Genet., 39, 776–780.
8. Ferraro,P., Franzolin,E., Pontarin,G., Reichard,P. and Bianchi,V. (2010)
Quantitation of cellular deoxynucleoside triphosphates. Nucleic Acids Res., 38, e85.
9. Beatrice,R., Beuneu,C., Roux,P., Buc,H., Lemaire,G. and Lepoivre,M. (1999) Simultaneous Determination of Pyrimidine or Purine Deoxyribonucleoside Triphosphates Using a Polymerase Assay Be. Anal. Biochem., 269, 403–409. 10. Horowitz,R.W., Zhang,H. yang, Schwartz,E.L., Ladner,R.D. and Wadler,S. (1997)
Measurement of deoxyuridine triphosphate and thymidine triphosphate in the extracts of thymidylate Synthase-Inhibited cells using a modified DNA
11. Sherman,P.A. and Fyfe,J.A. (1989) Enzymatic Assay for Deoxyribonucleoside Triphosphates Using Synthetic Oligonucleotides as Template Primers. Anal. Biochem., 180, 222–226.
12. Tanaka,K., Yoshioka,A., Tanaka,S. and Wataya,Y. (1984) An improved method for the quantitative determination of deoxyribonucleoside triphosphates in cell extracts. Anal. Biochem., 139, 35–41.
13. Wilson,P.M., Labonte,M.J., Russell,J., Louie,S., Ghobrial,A. and Ladner,R.D. (2011) A novel fluorescence-based assay for the rapid detection and
quantification of cellular deoxyribonucleoside triphosphates. Nucleic Acids Res.,
39, e112.
14. Qiu,X., Xu,J., Guo,J., Yahia-Ammar,A., Kapetanakis,N.I., Duroux-Richard,I., Unterluggauer,J.J., Golob-Schwarzl,N., Regeard,C., Uzan,C., et al. (2018) Advanced microRNA-based cancer diagnostics using amplified time-gated FRET. Chem. Sci., 9, 8046–8055.
15. Qiu,X., Guo,J., Xu,J. and Hildebrandt,N. (2018) Three-Dimensional FRET Multiplexing for DNA Quantification with Attomolar Detection Limits. J. Phys. Chem. Lett., 9, 4379–4384.
16. Qiu,X. and Hildebrandt,N. (2015) Rapid and Multiplexed MicroRNA Diagnostic Assay Using Quantum Dot-Based Förster Resonance Energy. ACS Nano, 9, 8449–8457.
17. Hildebrandt,N., Wegner,K.D. and Algar,W.R. (2014) Luminescent terbium complexes: Superior Förster resonance energy transfer donors for flexible and sensitive multiplexed biosensing. Coord. Chem. Rev., 273–274, 125–138. 18. Cozens,C., Pinheiro,V.B., Vaisman,A., Woodgate,R. and Holliger,P. (2012) A
short adaptive path from DNA to RNA polymerases. Proc. Natl. Acad. Sci., 109, 8067–8072.
19. Bonnin,A., La,Â.M., Blanco,L. and Salas,M. (1999) A Single Tyrosine Prevents Insertion of Ribonucleotides in the Eukaryotic-type f 29 DNA Polymerase. J. Mol. Biol., 290, 241–251.
20. Hu,C.M., Yeh,M.T., Tsao,N., Chen,C.W., Gao,Q.Z., Chang,C.Y., Lee,M.H., Fang,J.M., Sheu,S.Y., Lin,C.J., et al. (2012) Tumor Cells Require Thymidylate Kinase to Prevent dUTP Incorporation during DNA Repair. Cancer Cell, 22, 36– 50.
21. Platt,O.S. (2008) Hydroxyurea for the Treatment of Sickle Cell Anemia. N. Engl. J. Med., 358, 1362–1369.
22. Bianchi,V., Pontis,E. and Reichard,P. (1986) Changes of deoxyribonucleoside triphosphate pools induced by hydroxyurea and their relation to DNA synthesis. J. Biol. Chem., 261, 16037–16042.
23. Snyder,R.D. (1984) Deoxyribonucleoside triphosphate pools in human diploid fibroblasts and their modulation by hydroxyurea and deoxynucleosides. Biochem. Pharmacol., 33, 1515–1518.
24. Roder,C. and Thomson,M.J. (2015) Auranofin: Repurposing an Old Drug for a Golden New Age. Drugs R D, 15, 13–20.
25. Hatem,E., Azzi,S., El Banna,N., He,T., Heneman-Masurel,A., Vernis,L., Baïlle,D., Masson,V., Dingli,F., Loew,D., et al. (2019) Auranofin/Vitamin C: A Novel Drug Combination Targeting Triple-Negative Breast Cancer. J. Natl. Cancer Inst.,
111,597–608.
26. Lu,J. and Holmgren,A. (2014) The thioredoxin antioxidant system. Free Radic. Biol. Med., 66, 75–87.
27. Eriksson,S., Prigge,J.R., Talago,E.A., Arnér,E.S.J. and Schmidt,E.E. (2015) Dietary methionine can sustain cytosolic redox homeostasis in the mouse liver. Nat. Commun., 6, 1–9.
Supporting information
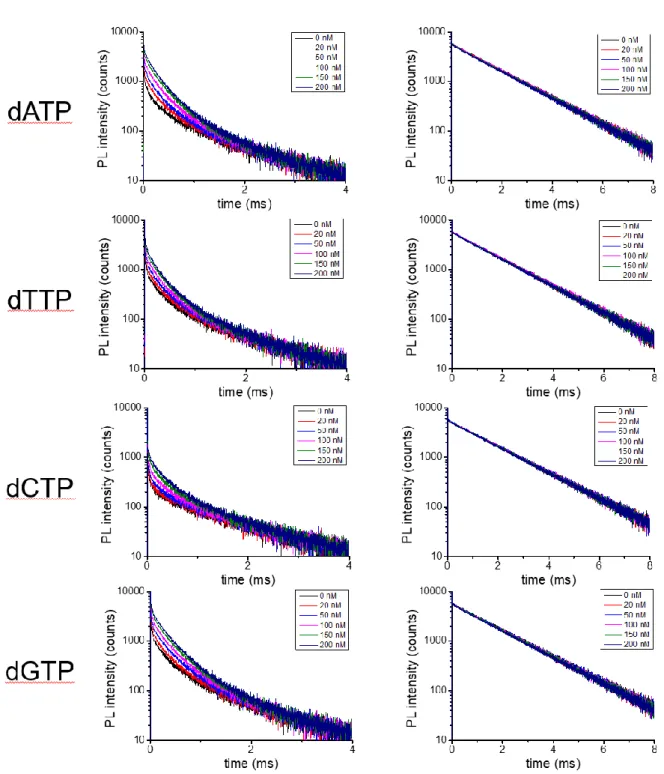
Figure S1. PL decay curves measured in the Cy5.5 (left) and the Tb (right) detection channels for
different dNTP concentrations (black: 0 nM; red: 20 nM; blue: 50 nM; magenta: 100 nM; green: 150 nM; navy: 200 nM). Concentration-dependent sensitization of long-lived (milliseconds) Cy5.5 PL (left) is clearly visible in the 0 to 2 ms time range (intensities of the curves increase with concentration). Quenching of the long-lived Tb PL is much less visible because Tb-probes are contained at a high concentration inside the assays, which leads to a high Tb PL background.
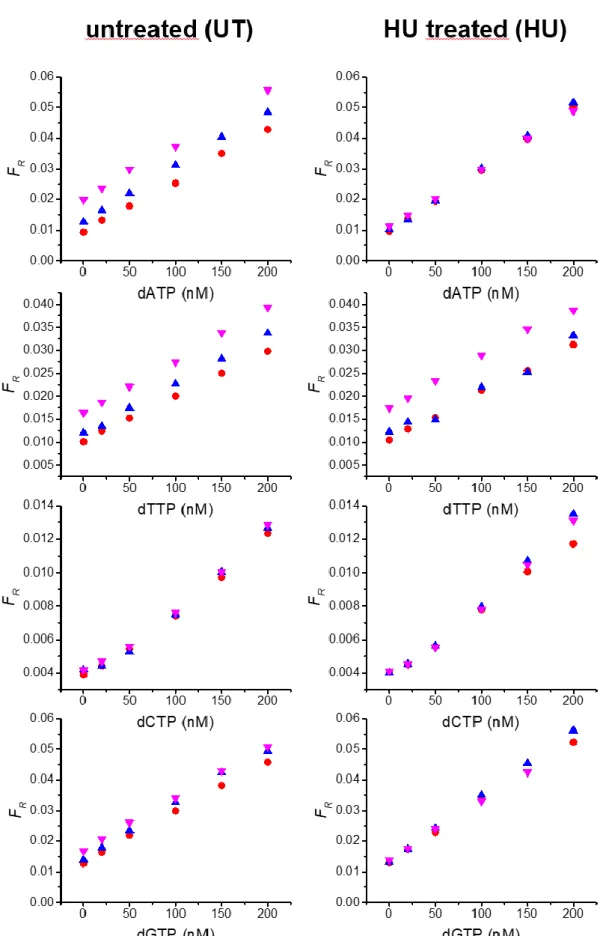
Figure S2. Calibration curves of RCA-FRET dNTP assays (dATP, dTTP, dCTP, and dGTP from top to
bottom) in reaction buffer (total volume of 150 µL) including 2 µL (red), 5 µL (blue), or 15 µL (magenta) of cell extracts. The FRET ratios (FR) were calculated from TG intensities of Cy5.5 acceptor and Tb
donor PL (cf. Equation 1). Graphs show the results of cells before (left) and after (right) 24h treatment with HU.
Figure S3. RCA-FRET assay calibration curves for dTTP (A), dCTP (B), and dGTP (C) inside CEM-SS
cells before (UT: untreated) and after (HU) 24h of treatment with HU. Left: FR as a function of the volume
fractions of cell extracts inside the entire measuring volume for the determination of FRV (i.e., slopes of
the linear fits multiplied by the total measuring volume of 150 µL). Right: FR as a function of dNTP
concentration for the determination of FRC (i.e., slopes of the linear fits). Functions of the linear fits and
calculation of FRV and FRC are shown inside the graphs.
Table S1. Concentrations (pmol per mio. cells) of dNTPs in CEM-SS cell extracts with or without
auranofin treatments for 30 min or 120 min.
dATP dTTP dCTP dGTP Control 30 min* 38.00.7 47.70.5 12.50.9 23.11.1 auranofin 1 µM 30 min 28.62.1 38.60.3 4.83.2 17.80.2 auranofin 6 µM 30 min 25.94.1 24.41.8 2.60.5 14.60.01 Control 120 min.* 43.10.8 28.52.1 13.21.1 20.31.2 auranofin 1 µM 120 min 46.73.5 55.60.2 8.92.5 31.31.4 auranofin 6 µM 120 min 45.44.0 64.71.2 9.81.1 22.00.3
* dNTP concentrations (in pmol per one million cells) of the same cell line (in exponential growth) measured with HPLC in our lab were 34.4±1.92 (dATP), 34.05±5.75 (dTTP), 16.25±1.89 (dCTP), and 20.3±4.59 (dGTP).