HAL Id: hal-00301664
https://hal.archives-ouvertes.fr/hal-00301664
Submitted on 27 Jun 2006HAL is a multi-disciplinary open access
archive for the deposit and dissemination of sci-entific research documents, whether they are pub-lished or not. The documents may come from teaching and research institutions in France or abroad, or from public or private research centers.
L’archive ouverte pluridisciplinaire HAL, est destinée au dépôt et à la diffusion de documents scientifiques de niveau recherche, publiés ou non, émanant des établissements d’enseignement et de recherche français ou étrangers, des laboratoires publics ou privés.
Size distributions of non-volatile particle residuals (Dp
C. Engler, D. Rose, B. Wehner, A. Wiedensohler, E. Brüggemann, T. Gnauk,
G. Spindler, T. Tuch, W. Birmili
To cite this version:
C. Engler, D. Rose, B. Wehner, A. Wiedensohler, E. Brüggemann, et al.. Size distributions of non-volatile particle residuals (Dp
ACPD
6, 5505–5542, 2006
Size distributions of non-volatile particle residuals and relation
to air mass origin
C. Engler et al. Title Page Abstract Introduction Conclusions References Tables Figures J I J I Back Close
Full Screen / Esc
Printer-friendly Version Interactive Discussion
Atmos. Chem. Phys. Discuss., 6, 5505–5542, 2006 www.atmos-chem-phys-discuss.net/6/5505/2006/ © Author(s) 2006. This work is licensed
under a Creative Commons License.
Atmospheric Chemistry and Physics Discussions
Size distributions of non-volatile particle
residuals (D
p
<
800 nm) at a rural site in
Germany and relation to air mass origin
C. Engler1, D. Rose1, B. Wehner1, A. Wiedensohler1, E. Br ¨uggemann1, T. Gnauk1, G. Spindler1, T. Tuch1,2, and W. Birmili1
1
Leibniz Institute for Tropospheric Research, Leipzig, Germany
2
UFZ Center for Environmental Research, Department of Human Exposure Research and Epidemiology, Leipzig, Germany
Received: 9 March 2006 – Accepted: 22 May 2006 – Published: 27 June 2006 Correspondence to: W. Birmili ([email protected])
ACPD
6, 5505–5542, 2006
Size distributions of non-volatile particle residuals and relation
to air mass origin
C. Engler et al. Title Page Abstract Introduction Conclusions References Tables Figures J I J I Back Close
Full Screen / Esc
Printer-friendly Version Interactive Discussion Abstract
Atmospheric aerosol particle size distributions at a continental background site in East-ern Germany were examined for a one-year period. Particles were classified using a twin differential mobility particle sizer in a size range between 3 and 800 nm. As a novelty, every second measurement of this experiment involved the removal of volatile
5
chemical compounds in a thermodenuder at 300◦C. This concept allowed to quantify the number size distribution of non-volatile particle cores – primarily associated with elemental carbon, and to compare this to the original ambient size distribution. A general result was that practically every ambient particle in continental background air contained a non-volatile core. The volume fraction of non-volatile particulate matter
10
(ambient Dp<800 nm) varied between 10 and 30% and was largely consistent with the
experimentally determined mass fraction of elemental carbon. The average size of the non-volatile particle cores was estimated as a function of original ambient size using a summation method, which showed that larger particles (>200 nm) contained more non-volatile compounds than smaller particles (<50 nm), thus indicating a significantly
15
different chemical composition. Two alternative air mass classification schemes based on either, synoptic chart analysis (Berliner Wetterkarte) or back trajectories showed, that the volume and number fractions of non-volatile cores were less dependent on air mass than the absolute concentrations in the particle size distributions. In all air masses, the non-volatile size distributions showed a more and a less volatile (“soot”)
20
mode, which is located in the size range of about 50 nm. During unstable conditions and in maritime air masses, smaller values were observed compared to continental or stable conditions. This reflects the significant emissions of non-volatile material over the continent and, depending on atmospheric stratification, increased concentrations at ground level.
25
ACPD
6, 5505–5542, 2006
Size distributions of non-volatile particle residuals and relation
to air mass origin
C. Engler et al. Title Page Abstract Introduction Conclusions References Tables Figures J I J I Back Close
Full Screen / Esc
Printer-friendly Version Interactive Discussion 1 Introduction
Atmospheric aerosol particles have been recognized to play a key role in the balance of global climate, notably through their direct and indirect radiative effects (Haywood and Boucher, 2000). Anthropogenic aerosols shift the natural balance of radiation in the atmosphere, and rapidly changing and spatially diverse patterns of anthropogenic
5
emissions make future projections of aerosol-driven climate effects a true challenge (Ramanathan et al.,2001). The aerosol particle size distribution is one of the key vari-ables involved in the analysis of radiative aerosol effects, and consequently, numerous works have examined the spatio-temporal characteristics of particle size distributions under marine or arctic baseline conditions (e.g.,Heintzenberg et al.,2004;Covert et al.,
10
1996;Koponen et al.,2002), and in the continental atmospheres of Central Europe ( Bir-mili et al.,2001), the Alps (Weingartner et al.,1999), Scandinavia (M ¨akel ¨a et al.,2000; Tunved et al., 2003), and Northern Italy (Rodr´ıguez et al., 2005) with respect to the distribution of anthropogenic sources.
Particular efforts have been directed towards studying the relevance of atmospheric
15
carbonaceous aerosols (e.g.,Kriv ´acsy et al.,2001). Black carbon is a strong absorber of visible light, whose radiative effect in mixed-phase particles and during cloud activa-tion are uncertain to predict (Ackerman and Toon,1981;Heintzenberg and Wendisch, 1996;Jacobson,2001). Due to their insolubility, carbonaceous aerosols, particularly including elemental carbon, have also been associated with respiratory effects in
ani-20
mals and humans (Oberd ¨orster,2001;Donaldson et al.,2001).
Apart from volcanic activities and natural forest fires, black carbon stems overwhelm-ingly of anthropogenic sources, such as industrial and domestic combustion, and ve-hicular traffic sources (Ogren and Charlson, 1983; Andreae and Merlet, 2001; Bond et al.,2004). Modelling the emission, dispersion, and removal of carbonaceous aerosol
25
requires spatially resolved emission inventories, which are usually difficult to obtain. Atmospheric measurements using cost-efficient techniques are therefore desirable to obtain information on the distribution, sources, and processes determining the
ACPD
6, 5505–5542, 2006
Size distributions of non-volatile particle residuals and relation
to air mass origin
C. Engler et al. Title Page Abstract Introduction Conclusions References Tables Figures J I J I Back Close
Full Screen / Esc
Printer-friendly Version Interactive Discussion
time of carbonaceous aerosol components. A standard method to determine atmo-spheric black carbon concentrations is filter collection, and subsequent thermal treat-ment and detection of CO2 in a EC/OC analyzer (Turpin et al., 2000). Photometric measurement techniques, such as the aethalometer, or the PSAP (Bond et al.,1999) have the advantage of higher time resolution, but are typically not designed to
distin-5
guish particles according to particle size.
An alternative method to investigate carbonaceous aerosols is volatility analysis. A basic experimental approach involves heating of sample aerosol, thereby causing volatile fractions of PM to evaporate, and subsequent removal of the evaporated mate-rial. Such devices have been known as “thermodenuders” (Burtscher et al., 2001),
10
which allow to distinguish bulk portions of chemical species that are less or more volatile, respectively.
During this work, we have applied a combination of a twin differential mobility parti-cle sizer (TDMPS) and a thermodenuder (TD) to examine the change in partiparti-cle size distribution due to the removal of volatile species. Tropospheric aerosol samples were
15
thus analyzed for a period of 12 months, and distinguished according to air masses. The potential of our experimental methods to provide a surrogate measurement for the number concentration of primary anthropogenic particles is discussed.
2 Experimental
Atmospheric measurements of ambient and non-volatile particle size distributions were
20
carried out over a period of 12 months between 1 July 2003 and 30 June 2004 at the atmospheric research station of the Leibniz Institute for Tropospheric Research Melpitz in Eastern Germany (87 m a.s.l., 51◦320N and 12◦540E). The station is surrounded by flat grass lands, agricultural pastures and woodlands within several tens of kilometers, and neither obstacles nor larger sources of pollution lie within the immediate vicinity of
25
the station. The comparison of previous aerosol measurements at Melpitz with other European sites shows that Melpitz observations are within the concentration range of
ACPD
6, 5505–5542, 2006
Size distributions of non-volatile particle residuals and relation
to air mass origin
C. Engler et al. Title Page Abstract Introduction Conclusions References Tables Figures J I J I Back Close
Full Screen / Esc
Printer-friendly Version Interactive Discussion
the more anthropogenically influenced background sites (van Dingenen et al.,2004; Putaud et al.,2004).
Particle number size distributions upstream and downstream a thermodenuder were measured using a flow-regulated twin differential mobility particle sizer (TDMPS) ( Bir-mili et al.,1999). This instrument consists of two differential mobility particle analyzers
5
(Vienna type), connected to a condensation particle counter (model 3010, TSI, St. Paul, Minnesota, U.S.), and an ultrafine condensation particle counter (model 3025, TSI), re-spectively, which together encompass a total particle size range between 3 to 800 nm. Sheath air was supplied at a humidity below 5%. The aerosol inlet was equipped with an Andersen PM10 head.
10
For the volatilization of sample aerosol, a thermodenuder (TD) following the design of Wehner et al. (2002) was used. Briefly, this TD consists of a heating section to remove the volatile material at a temperature of 300◦C, and a cooling section where the evaporated gas-phase compounds are absorbed by active carbon in order to avoid re-condensation on the particles.
15
A measurement cycle of the TD/TDMPS combination consisted of a size distribution scan upstream the TD, followed by a scan downstream the TD. A scan duration of 10 min allowed for a time resolution of 20 min for both the ambient-state and thermally conditioned distributions. On condition that the ambient aerosol population fluctuates only moderately with time, the quasi parallel measurements of ambient and non-volatile
20
size distributions were compared against each other, as described in Sect.3.3.
An aerosol conditioning device like the thermodenuder causes particle losses during transport, notably due to Brownian diffusion or thermophoresis. To account for these effects, the measured size distributions were corrected for size-resolved transmission factors that were determined in the laboratory using test aerosols for a range of particle
25
sizes (3–50 nm).
ACPD
6, 5505–5542, 2006
Size distributions of non-volatile particle residuals and relation
to air mass origin
C. Engler et al. Title Page Abstract Introduction Conclusions References Tables Figures J I J I Back Close
Full Screen / Esc
Printer-friendly Version Interactive Discussion
3 Methodology
Since this work relies on the relatively unexplored technique of particle volatilization in a thermodenuder, several aspects of non-volatile particulate matter, such as external particle mixture are now established.
3.1 State of mixture of non-volatile particulate matter
5
When measuring volatile size distributions, the question arises whether this non-volatile material originates from an entirely separate particle type (external mixture), or from chemically mixed particles (internal mixture). Tandem differential mobility analyzer (V-TDMA) measurements at Melpitz showed that non-volatile particulate matter in an aged continental aerosol occurred in the shape of both entirely non-volatile particles,
10
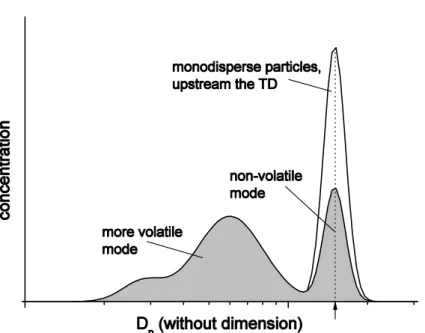
and non-volatile particle cores of chemically mixed particles (Philippin et al., 2004; Rose et al.,2006). Figure1illustrates such decomposition of a monodisperse particle population into a “non-volatile”, and a “partially volatile” mode in the V-TDMA-system.
To establish a better understanding of the size distributions of non-volatile residues, V-TDMA data from Rose et al. (2006) were revisited and combined with concurrent
15
TD-TDMPS measurements from this work. While the TD-TDMPS measured complete size distributions, the V-TDMA provided information on external particle mixture for a range of monodisperse particle sizes. In the V-TDMA, particles were heated to 300◦C like in the TD-TDMPS.
The combination of TD-TDMPS and V-TDMA data involved a simulation of the
non-20
volatile size distributions from both the ambient TDMPS size distribution (3–800 nm), and V-TDMA decomposition information for the monodisperse particle sizes 30, 50, 80, and 150 nm. V-TDMA decomposition spectra were first interpolated over the entire TDMPS size, and then used to map each size bins of the ambient TDMPS distribu-tion onto a resulting size distribudistribu-tion corresponding to the state downstream of the
25
thermodenuder.
A comparison of the simulated non-volatile size distribution and the experimentally 5510
ACPD
6, 5505–5542, 2006
Size distributions of non-volatile particle residuals and relation
to air mass origin
C. Engler et al. Title Page Abstract Introduction Conclusions References Tables Figures J I J I Back Close
Full Screen / Esc
Printer-friendly Version Interactive Discussion
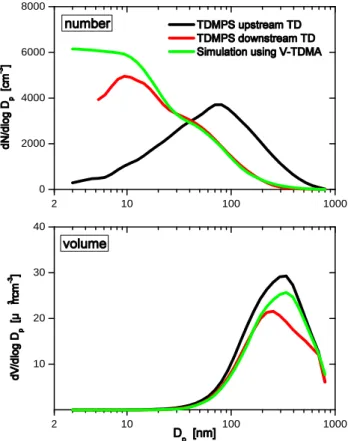
determined TDMPS distribution downstream the thermodenuder can be seen in Fig.2, and shows a very good agreement in particle number >20 nm, and in particle volume
<200 nm. This indicates that V-TDMA and TD-TDMPS data are consistent, and
ex-haustive in describing the volatilization process of the measured size distributions in the range 20–200 nm. Divergences between simulation and measurement outside this
5
size range are ascribed to the non-availability of V-TDMA information.
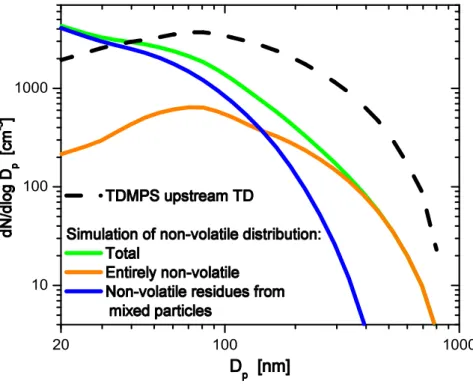
The knowledge of external particle mixture allows to determine which non-volatile particles measured in the TD-TDMPS derive from entirely non-volatile particles, and which from originally larger, internally mixed particles. Figure3 shows how the simu-lated non-volatile number distribution can be decomposed into these two particle types.
10
Interestingly, the non-volatile particles measured above a size of approximately 140 nm belong overwhelmingly to the type of entirely non-volatile particles, whereas below 140 nm, they are predominantly the non-volatile residues of originally larger particles. Also note that the distribution of entirely non-volatile particles has its maximum concen-tration at about 100 nm, which is similar to the emission profile of diesel soot (Harris
15
and Maricq,2001).
Associating entirely non-volatile particles with primary soot particles (cf., e.g., Philip-pin et al.,2004;Rose et al.,2006), and partially volatile particles with those that have undergone atmospheric processing, we summarize our results in the shape of the fol-lowing paradigm for atmospheric non-volatile particle distributions:
20
1. Non-volatile particles larger than a certain size (∼140 nm) belong mostly to the type of entirely non-volatile particles, which are associated with primary soot par-ticles from combustion sources.
2. Non-volatile particles smaller than a certain size (∼140 nm) are mostly residues of originally larger, and chemically mixed particles; these particles have undergone
25
physical and chemical transformation in the atmosphere, such as coagulation and the heterogeneous addition of ionic and organic secondary aerosol.
3. Although the distribution of entirely non-volatile particles has its maximum con-5511
ACPD
6, 5505–5542, 2006
Size distributions of non-volatile particle residuals and relation
to air mass origin
C. Engler et al. Title Page Abstract Introduction Conclusions References Tables Figures J I J I Back Close
Full Screen / Esc
Printer-friendly Version Interactive Discussion
centration at about 100 nm, these particles are still outnumbered at that size by a factor of approximately 2.5 by the residues of chemically mixed particles.
This paradigm is presumed to be valid for observations at a rural background site in an anthropogenically influenced troposphere, such as over Central Europe.
5
3.2 Relation between non-volatile particle volume and chemical particle composition We now discuss the classes of chemical compounds that may be associated with the measured non-volatile size distributions. Rose et al.(2006) proposed primary sources of soot, such as diesel engine emissions as responsible for the type of entirely non-volatile particles over a range of atmospheric conditions.
10
Secondary particulate mass in the European rural troposphere, in contrast, is dom-inated by sulfate, nitrate, and secondary organic compounds (Putaud et al., 2004). From a compilation of known boiling points and experimentally determined volatiliza-tion temperatures in Table1, it can be seen that the salts of ammonium are completely volatile at 300◦C, whereas the salts of Na, K and Ca are non-volatile.
15
For organic compounds, the situation is more complicated since the myriad of indi-vidual organic species is difficult to measure, and knowledge on the volatility properties of atmospherically relevant species remains scattered. An agreed convention to sep-arate “organic” and “elemental” carbon has been the thermal treatment of filter-based samples at 340◦C over the duration of two hours (Cachier et al.,1989;Kuhlbusch et al.,
20
1998). While it may be safe to assume that airborne elemental carbon will be preserved during passage through our thermodenuder at 300◦C, it is not evident which fractions of organic carbon will eventually be removed during the transit time of several seconds. To scrutinize the connection between the non-volatile particulate fraction and classes of chemical compounds, impactor samples that were collected over 24 h each at
Mel-25
pitz in July and August 2003 were analyzed with regard to chemical particle composi-tion, with sampling being concurrent to the TD-TDMPS measurements. The impactor
ACPD
6, 5505–5542, 2006
Size distributions of non-volatile particle residuals and relation
to air mass origin
C. Engler et al. Title Page Abstract Introduction Conclusions References Tables Figures J I J I Back Close
Full Screen / Esc
Printer-friendly Version Interactive Discussion
stage used for a comparison with the TD-TDMPS encompasses the accumulation mode with aerodynamic particle sizes between 140 and 420 nm. Ion-chromatography served to determine the mass concentration of Cl−, NO−3, SO2−4 , Ca2+, K+, Mg2+, Na+, and NH+4, whereas a thermographic carbon analysis was applied to determine the mass concentrations of organic and elemental carbon, respectively. Briefly, organic
5
carbon (OC) was volatilized at 650◦C under pure nitrogen, and subsequently oxidized catalytically at 850◦C. Elemental carbon was defined as the remaining matter detected from complete combustion at 650◦C under pure oxygen. More details of the analytical techniques can be found elsewhere (Plewka et al.,2004).
In a first calculation, the mass fractions of the salts of ammonium on the one hand,
10
and Na, K, Ca, and Mg on the other hand were determined by distributing the pool of anions towards the cations according to their ion charge. Then, the chemical mass fractions were converted into volumetric mass fractions using bulk assumptions on the density of the different classes of compounds. Finally, the total non-volatile mass fraction was calculated by considering elemental carbon, and the salts of Na, K, Ca,
15
and Mg non-volatile, and compared to the non-volatile volume fraction determined from the TD-TDMPS.
For eight samples, the non-volatile volume fraction calculated from the TD-TDMPS measurements was between 0.04 and 0.12, whereas the volume fraction of non-volatile chemical compounds amounted to values between 0.03 and 0.2. Although being far
20
from a precision closure experiment, these results suggest that the non-volatile fraction detected by the TD-TDMPS is accounted for by EC and the non-volatile inorganic salts of Na, K, Ca, and Mg. In the continental accumulation mode aerosol analyzed, EC and the mentioned inorganic salts were found to occur in a ratio of approximately 1:5 in non-volatile PM.
25
3.3 Summation method
In some of our former work, we developed a method to interpret dual size distribution data with regard to the changes occurring in a distribution after being conditioned, more
ACPD
6, 5505–5542, 2006
Size distributions of non-volatile particle residuals and relation
to air mass origin
C. Engler et al. Title Page Abstract Introduction Conclusions References Tables Figures J I J I Back Close
Full Screen / Esc
Printer-friendly Version Interactive Discussion
precisely, humidified (Birmili et al.,2004). This method is used here to relate ambient (unconditioned) and non-volatile (conditioned) particle size distributions. Briefly, the approach of the summation method is to associate particle number segments of equal concentration under both the conditioned and unconditioned particle size distributions. Next, the ratio of the mean particle size of two corresponding particle number segments
5
is calculated. This diameter ratio is interpreted as a particle “growth factor” in the case of humidification, or a particle “shrinking factor” in the case of particulate matter loss due to volatilization. The output discussed in this work are continuous size-dependent functions of particle shrinking factor that relate the residual size of non-volatile particle cores to the particles’ original ambient size.
10
It must be stated that the output of the method can only be interpreted usefully, provided that the number of aerosol particles stays the same during the thermal con-ditioning step. (Otherwise, particle number segments in both distributions cannot be associated in an unambiguous way.) This prerequisite has therefore been carefully examined, and indeed an average ratio of 1.16±0.16 between the total number
con-15
centrations of non-volatile and ambient particles suggests that the output functions can be interpreted as average shrinking factors of particles of a certain original ambient size.
3.4 Air mass classification
Synoptic scale air masses are a useful concept to classify aerosol populations that
20
are shaped by regional aerosol emissions, or during long-range transport. We classi-fied aerosol populations at Melpitz using the daily weather chart “Berliner Wetterkarte” (Geb,1981;Institut f ¨ur Meteorologie,2004), an analysis which takes into account back trajectories and the thermal properties of air masses. The Berliner Wetterkarte analysis distinguishes different regions of climatic origin (A – arctic, P – subpolar, S – subtropic,
25
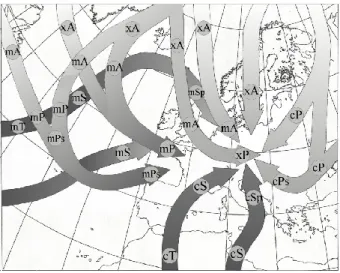
T – tropic) and air mass character (m – maritime, x – mixed type, c – continental). Figure4illustrates a selection of typical back trajectories arriving in Central Europe as well as transformations because of energetic conversions, like the warming of arctic
ACPD
6, 5505–5542, 2006
Size distributions of non-volatile particle residuals and relation
to air mass origin
C. Engler et al. Title Page Abstract Introduction Conclusions References Tables Figures J I J I Back Close
Full Screen / Esc
Printer-friendly Version Interactive Discussion
(A) air into subpolar (P) and further into heated subpolar (Ps), or changes in charac-ter. The Berliner Wetterkarte classification addresses continental influences in that a conversion from the maritime (m) to the mixed (x) type usually occurs after a residence time of 24 h over the continent, and further conversion into the continental (c) type after 3–5 days.
5
For our analysis, the synoptic maps of the 850 hPa-level were analyzed and the air masses over the sampling site were determined. In addition, the exact times of frontal passages were identified using time series of locally measured meteorological data (temperature, humidity, rainfall) at Melpitz, which led to a distinction between subse-quent air masses as fine as possible. Particle size distributions were subsesubse-quently
10
averaged over the data sets corresponding to each air mass type. 3.5 Cluster analysis
Back trajectories have been recognized as a valuable tool to investigate the origin of air pollutants (Stohl,1998). Consequently, back trajectory cluster analysis was applied in this work as an alternative method for an air mass classification of particle size
distribu-15
tions. Some major advantages of the cluster method are that it can be automated, and provides a higher degree of objectiveness than the synoptic classification described above.
We applied a k-means cluster algorithm, which was developed closely following the approach first reported by Dorling et al. (1992), and divided the entire dataset into
20
a predetermined number of trajectory clusters. The groundwork of the cluster analy-sis were back trajectories calculated using the HYSPLIT4 (HYbrid Single-Particle La-grangian Integrated Trajectory) model (Draxler and Hess,2004).
In addition, vertical profiles of pseudopotential temperature calculated from regular radiosonde ascents at the Station Oppin, 50 km distant to Melpitz were used. Profiles
25
of pseudopotential temperature have been incorporated in the variables to be clustered because vertical temperature profiles characterize the degree of vertical atmospheric stratification, which is of elementary importance to any surface measurement of
ACPD
6, 5505–5542, 2006
Size distributions of non-volatile particle residuals and relation
to air mass origin
C. Engler et al. Title Page Abstract Introduction Conclusions References Tables Figures J I J I Back Close
Full Screen / Esc
Printer-friendly Version Interactive Discussion
spheric constituents.
The following Euclidian distances were computed to express the spatial separation between two back trajectories i and j :
Li j = 1 K X k v u u t 3 X l=1 al(xl i − xl j)2. (1)
Here, K is the number of trajectory points. K=144 was chosen to represent hourly back
5
trajectory positions over 6 days. l is the dimension of the vector to be clustered, which includes the three variables of geographical latitude and longitude (both in Cartesian coordinates), and pseudopotential temperature. al are the weights required to create three variables of equitable magnitude; a1, a2, and a3were chosen as 1.25 degree−1, 0.8 degree−1, and 10/1 K−1. Notably, the choice of a3required prior test runs because
10
temperature is a variable entirely dissimilar from geographical position.
In practice, the cluster algorithm was run for a range of cluster numbers between 3 and 14. Selecting a small number of clusters will generate larger, more representative sub-sets of data. On the contrary, using a higher number of clusters will resolve more features of different aerosol types. The decision, how many clusters to use for the final
15
discussion of the size distribution data reflected a compromise between simplicity of display (low n) and a more visible separation of the data clusters, and yielded the two options of n=7 (for a3=10) and n=11 (for a3=1).
4 Effects of air mass history
4.1 Berliner Wetterkarte air mass classification
20
First, the results obtained from a segregation of the 12-month size distribution data set into the various air mass types after the Berliner Wetterkarte are discussed. The
ACPD
6, 5505–5542, 2006
Size distributions of non-volatile particle residuals and relation
to air mass origin
C. Engler et al. Title Page Abstract Introduction Conclusions References Tables Figures J I J I Back Close
Full Screen / Esc
Printer-friendly Version Interactive Discussion
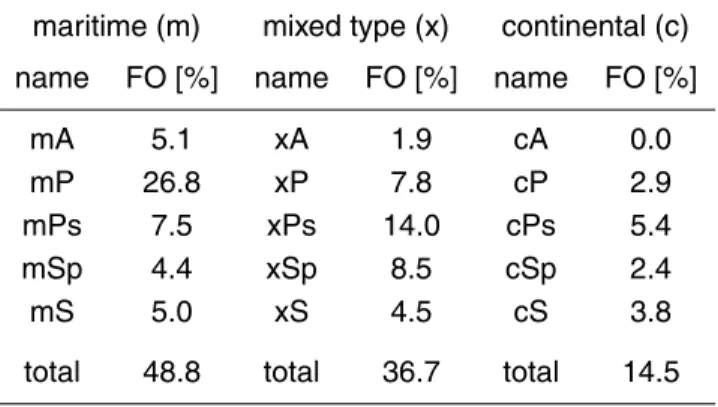
frequency of occurrence of the air mass types can be seen in Table2. A general result is that pronounced continental air (“c”) was only sampled on about 15% of the time.
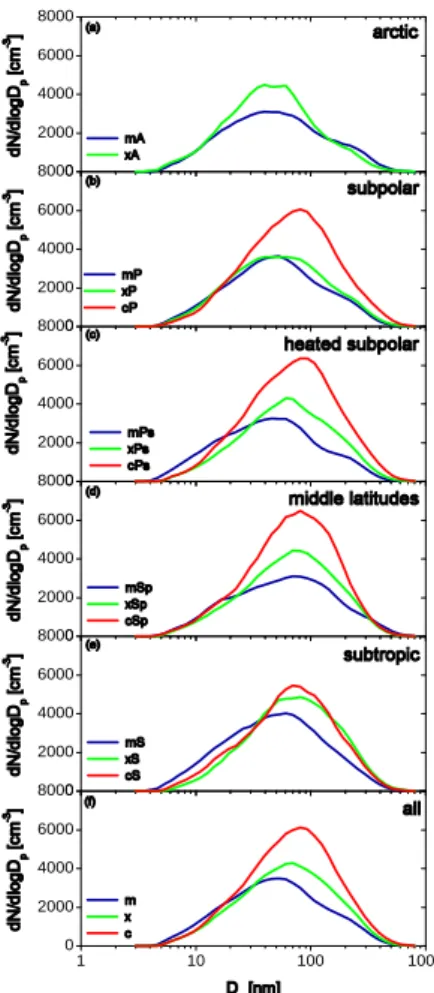
Figure 5 shows the the typical (median) values of the ambient particle size distri-butions in each of the air masses. It can be noted that the overall differences in size distributions between the maritime (“m”) and the mixed (“x”) type air masses were
rela-5
tively minor. A possible explanation is the location of the Melpitz sampling site in east-ern Germany, i.e., surrounded by populated areas with anthropogenic aerosol sources. Clean maritime air, e.g., is required to cover a distance of at least 400 km over land be-fore arriving at Melpitz, leaving enough time for the uptake of anthropogenic emissions. Maritime type air masses have, per definition, spent less than 24 h over land, but the
10
continental influence is already visible in an increased total particle concentration. In subpolar air masses, however, the difference between the maritime and mixed type on the one hand, and continental air on the other hand is significant (Fig.5b). In maritime air, Aitken and accumulation mode were separated by a concentration mini-mum at most times. This minimini-mum (sometimes also referred to as “Hoppel”-minimini-mum)
15
is thought to result from the activation of Aitken particles in non-precipitating clouds. In mixed-type and continental air masses, only one broad particle mode is usually ob-served with a concentration maximum between about 70 to 90 nm.
Figure5f aggregates the air masses into only character categories, and again points out the different modal features of the size distributions in the air mass types “m”, “x”,
20
and “c”. Another relevant observation is the gradual increase in accumulation mode concentration from maritime (3500 cm−3) to continental (6200 cm−3) air masses.
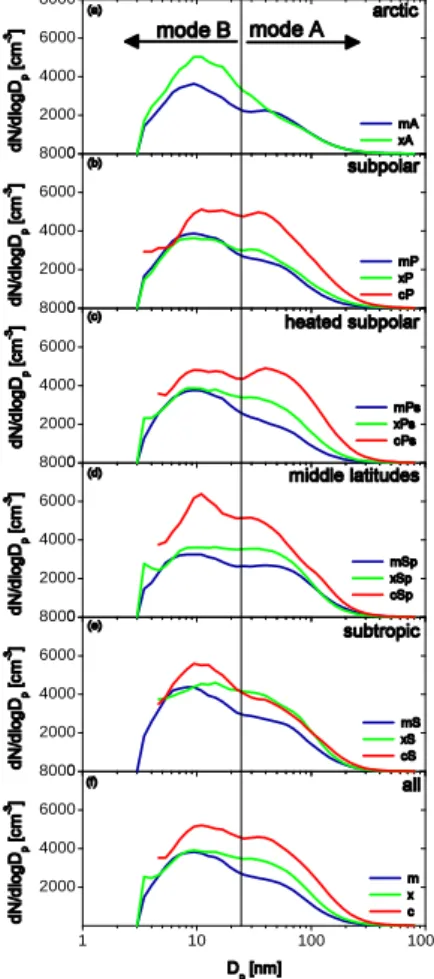
In contrast to the previous text, Fig.6concentrates on the non-volatile particle size distributions, i.e., those measured downstream the thermodenuder. Generally, the non-volatile size distributions show overall variations between different air masses of a
25
magnitude similar to the unconditioned size distributions. Likewise, the highest total concentrations were observed in pronounced continental air masses.
The non-volatile size distributions are marked by one common feature: the original, nearly monomodal distributions (Fig.5) tended to evolve into bimodal distributions after
ACPD
6, 5505–5542, 2006
Size distributions of non-volatile particle residuals and relation
to air mass origin
C. Engler et al. Title Page Abstract Introduction Conclusions References Tables Figures J I J I Back Close
Full Screen / Esc
Printer-friendly Version Interactive Discussion
thermal conditioning (Fig. 6). This bimodal shape is caused by the split-up of the ambient distribution maximum between 50 and 100 nm in the thermodenuder: Entirely non-volatile particles will remain at approximately the same size, whereas partially volatile particles will appear in the second non-volatile mode, around 10–20 nm (Fig.6). Entirely non-volatile particles were found to be scarce in the size range <30 nm
5
(cf. Sect.3.1). Therefore, the particle mode “B” in Fig.6(<30 nm) consists overwhelm-ingly of the non-volatile residues of originally larger particles, whereas the particle mode “A” (>30 nm) is composed of both entirely non-volatile particles and non-volatile residues of larger particles. It is therefore mode “A”, which is sensitive towards varia-tions in the concentration of entirely non-volatile particles, and it is this mode which we
10
associate with primary emissions from combustion, such as soot, in a rural aerosol. The typical modal diameters of mode “A” are between 70 and 90 nm, and show a minor dependency of the air mass type only (Fig.6). The latter observation confirms that the anthropogenic source contributions (associated with the non-volatile PM con-tribution) are similar in all wind directions from the Melpitz observation site. However,
15
the concentration of mode “A” appears to be the most sensitive with regard to different air mass types. The highest concentration in mode “A” occurred in air masses “cPs”, which represent aged and dry continental air masses originating from Eastern Europe (cf. Fig.4).
Mode “B”, the non-volatile particle mode <30 nm was, in contrast, less influenced
20
by different air mass types. This suggests that these non-volatile cores of originally larger ambient particles are more homogeneously emitted, or generated in the wider area around the Melpitz site. The chemical composition of the non-volatile residues of these particles is unknown; while their evaporated material contained the inorganic substances with evaporation temperatures below 300◦C (cf. Table 1), little is known
25
about the thermal behavior of organic atmospheric particulate species. Wehner et al. (2005) previously analyzed particle formation events at Melpitz and found that particles
<30 nm that were newly formed from gaseous species always had a non-volatile core
at 300◦C. A hypothesis raised inWehner et al.(2005) was that organic aerosol species 5518
ACPD
6, 5505–5542, 2006
Size distributions of non-volatile particle residuals and relation
to air mass origin
C. Engler et al. Title Page Abstract Introduction Conclusions References Tables Figures J I J I Back Close
Full Screen / Esc
Printer-friendly Version Interactive Discussion
might polymerize within the particle phase, thus generating non-volatile particle mate-rial. Support to this hypothesis was recently obtained by laboratory experiments using atmospherically relevant organic species (Kalberer et al.,2004).
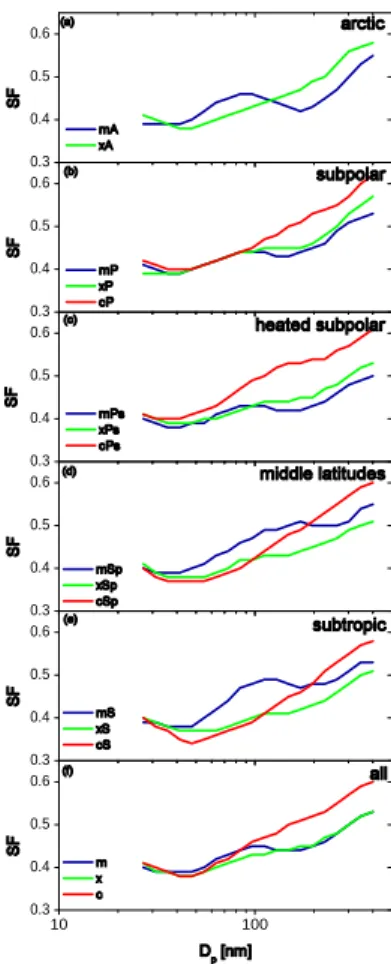
Figure 7 shows the diameter shrinking factors (SF) due to particle volatilization at 300◦C. The shrinking factors SF represent an average ratio between particle
diame-5
ters after and before conditioning in the thermodenuder. The larger the SF, the more non-volatile material was contained in the aerosol under investigation. In contrast to the size distributions, SF is an intensive variable that depends on the chemical composition of the particles, not on their absolute concentration. Since the calculation method de-scribed in Sect.3.3does not resolve external mixture, each value of SF corresponds to
10
the average over the more and less volatile subfractions of particles at a given ambient size.
The principal observation for rural Melpitz aerosol was that accumulation mode par-ticles contained more non-volatile material (SF=0.55 at 400 nm) than Aitken and nucle-ation mode particles (SF=0.37 at 30 nm). The two examples correspond to non-volatile
15
volumetric fractions of 17 and 5%, respectively. This trend is systematic through all ob-servations, and is interpreted as increasing fractions of elemental carbon, as well as crustal material with increasing particle size.
The air mass-related differences demonstrate an increased amount of non-volatile material especially in continental (“c”) air. The feature is best seen for particles
20
>100 nm in the air mass type “cPs” in Fig. 7c, and reflects an enrichment of the chemical compounds associated with non-volatile PM, such as elemental carbon (see Sect.3.2). Below 70 nm, only minor differences in SF were found for different air mass types; this implies that nucleation mode and young Aitken particles – which are typi-cally only a few days old, tend to follow a more uniform spatial distribution regarding
25
chemical composition than accumulation mode particles.
It is interesting to note that in maritime air masses, the functions of SF is not monotonous with particle size, but often have a minor maximum around 100 nm and a minor minimum at diameters above (Fig.7). This points towards a size-segregated
ACPD
6, 5505–5542, 2006
Size distributions of non-volatile particle residuals and relation
to air mass origin
C. Engler et al. Title Page Abstract Introduction Conclusions References Tables Figures J I J I Back Close
Full Screen / Esc
Printer-friendly Version Interactive Discussion
chemical composition, with a maximum amount of volatile material in particles of the size range 150–200 nm. The relative fraction of volatile material, such as ammonium sulfate and nitrate is expected to be especially large in particles that were activated the first time in a non-precipitating cloud (Hoppel et al.,1994;Birmili et al.,1999), and it is exactly the corresponding particle size range where we see the minor minimum in SF.
5
In conclusion, our size segregated SF data are consistent with the picture of secondary aerosol formation in non-precipitating clouds, a process that is more likely to occur in the humid air masses belonging to the characters “m” and “x” than to “c”.
The state of external mixture of rural aerosol particles at Melpitz has been shown to be roughly bimodal in Sect. 3.1. Moreover, a relatively fixed diameter ratio could
10
be seen between the sub-populations of non-volatile and more volatile particles after thermo-conditioning. We made use of this knowledge to retrieve the relative number fraction of these two populations in 150 nm particles from the 12-month dual size dis-tribution data. The corresponding calculation showed that on annual average ca. 17% of the 150 nm particles were entirely non-volatile, i.e., associated with externally mixed
15
soot in air masses “c”, and 6.5% in air masses “m”. 4.2 Cluster analysis
As an alternative to the Berliner Wetterkarte air mass analysis, a cluster analysis based on back trajectories and temperature profiles was performed for the entire dataset. In this section, the corresponding results are presented for the cluster numbers n=7, and
20
n=11 and compared to the former analysis.
Figure8and Table3give an overview over the particle size distribution, back trajec-tories, trace gas concentration, and meteorological parameters that are representative for each of the clusters of the analysis n=7. Generally, the largest differences between different trajectory clusters could be seen in the size range >70 nm of ambient particles
25
(Fig.8d), i.e., the accumulation mode range. The highest concentrations occurred in cluster No. 5, which corresponds largely to the air mass type “cPs” reported before in the Berliner Wetterkarte analysis. The lowest concentration occurred in cluster No. 2,
ACPD
6, 5505–5542, 2006
Size distributions of non-volatile particle residuals and relation
to air mass origin
C. Engler et al. Title Page Abstract Introduction Conclusions References Tables Figures J I J I Back Close
Full Screen / Esc
Printer-friendly Version Interactive Discussion
which corresponds to a fast moving, maritime air mass. In cluster No. 2, the average size distribution is evidently bimodal, showing the accumulation mode (Dp∼200 nm) as a shoulder to the Aitken mode (Dp∼40 nm). The diameter shrinking factor for cluster No. 2 shows a minimum between 150 and 200 nm, which indicates a high fraction of volatile compounds in the accumulation mode (see Fig.8d), probably caused by liquid
5
phase formation in non-precipitating clouds (cf. discussion above).
An important factor determining the observed accumulation mode concentrations is vertical atmospheric stability: Fig.8b displays the average vertical profiles of virtual po-tential temperature for each cluster, obtained from radiosonde ascents. According to the figure, the atmosphere was vertically most stable in cluster No. 4 and most unstable
10
in cluster No. 1. The three clusters with the highest atmospheric stability (4, 3, 5) were also associated with the highest accumulation mode concentrations. Conversely, the clusters with the highest instability (1, 2, 6) were associated with the lowest accumu-lation mode concentrations. A key result in this context is also the increased fraction of non-volatile chemical compounds (SF=0.50) under stable atmospheric conditions
15
(Fig.8f). The explanation for both increased particle numbers and SF is that under inhibited vertical mixing, anthropogenic emissions from the ground remain trapped in a shallow ground layer, and cannot be removed vertically. These findings emphasize that stable atmospheric stratification is the most important meteorological condition to cause high aerosol concentrations in the ground layer, even in rural areas.
20
Differences between different air masses can also be seen for nucleation mode parti-cles <30 nm: The highest number concentrations (median values) were related to clus-ter No. 1 (Fig.8d). The periods of cluster No. 1 were accompanied by the the highest frequency of new particle formation events (Table3). Cluster No. 1 is representative for very unstable air, originating from the North Sea, and low levels of pollutants like NOx
25
(Table3). In this weather, the sky is usually clear which leads to the likely photochem-ical production of aerosol precursors. The meteorologphotochem-ical situation corresponding to cluster No. 1 appears to be the most favorable for atmospheric new particle formation in Melpitz, and emphasizes the great degree of meteorological control on new
ACPD
6, 5505–5542, 2006
Size distributions of non-volatile particle residuals and relation
to air mass origin
C. Engler et al. Title Page Abstract Introduction Conclusions References Tables Figures J I J I Back Close
Full Screen / Esc
Printer-friendly Version Interactive Discussion
cle formation events. Interestingly, these findings appear to have an equivalent in the Finnish boreal forest, where new particle formation was also observed most frequently with the outbreak of cold air masses (Nilsson et al.,2001).
It can be seen in Fig. 8e that the newly formed particles, which have an ambient size <30 nm, tend to have a non-volatile core <10 nm. As already mentioned, it is a
5
current subject of speculation what the composition of these non-volatile remnants of newly formed particles is. Both sulfuric acid and sulfates are volatile at 300◦C, so more research will be needed to explain particularly the role of organics during the growth of particles to final sizes between 20 and 50 nm.
An overview of the cluster analysis using n=11 clusters is now given in Fig. 9 and
10
Table4. These results are added because the representation using 11 trajectory clus-ters explained some features of the dataset more effectively. One advantage is the increased distinction between the resulting 11 mean trajectories (Fig.9a) compared to the analysis for n=7.
A defined mode of less volatile particles (Dp∼50 nm) was not found in maritime but
15
in mixed type air masses (No. 4, 8, 9 and 11) and was even more distinct in continental air (No. 5, 6 and 7). In this size range, cluster No. 10 (which is similar to the “xPs” type in the former section) showed the highest concentrations in both the ambient and the non-volatile size distribution, but no clear splitting up into two modes was observed.
Values of the diameter shrinking factor between 0.35 and 0.52 were observed in
20
maritime, unstable air masses (No. 1, 2 and 3), while stable layered, continental air masses (No. 5, 6, 8) showed higher values between 0.4 and 0.57. One single exception was found in cluster No. 7, which is representing a continental air mass of medium stability. In this cluster, minimum values of the diameter shrinking factor (0.3 to 0.5) but high values of the SO2-concentration were found. This is why the aerosol particles
25
of this cluster (especially in the size range <100 nm) are assumed to consist of a high sulfate fraction, which is volatile at 300◦C.
As a general result it has to be pointed out, that the more an air mass is influenced by the continent and the more stable it is layered, the higher are the particle number
ACPD
6, 5505–5542, 2006
Size distributions of non-volatile particle residuals and relation
to air mass origin
C. Engler et al. Title Page Abstract Introduction Conclusions References Tables Figures J I J I Back Close
Full Screen / Esc
Printer-friendly Version Interactive Discussion
centrations in the accumulation mode range and the fractions of non-volatile chemical compounds in the entire size range regarded.
5 Summary and conclusions
In this work, a new type of atmospheric data, a combined set of ambient and non-volatile particle number size distributions was explored with regard to the influence of
5
synoptic scale air masses. Initial measurements by a Volatility-TDMA demonstrated that rural aerosol particles in the Melpitz region (diameter <200 nm) consist of at least two externally mixed volatility modes. The non-volatile particle mode was as-sociated with an external mixture of mainly soot, whereas the more volatile mode is interpreted to represent all internally mixed particles containing inorganic ions, organic
10
compounds, and a non-volatile residuum. Simulations and measurements of the size distributions of non-volatile particle cores using V-TDMA and TD-TDMPS data agreed well within the size range 20–200 nm, thereby encompassing most of the occurring total particle number.
Diameter shrinking factors were calculated that represent a diameter fraction of
non-15
volatile material in an aerosol population. Typical values ranged between 0.37 and 0.55 for particles between 30 and 400 nm. The general increase of the diameter shrinking factor with increasing particle size is interpreted as a change of chemical particle com-position with particle size, i.e., a relative enrichment of non-volatile compounds such as elemental carbon and the salts of alkali and earth alkali metals in larger particles.
20
A classification of the size distributions after synoptic scale air masses (“Berliner Wetterkarte”) and back trajectory cluster analysis showed that both the ambient-state and non-volatile particle size distributions at Melpitz varied significantly with air mass origin and character. Two distinct physical modes (i.e., Aitken and accumulation mode) were found in maritime air masses only, whereas continental aerosols showed
over-25
whelmingly a single particle mode around 100 nm. The total number concentrations were higher by a typical factor of about two in continental air compared to maritime air
ACPD
6, 5505–5542, 2006
Size distributions of non-volatile particle residuals and relation
to air mass origin
C. Engler et al. Title Page Abstract Introduction Conclusions References Tables Figures J I J I Back Close
Full Screen / Esc
Printer-friendly Version Interactive Discussion
(on average 5900 cm−3 and 3700 cm−3, respectively).
The particle size range >50 nm showed its highest concentration in air masses of continental character. These eastern and continental European air masses involve long residence times (>4 days) of tropospheric air over densely populated land. Be-sides anthropogenic emissions, the reduced atmospheric humidity and, consequently,
5
reduced wet deposition is an explanation for these accumulative effects. Notably, the highest diameter fraction of non-volatile particle material >50 nm correlated very con-sistently with the situations of highest atmospheric stability, and therefore confirm the accumulation of primary emissions in these air masses as a dominating effect control-ling particle number concentration.
10
Using a combination of long-term TD-TDMPS size distributions and representative short-term V-TDMA information, we further estimated the number fraction of non-volatile (i.e., “soot”) particles of the total number concentration of 150 nm particles. These calculations yielded an average soot particle number fraction of 17% in conti-nental, and 6.5% in maritime air masses over the 12-month observation period.
15
It is a noticeable result, that the highest particle concentrations in the size range
<50 nm occurred mainly in air masses from the North Sea, and Scandinavia, all
ac-companied by relatively low levels of anthropogenic trace gases but also by unstable atmospheric stratification. The origin of these air masses does not correlate with the centers of anthropogenic pollution, so most of these particles are thought to be formed
20
by secondary pathways. The noticeable correlation between secondary particles and unstable air indicates that the secondary particle formation process is controlled to a considerable degree by meteorological processes, rather than by peak values of po-tential gas phase precursors.
Acknowledgements. Parts of this work were funded by the FAT (F ¨ordervereinigung
Automobil-25
technik).
We acknowledge funding through the German Federal Environment Agency (UBA) grant UFO-PLAN 203 432 57/05.
Back trajectories were calculated on the NOAA ARL READY Website using the HYSPLIT (HY-5524
ACPD
6, 5505–5542, 2006
Size distributions of non-volatile particle residuals and relation
to air mass origin
C. Engler et al. Title Page Abstract Introduction Conclusions References Tables Figures J I J I Back Close
Full Screen / Esc
Printer-friendly Version Interactive Discussion
brid Single-Particle Lagrangian Integrated Trajectory) Model (Reference: Draxler, R. R. and Rolph, G. D., 2003, NOAA Air Resources Laboratory, Silver Spring, MD, USA).
References
Ackerman, T. P. and Toon, O. B.: Absorption of visible radiation in atmosphere containing mixtures of absorbing and nonabsorbing particles, Appl. Opt., 20, 3661–3668, 1981. 5507
5
Andreae, M. O. and Merlet, P.: Emission of trace gases and aerosols from biomass burning, Global Biogeochem. Cycles, 15, 955–966, 2001. 5507
Birmili, W., Stratmann, F., and Wiedensohler, A.: Design of a DMA-based size spectrometer for a large particle size range and stable operation, J. Aerosol Sci., 30, 549–553, 1999. 5509,
5520
10
Birmili, W., Wiedensohler, A., Heintzenberg, J., and Lehmann, K.: Atmospheric particle number size distribution in central Europe: Statitical relations to air masses and meteorology, J. Geophys. Res., 106, 32 005–32 018, 2001. 5507,5537
Birmili, W., Nowak, A., Schwirn, K., Lehmann, K., Massling, A., and Wiedensohler, A.: A new method to accurately relate dry and humidified number size distributions of atmospheric
15
aerosols, J. Aerosol Sci., Abstracts of EAC, Budapest 2004, I, 15–16, 2004. 5514
Bond, T. C., Anderson, T. L., and Campbell, D.: Calibration and intercomparison of filter-based measurements of visible light absorption by aerosols, Aerosol Sci. Technol., 30, 582–600, 1999. 5508
Bond, T. C., Streets, D. G., Yarber, K. F., Nelson, S. M., Woo, J.-H., and Klimont, Z.: A
20
technology-based global inventory of black and organic carbon emissions from combustion, J. Geophys. Res., 109, D14 203, doi:10.1029/2003JD003697, 2004. 5507
Burtscher, H., Baltensperger, U., Bukowiecki, N., Cohn, P., H ¨uglin, C., Mohr, M., Nyeki, S., Schmatloch, V., Streit, N., and Weingartner, E.: Separation of volatile and non-volatile aerosol fractions by thermodesorption: instrumental development and applications,
25
J. Aerosol Sci., 32, 427–442, 2001. 5508
Cachier, H., Bremond, M.-P., and Buat-M ´enard, T.: Determination of atmospheric soot carbon with a simple thermal method, Tellus, 41B, 379–390, 1989. 5512
Covert, D. S., Wiedensohler, A., Aalto, P., Heintzenberg, J., McMurry, P. H., and Leck, C.:
ACPD
6, 5505–5542, 2006
Size distributions of non-volatile particle residuals and relation
to air mass origin
C. Engler et al. Title Page Abstract Introduction Conclusions References Tables Figures J I J I Back Close
Full Screen / Esc
Printer-friendly Version Interactive Discussion
Aerosol number size distributions from 3 to 500 nm diameter in the arctic marine boundary layer during summer and autumn, Tellus, 48B, 197–212, 1996. 5507
Donaldson, K., Stone, V., Clouter, A., Renwick, L., and MacNee, W.: Ultrafine particles, J. Occup. Environ. Medicine, 58, 194–199, 2001. 5507
Dorling, S. R., Davies, T. D., and Pierce, C. E.: Cluster analysis: a technique for estimating the
5
synoptic meteorological controls on air and precipitation chemistry method and applications, Atmos. Environ., 26A, 2575–2581, 1992. 5515
Draxler, R. R. and Hess, G. D.: Description of the HYSPLIT4 modeling system, NOAA Technical Memorandum, ERL, ARL–224, 2004. 5515
Geb, M.: Klimatologische Grundlagen der Luftmassenbestimmung, (in German), Beilage zur
10
Berliner Wetterkarte 50/81, Institut f ¨ur Meteorologie, Freie Universit ¨at Berlin, 1981. 5514,
5537
Harris, S. J. and Maricq, M. M.: Signature size distributions for diesel and gasoline engine exhaust particulate matter, J. Aerosol Sci., 32, 749–764, 2001. 5511
Haywood, J. and Boucher, O.: Estimates of the direct and indirect radiative forcing due to
15
tropospheric aerosols: A review, Rev. Geophys., 38, 513–543, 2000. 5507
Heintzenberg, J. and Wendisch, M.: On the sensitivity of cloud albedo to the partitioning of particulate absorbers in cloudy air, Contr. Atmos. Phys., 69, 491–499, 1996. 5507
Heintzenberg, J., Birmili, W., Wiedensohler, A., Nowak, A., and Tuch, T.: Structure, variability and persistence of the submicrometer marine aerosol, Tellus, 56B, 357–367, 2004. 5507
20
Hoppel, W. A., Frick, G. M., Fitzgerald, J. W., and Larson, R. E.: Marine boundary layer mea-surements of new particle formation and the effects nonprecipitating clouds have on aerosol size distribution, J. Geophys. Res., 99, 14 443–14 459, 1994. 5520
Institut f ¨ur Meteorologie: Berliner Wetterkarte, Freie Universit ¨at Berlin, Germany, 2004. 5514,
5537
25
Jacobson, M. Z.: Strong radiative heating due to the mixing state of black carbon in atmospheric aerosols, Nature, 409, 695–697, 2001. 5507
Johnson, G. R., Ristovski, Z., and Morawska, L.: Method for measuring the hygroscopic be-haviour of lower volatility fractions in an internally mixed aerosol, J. Aerosol Sci., 35, 443– 455, 2004. 5530
30
Kalberer, M., Paulsen, D., Sax, M., Steinbacher, M., Dommen, J., Prevot, A. S. H., Fisseha, R., Weingartner, E., Franevich, V., Zenobi, R., and Baltensperger, U.: Identification of polymers as major components of atmospheric organic aerosols, Science, 303, 1659–1662, 2004.
ACPD
6, 5505–5542, 2006
Size distributions of non-volatile particle residuals and relation
to air mass origin
C. Engler et al. Title Page Abstract Introduction Conclusions References Tables Figures J I J I Back Close
Full Screen / Esc
Printer-friendly Version Interactive Discussion
5519
Koponen, I., Virkkula, A., Hillamo, R., Kerminen, V.-M., and Kulmala, M.: Number size distribution and concentrations of marine aerosols: Observations during a cruise be-tween the English Channel and the coast of Antarctica, J. Geophys. Res., 107, 4753, doi:10.1029/2002JD002533, 2002. 5507
5
Kriv ´acsy, Z., Hoffer, A., S´arv´ari, Z., Temesi, D., Baltensperger, U., Nyeki, S., Weingartner, E., Kleefeld, S., and Jennings, S. G.: Role of organic and black carbon in the chemical composition of atmospheric aerosol at European background sites, Atmos. Environ., 35, 6231–6244, 2001. 5507
Kuhlbusch, T. A. J., Hertlein, A.-M., and Sch ¨utz, L. W.: Sources, determination, monitoring, and
10
transport of carbonaceous aerosols in Mainz, Germany, Atmos. Environ., 32, 1097–1110, 1998. 5512
Lide, D. R. (Ed.): CRC Handbook of chemistry and physics (77th ed.), CRC Press, Boca Raton, Fl., 1996. 5530
M ¨akel ¨a, J. M., Koponen, I. K., Aalto, P., and Kulmala, M.: One-year data of submicron size
15
modes of tropospheric background aerosol in southern Finland, J. Aerosol Sci., 31, 595– 611, 2000. 5507
Nilsson, E. D., Paatero, J., and Boy, M.: Effects of air masses and synoptic weather on aerosol formation in the continental boundary layer, Tellus, 53B, 462–478, 2001. 5522
Oberd ¨orster, G.: Pulmonary effects of inhaled ultrafine particles, International Archives of
Oc-20
cupational Environmental Health, 74, 1–8, 2001. 5507
Ogren, J. A. and Charlson, R. J.: Elemental carbon in the atmosphere: cycle and lifetime, Tellus, 35B, 241–254, 1983. 5507
Philippin, S., Wiedensohler, A., and Stratmann, F.: Measurements of non-volatile fractions of pollution aerosols with an eight-tube volatility tandem differential mobility analyzer
(VTDMA-25
8), J. Aerosol Sci., 35, 185–203, 2004. 5510,5511
Pinnick, R. G., Jennings, S. G., and Fernandez, G.: Volatility of aerosols in the arid southwest-ern United States, J. Atmos. Sci., 44, 562–576, 1987. 5530
Plewka, A., Gnauk, T., Br ¨uggemann, E., Neus ¨uß, C., and Herrmann, H.: Size-resolved aerosol characterization for a polluted episode at the IfT research station Melpitz in Autumn 1997, J.
30
Atmos. Chem., 48, 131–156, 2004. 5513
Putaud, J.-P., Raes, F., van Dingenen, R., Br ¨uggemann, E., Facchini, M.-C., Decesari, S., Fuzzi, S., Gehrig, R., H ¨uglin, C., Laj, P., Lorbeer, G., Maenhaut, W., Mihalopoulos, N., M ¨uller,
ACPD
6, 5505–5542, 2006
Size distributions of non-volatile particle residuals and relation
to air mass origin
C. Engler et al. Title Page Abstract Introduction Conclusions References Tables Figures J I J I Back Close
Full Screen / Esc
Printer-friendly Version Interactive Discussion
K., Querol, X., Rodr´iguez, S., Schneider, J., Spindler, G., ten Brink, H., Tørseth, K., and Wiedensohler, A.: A European aerosol phenomenology – 2: Chemical characteristics of particulate matter at kerbsite, urban, rural and background sites in Europe, Atmos. Environ., 38, 2579–2595, 2004. 5509,5512
Ramanathan, V., Crutzen, P. J., Kiehl, J. T., and Rosenfeld, D.: Aerosols, climate, and the
5
hydrological cycle, Science, 294, 2119–2124, 2001. 5507
Rodr´ıguez, S., van Dingenen, R., Putaud, J.-P., Martins-Dos Santos, S., and Roselli, D.: Nucle-ation and growth of new particles in the rural atmosphere of Northern Italy – relNucle-ationship to air quality monitoring, Atmos. Environ., 39, 6734–6746, 2005. 5507
Rose, D., Wehner, B., Ketzel, M., Engler, C., Voigtl ¨ander, J., Tuch, T., and Wiedensohler, A.:
10
Atmospheric number size distributions of soot particles and estimation of emission factors, Atmos. Chem. Phys., 6, 1021–1031, 2006. 5510,5511,5512
Schmid, O., Eimer, B., Hagen, D. E., and Whitefield, P. D.: Investigation of volatility method for measuring aqueous sulfuric acid on mixed aerosols, Aerosol Sci. Technolol., 36, 877–889, 2002. 5530
15
Stohl, A.: Computation, accuracy and applications of trajectories – a review and bibliography, Atmos. Environ., 32, 947–966, 1998. 5515
Tunved, P., Hansson, H.-C., Kulmala, M., Aalto, P., Viisanen, Y., Karlsson, H., Kristensson, A., Swietlicki, E., Dal Maso, M., Str ¨om, J., and Komppula, M.: One year boundary layer aerosol size distribution data from five nordic background stations, Atmos. Chem. Phys., 3,
20
2183–2205, 2003. 5507
Turpin, B. J., Saxena, P., and Andrews, E.: Measuring and simulating particulate organics in the atmosphere: problems and prospects, Atmos. Environ., 34, 2983–3013, 2000. 5508
van Dingenen, R., Raes, F., Puteaud, J.-P., Baltensperger, U., Charron, A., Facchini, M.-C., Decassari, S., Fuzzi, S., Gehrig, R., Hansson, H.-C., Harrison, R. M., H ¨uglin, C., Jones,
25
A. M., Laj, P., Lorbeer, G., Maenhaut, W., Palmgren, F., Querol, X., Rodr´iguez, S., Schneider, J., ten Brink, H., Tunved, P., Tørseth, K., Wehner, B., Weingartner, E., Wiedensohler, A., and W ˚ahlin, P.: A European aerosol phenomenology – 1: physical characteristics of particulate matter at kerbside, urban, rural and background sites in Europe, Atmos. Environ., 38, 2561– 2577, 2004. 5509
30
Weast, R. C. and Astle, M. J. (Eds.): CRC Handbook of chemistry and physics (61st ed.), CRC Press, Boca Raton, Fl., 1980. 5530
Wehner, B., Philippin, S., and Wiedensohler, A.: Design and calibration of a thermodenuder 5528
ACPD
6, 5505–5542, 2006
Size distributions of non-volatile particle residuals and relation
to air mass origin
C. Engler et al. Title Page Abstract Introduction Conclusions References Tables Figures J I J I Back Close
Full Screen / Esc
Printer-friendly Version Interactive Discussion
with an improved heating unit to measure the size-dependent volatile fraction of aerosol particles, J. Aerosol Sci., 33, 1087–1093, 2002. 5509
Wehner, B., Pet ¨aj ¨a, T., Boy, M., Engler, C., Birmili, W., Tuch, T., Wiedensohler, A., and Kulmala, M.: The contribution of sulfuric acid and non-volatile compounds on the growth of freshly formed atmospheric aerosols, Geophys. Res. Lett., 32, L17 810,
5
doi:10.1029/2005GL023827, 2005. 5518
Weingartner, E., Nyeki, S., and Baltensperger, U.: Seasonal and diurnal variation of aerosol size distributions (10<D<750 nm) at a high-alpine site (Jungfraujoch 3580 m a.s.l.), J. Geo-phys. Res., 104, 26 809–26 820, 1999. 5507
ACPD
6, 5505–5542, 2006
Size distributions of non-volatile particle residuals and relation
to air mass origin
C. Engler et al. Title Page Abstract Introduction Conclusions References Tables Figures J I J I Back Close
Full Screen / Esc
Printer-friendly Version Interactive Discussion Table 1. Boiling points (BP) and volatilization temperatures Tvolof various compounds in pure
form.
Species name BP [◦C] Tvol[◦C]
NaCl sodium chloride 1465a >300b,c,d
Na2SO4 sodium sulfate >300a >300b
NaHSO4 sodium bisulfate – >300b
NaNO3 sodium nitrate – >300b
(NH4)2SO4 ammonium sulfate d 200b,205d NH4HSO4 ammonium bisulfate d 200b,202d NH4NO3 ammonium nitrate 210e 75d NH4Cl ammonium chloride 338a 135b H2SO4 sulfuric acid 337a 139d, 125c
CaSO4 calcium sulfate – >300b
Ca(NO3)2 calcium nitrate – >300b
CaCl calcium chloride 1935a >300b
KNO3 potassium nitrate 400a –
a Lide(1996) b Pinnick et al.(1987) c Schmid et al.(2002) d Johnson et al.(2004) e
Weast and Astle(1980) d: decomposes before boiling
ACPD
6, 5505–5542, 2006
Size distributions of non-volatile particle residuals and relation
to air mass origin
C. Engler et al. Title Page Abstract Introduction Conclusions References Tables Figures J I J I Back Close
Full Screen / Esc
Printer-friendly Version Interactive Discussion Table 2. Frequency of occurrence (FO) of the different air mass types at Melpitz between July
2003 and June 2004.
maritime (m) mixed type (x) continental (c)
name FO [%] name FO [%] name FO [%]
mA 5.1 xA 1.9 cA 0.0
mP 26.8 xP 7.8 cP 2.9
mPs 7.5 xPs 14.0 cPs 5.4
mSp 4.4 xSp 8.5 cSp 2.4
mS 5.0 xS 4.5 cS 3.8
total 48.8 total 36.7 total 14.5
ACPD
6, 5505–5542, 2006
Size distributions of non-volatile particle residuals and relation
to air mass origin
C. Engler et al. Title Page Abstract Introduction Conclusions References Tables Figures J I J I Back Close
Full Screen / Esc
Printer-friendly Version Interactive Discussion Table 3. Back trajectory cluster analysis for 7 air mass types: General air mass properties,
frequency of nucleation events, mean trace gas concentrations [µg/m3], temperature (T) [◦C] and wind speed (WS) [m/s].
Cluster # Origin Stratification Trajectories Nucleation days NO O3 SO2 NOx T WS 1 North Sea very unstable 100 41 1.2 84.5 3.5 8.0 18.0 3.0 2 Atlantic unstable 126 14 1.3 54.2 2.6 9.3 10.5 3.8 3 Western Europe stable 85 1 3.3 26.4 3.7 22.4 7.5 1.7 4 North Sea, Germany very stable 29 1 5.0 18.5 5.5 24.6 3.4 1.7 5 Eastern Europe stable 35 6 1.9 35.6 6.0 16.6 4.2 1.8 6 Baltic states unstable 61 7 1.9 50.7 3.7 13.0 6.4 1.8 7 North Sea neutral 132 6 2.0 37.9 2.9 15.2 9.2 1.5
ACPD
6, 5505–5542, 2006
Size distributions of non-volatile particle residuals and relation
to air mass origin
C. Engler et al. Title Page Abstract Introduction Conclusions References Tables Figures J I J I Back Close
Full Screen / Esc
Printer-friendly Version Interactive Discussion Table 4. Back trajectory cluster analysis for 11 air mass types: General air mass properties,
frequency of nucleation events, mean trace gas concentrations [µg/m3], temperature (T) [◦C] and wind speed (WS) [m/s].
Cluster # Origin Stratification Trajectories Nucleation days NO O3 SO2 NOx T WS
1 North Sea unstable 55 7 1.7 49.8 2.3 11.5 9.2 2.9 2 Atlantic unstable 43 4 1.3 53.2 2.4 8.5 8.9 4.0 3 Atlantic, Western Europe unstable 77 9 1.2 54.0 3.1 10.3 12.1 3.8 4 Western Europe neutral 67 – 2.6 29.7 3.8 20.1 7.7 2.1 5 Germany very stable 23 1 4.5 14.6 6.2 25.4 3.3 1.5 6 Germany neutral 58 3 3.7 31.4 4.2 21.1 9.3 1.3 7 Eastern Europe neutral 29 3 2.1 42.4 6.1 15.9 6.1 1.8 8 Baltic states neutral 21 6 1.6 50.1 4.8 11.0 2.4 2.3 9 Baltic Sea very unstable 59 16 1.7 66.5 3.1 10.9 11.9 1.8 10 Scandinavia neutral 34 2 2.7 32.1 2.9 17.4 7.0 0.9 11 North Sea, Germany very unstable 102 25 1.3 66.4 3.0 10.8 14.6 2.4
ACPD
6, 5505–5542, 2006
Size distributions of non-volatile particle residuals and relation
to air mass origin
C. Engler et al. Title Page Abstract Introduction Conclusions References Tables Figures J I J I Back Close
Full Screen / Esc
Printer-friendly Version Interactive Discussion Fig. 1. Size distribution before (line) and after (grey area and bold line) thermal conditioning in
the V-TDMA. The arrow shows the initial particle diameter (e.g., 30, 50, 80 or 150 nm).
ACPD
6, 5505–5542, 2006
Size distributions of non-volatile particle residuals and relation
to air mass origin
C. Engler et al. Title Page Abstract Introduction Conclusions References Tables Figures J I J I Back Close
Full Screen / Esc
Printer-friendly Version Interactive Discussion 2 10 100 1000 10 20 30 40 2 10 100 1000 0 2000 4000 6000 8000
Fig. 2. Particle size distributions measured by the TDMPS upstream and downstream the
thermodenuder(a): number, (b): volume. Green lines represent the distribution simulated
from TDMPS (upstream) and V-TDMA external mixture information at sizes of 30, 50, 80, and 150 nm. The data refers to a 6 h measurement period between 06:00 and 18:00 h on 24 August 2003.
ACPD
6, 5505–5542, 2006
Size distributions of non-volatile particle residuals and relation
to air mass origin
C. Engler et al. Title Page Abstract Introduction Conclusions References Tables Figures J I J I Back Close
Full Screen / Esc
Printer-friendly Version Interactive Discussion 20 100 1000 10 100 1000
Fig. 3. Decomposing simulated non-volatile particle number distributions into externally mixed
non-volatile particles (“primary soot”), and the non-volatile cores of internally mixed particles. The curves refer to the same data set as those in Fig.2.
ACPD
6, 5505–5542, 2006
Size distributions of non-volatile particle residuals and relation
to air mass origin
C. Engler et al. Title Page Abstract Introduction Conclusions References Tables Figures J I J I Back Close
Full Screen / Esc
Printer-friendly Version Interactive Discussion Fig. 4. Trajectories of air masses on their way to central Europe as well as transformations
because of changes in heat content and character. AfterGeb(1981), supplement ofInstitut f ¨ur Meteorologie(2004). FromBirmili et al.(2001), Copyright [2001] American Geophysical Union. Reproduced by permission of American Geophysical Union.
ACPD
6, 5505–5542, 2006
Size distributions of non-volatile particle residuals and relation
to air mass origin
C. Engler et al. Title Page Abstract Introduction Conclusions References Tables Figures J I J I Back Close
Full Screen / Esc
Printer-friendly Version Interactive Discussion 0 2000 4000 6000 8000 0 2000 4000 6000 8000 0 2000 4000 6000 8000 0 2000 4000 6000 8000 0 2000 4000 6000 8000 1 10 100 1000 0 2000 4000 6000 8000
Fig. 5. Maritime (m), mixed type (x) and continental (c) character ambient particle size
distri-butions (median values) for different air mass origin according to the air mass classification. 5538
![Table 3. Back trajectory cluster analysis for 7 air mass types: General air mass properties, frequency of nucleation events, mean trace gas concentrations [µg/m 3 ], temperature (T) [ ◦ C]](https://thumb-eu.123doks.com/thumbv2/123doknet/14775272.593378/29.918.61.646.313.414/trajectory-analysis-general-properties-frequency-nucleation-concentrations-temperature.webp)
![Table 4. Back trajectory cluster analysis for 11 air mass types: General air mass properties, frequency of nucleation events, mean trace gas concentrations [µg/m 3 ], temperature (T) [ ◦ C]](https://thumb-eu.123doks.com/thumbv2/123doknet/14775272.593378/30.918.57.651.292.437/trajectory-analysis-general-properties-frequency-nucleation-concentrations-temperature.webp)