HAL Id: hal-00302863
https://hal.archives-ouvertes.fr/hal-00302863
Submitted on 11 Jun 2007HAL is a multi-disciplinary open access
archive for the deposit and dissemination of sci-entific research documents, whether they are pub-lished or not. The documents may come from teaching and research institutions in France or abroad, or from public or private research centers.
L’archive ouverte pluridisciplinaire HAL, est destinée au dépôt et à la diffusion de documents scientifiques de niveau recherche, publiés ou non, émanant des établissements d’enseignement et de recherche français ou étrangers, des laboratoires publics ou privés.
Urban Visible/SWIR surface reflectance ratios from
satellite and sun photometer measurements in Mexico
City
A. D. de Almeida Castanho, R. Prinn, V. Martins, M. Herold, C. Ichoku, L.
T. Molina
To cite this version:
A. D. de Almeida Castanho, R. Prinn, V. Martins, M. Herold, C. Ichoku, et al.. Urban Visible/SWIR surface reflectance ratios from satellite and sun photometer measurements in Mexico City. Atmo-spheric Chemistry and Physics Discussions, European Geosciences Union, 2007, 7 (3), pp.8113-8139. �hal-00302863�
ACPD
7, 8113–8139, 2007Surface properties Mexico City using
MODIS A. D. de Almeida Castanho et al. Title Page Abstract Introduction Conclusions References Tables Figures ◭ ◮ ◭ ◮ Back Close
Full Screen / Esc
Printer-friendly Version
Interactive Discussion Atmos. Chem. Phys. Discuss., 7, 8113–8139, 2007
www.atmos-chem-phys-discuss.net/7/8113/2007/ © Author(s) 2007. This work is licensed
under a Creative Commons License.
Atmospheric Chemistry and Physics Discussions
Urban Visible/SWIR surface reflectance
ratios from satellite and sun photometer
measurements in Mexico City
A. D. de Almeida Castanho1, R. Prinn1, V. Martins2,3, M. Herold4, C. Ichoku3,6, and L. T. Molina1,5
1
Massachusetts Institute of Technology, USA 2
JCET, University of Maryland Baltimore County, USA 3
NASA/Goddard Space Flight Center, Greenbelt, Maryland, USA 4
Friedrich-Schiller-University Jena, Germany 5
Molina Center for Energy and the Environment, USA 6
University of Maryland, College Park, Maryland, USA
Received: 16 April 2007 – Accepted: 4 May 2007 – Published: 11 June 2007 Correspondence to: A. D. de Almeida Castanho (castanho@mit.edu)
ACPD
7, 8113–8139, 2007Surface properties Mexico City using
MODIS A. D. de Almeida Castanho et al. Title Page Abstract Introduction Conclusions References Tables Figures ◭ ◮ ◭ ◮ Back Close
Full Screen / Esc
Printer-friendly Version
Interactive Discussion
Abstract
The surface reflectance ratio between the visible (VIS) and shortwave infrared (SWIR) radiation is an important quantity for the retrieval of the aerosol optical depth (τa) from
the MODIS sensor data. Based on empirically determined VIS/SWIR ratios, MODIS τa retrieval uses the surface reflectance in the SWIR band (2.1 µm), where the interaction
5
between solar radiation and the aerosol layer is small, to predict the visible reflectances in the blue (0.47 µm) and red (0.66 µm) bands. Therefore, accurate knowledge of the VIS/SWIR ratio is essential for achieving accurate retrieval of aerosol optical depth from MODIS. The heterogeneity of the surface cover in an urban environment increases the uncertainties in the estimation of the surface reflectance and, consequently, τa. We
10
analyzed the surface reflectance over some distinct surface covers in and around the Mexico City metropolitan area (MCMA) using MODIS radiances at 0.66 µm and 2.1 µm. The analysis was performed at 1.5 km×1.5 km spatial resolution. Also, ground-based AERONET sun-photometer data acquired in Mexico City from 2002 to 2005 were an-alyzed for aerosol optical thickness and other aerosol optical properties. In addition, a
15
network of hand-held sun-photometers deployed in Mexico City, as part of the MCMA-2006 Study during the MILAGRO Campaign, provided an unprecedented measure-ment of τa in 5 different sites well distributed in the city. We found that the average
RED/SWIR ratio representative of the urbanized sites analyzed is 0.73±0.06. This average ratio was significantly different for non-urban sites, which was approximately
20
0.55. The aerosol optical thickness retrieved from MODIS radiances at a spatial res-olution of 1.5 km×1.5 km and averaged within 10 x 10 km boxes were compared with collocated 1-h τa averaged from sun-photometer measurements. The use of the new RED/SWIR ratio of 0.73 in the MODIS retrieval led to a significant improvement in the agreement between the MODIS and sun-photometer results; with the slope, offset,
25
and the correlation coefficient of the linear regression changing from (τaMODIS = 0.91
τasun−photometer+ 0.33 ,R2=0.66) to (τaMODIS= 0.96 τasun−photometer -0.006, R 2
=0.87).
ACPD
7, 8113–8139, 2007Surface properties Mexico City using
MODIS A. D. de Almeida Castanho et al. Title Page Abstract Introduction Conclusions References Tables Figures ◭ ◮ ◭ ◮ Back Close
Full Screen / Esc
Printer-friendly Version
Interactive Discussion
1 Introduction
Monitoring the atmospheric composition in megacities around the world and under-standing the impact of the emitted pollutants on the local air quality and global climate remains a challenge for the scientific community. The air quality monitoring systems in most megacities have relied almost exclusively on ground-based station networks,
5
which do not provide adequate spatial coverage. Satellites provide a systematic ob-servation of more spatially continuous aerosol properties that are complementary to in situ measurements (Al Saadi et al., 2005; Li et al, 2005). The aerosol optical depth (τa) retrieved at 10 km spatial resolution from the Moderate-resolution Imaging Spectro-radiometer (MODIS) sensor onboard the Terra and Aqua satellites are already
provid-10
ing important information on global aerosol climatology (Remer et al., 2005). With the growing concern of the emissions of particulate matter in megacities, there is increased interest in higher resolution τadata from satellite retrievals. Such higher resolution data will be helpful to describe the detailed distribution of the pollution plume in cities, and aid in air quality monitoring and forecasting. Higher spatial resolution can also help
15
to better understand the direct or indirect radiative effects of aerosol plumes in urban areas and to illuminate research on how the urban aerosol plumes contribute to cli-mate impacts on the global scale. However, to achieve a higher spatial resolution in
τa retrieval from the MODIS instrument over urban areas, it is essential to have more accurate information on the surface reflectance and aerosol optical properties.
20
Sensitivity studies performed in this work for τaestimates show that an error of ±10%
on a surface reflectance (ρsurf) of 0.15 at 2.1 µm wavelength can introduce an error in τa of up to 65% when τa values are around 0.2. The sensitivity of τa to surface
reflectance decreases for higher τa values, although it increases as a function of the
surface reflectance. Mexico City has a surface reflectance that ranges from 0.1 to 0.25
25
at 2.1 µm wavelength, which is close to the acceptable limit in the standard MODIS aerosol retrieval algorithm over land (ρsurf(2.1 µm)=0.25) (King et al., 2003; Remer et al., 2005).
ACPD
7, 8113–8139, 2007Surface properties Mexico City using
MODIS A. D. de Almeida Castanho et al. Title Page Abstract Introduction Conclusions References Tables Figures ◭ ◮ ◭ ◮ Back Close
Full Screen / Esc
Printer-friendly Version
Interactive Discussion Kaufman et al. (1997b) empirically derived a strong correlation between some
visi-ble (VIS) and short-wave infrared (SWIR) wavelength bands over vegetated and dark soil surfaces (ρsurf (0.47 µm) = 0.25 *ρsurf (2.1 µm) and ρsurf (0.66 µm) = 0.5 * ρsurf (2.1 µm)). Kaufman et al. (2002) provide a physical explanation for these VIS/SWIR ratios, which are a key parameter used in the MODIS algorithm to compute τa over
5
land. The ratio is used to estimate the surface reflectance in the visible (0.66 and 0.47 µm) wavelengths based on the radiance measured at 2.1 µm wavelength. The non-Lambertian behavior of the land surfaces are represented by the Bi-directional Reflectance Distribution Functions (BRDF) that vary with wavelength and differences in surface types, which in turn influence the VIS/SWIR ratios. Levy et al. (2007)
per-10
formed extensive analyses on the VIS/SWIR ratios globally at several Aerosol Robotic Network (AERONET) sites. Their work evaluated the principal trends of this ratio and expressed it as a function of scattering angle and normalized difference vegetation in-dex (NDVI SWIR) (Gatebe et al., 2001; Remer et al., 2001). They reported that the ratio increases with higher scattering angle and lower NDVI SWIR (less vegetated area).
15
The heterogeneity of the surface cover in an urban environment only increases the uncertainties in the estimation of the VIS/SWIR ratios. Reducing the uncertainties in-volved in estimating these ratios in urban areas is a critical issue in the τa retrieval
from satellites (Gross, et al., 2005). In this work, we analyzed an unprecedented mea-surement of τafrom a network of sun-photometers deployed in Mexico City during the
20
MILAGRO (Megacity Initiative: Local and Global Research Observations) Campaign in 2006 as part of the MCMA-2006 Study (seehttp://mce2.org). The detailed analysis enabled the determination of a new ρsurf(0.66)/ ρsurf (2.1) ratio for an urban area like Mexico City. We also present the improvement that the new ratio estimate can yield for
τaretrievals over the city.
25
ACPD
7, 8113–8139, 2007Surface properties Mexico City using
MODIS A. D. de Almeida Castanho et al. Title Page Abstract Introduction Conclusions References Tables Figures ◭ ◮ ◭ ◮ Back Close
Full Screen / Esc
Printer-friendly Version
Interactive Discussion
2 The MILAGRO Field Campaign, Instruments, and Measurements
The MILAGRO Campaign was carried out during the month of March 2006 in and around the Mexico City metropolitan area (http://www.eol.ucar.edu/projects/milagro). The Campaign was designed to better understand the local, regional and global im-pact of pollutants generated in megacities, ranging from the health effects through the
5
induced climate change. The MILAGRO field experiment involved more than 400 re-searchers from over 120 institutions in the USA, Mexico, and several other countries. It had four main components: the MCMA-2006 (Mexico City Metropolitan Area – 2006) led by the Molina Center for Energy and the Environment, the MAX-Mex (Megacity Aerosol Experiment in Mexico City) led by the U.S. Department of Energy (DOE)
Atmo-10
spheric Science Program (ASP), the MIRAGE-Mex (Megacity Impacts on Regional and Global Environments) led by the National Center for Atmospheric Research (NCAR), and the INTEX-B (Intercontinental Chemical Transport Experiment Phase B) led by NASA. The Campaign involved coordinated aircraft and ground-based measurements supported by extensive modeling and satellite observations. The ground-based
mea-15
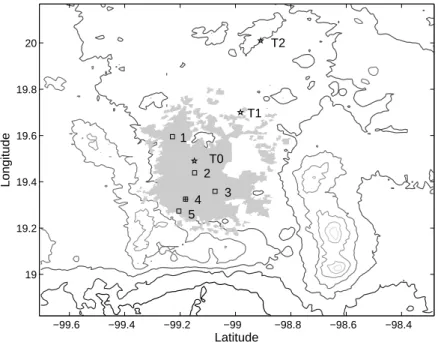
surements were concentrated in 3 main supersites; one in the urban area of Mexico City called T0 and the other two (T1 and T2) were located outside of the city toward the northeast, as shown in Fig. 1. The locations were strategically selected to characterize the transport and transformation of the pollutants exported from the urban area of the city.
20
The Moderate Resolution Imaging Spectroradiometer (MODIS) is a sensor aboard the Terra and Aqua satellites launched by NASA in December 1999 and May 2002, respectively (King et al., 2003; Parkinson, 2003). Both satellites are operating in a sun-synchronous orbit providing data with near daily global coverage, with equator crossing at approximately 10:30 a.m. and 01:30 p.m. local times (Terra and Aqua satellites
re-25
spectively).
In this work, we use MODIS upward reflectance measurements calibrated and ge-olocated, and made available as a Level 1B product (King et al., 2003). We have used
ACPD
7, 8113–8139, 2007Surface properties Mexico City using
MODIS A. D. de Almeida Castanho et al. Title Page Abstract Introduction Conclusions References Tables Figures ◭ ◮ ◭ ◮ Back Close
Full Screen / Esc
Printer-friendly Version
Interactive Discussion the reflectances provided at 500 m resolution for channels centered at 0.47, 0.55, 0.66,
0.86, 1.24, 1.64 and 2.13 µm. Uncertainties in the measured reflectance in the visible and mid-IR are less than 2% (Guenther et al., 2002). All MODIS reflectance data ac-quired over Mexico City from 2002 to 2005 and also for the period of March 2006 were analyzed.
5
The AERONET is a global ground-based network of sun/sky automated radiome-ters (CIMEL Eletronique 318A, France) supported by NASA’s Earth Observing Sys-tem (EOS) and other international institutions (Holben et al., 2001). The instrument makes direct sun radiance measurements every 15 min and sky-measurements ev-ery hour. The AERONET instrument measures τa with an accuracy of ±0.01 (Holben
10
et al, 2001), using solar direct radiance measurements at 1.02, 0.870, 0.670, 0.500, 0.440, 0.380 and 0.340 µm. AERONET instruments also provide the aerosol volume size distribution and refractive indices at 1.02, 0.870, 0.670 and 0.440 µm based on sky-radiance measurements at several angles (Dubovik and King 2000).
The Mexico City AERONET station has been operated continuously since 1999 at
15
the Universidad Nacional Autonoma de Mexico (UNAM), whose location is shown in Fig. 1. During the MCMA-2006 Study, the instrument was moved to the T0 supersite located at IMP (Instituto Mexicano del Petroleo) and operated from March 2 until April 18 2006 (Fig. 1). In addition, there were two other AERONET instruments located at T1 and T2 (Fig. 1). These represent non-urban areas located at approximately 30
20
and 60 km respectively toward the north east from T0. This work uses the AERONET data acquired at UNAM during 2002–2005, and at T0, T1 and T2 for the whole period of March 2006. Besides the aerosol optical depth, the AERONET (UNAM1999-2005) also provided the aerosol optical properties which we used in this work to define the aerosol optical models (single scattering albedo (ωo), asymmetry parameter (g) and
25
extinction efficiency (Qext)).
ACPD
7, 8113–8139, 2007Surface properties Mexico City using
MODIS A. D. de Almeida Castanho et al. Title Page Abstract Introduction Conclusions References Tables Figures ◭ ◮ ◭ ◮ Back Close
Full Screen / Esc
Printer-friendly Version
Interactive Discussion 2.1 The Microtops II sun-photometer network measurements
A network of Microtops II sun-photometers was launched in the Mexico City metropoli-tan area during the MILAGRO Campaign as part of the MCMA-2006 Study. The Mi-crotops II is a handheld sun-photometer manufactured by the Solar Light Company, Philadelphia, USA (Morys et al., 2001). The sun-photometer measures solar radiance
5
at five spectral wavelengths. The physical and operational characteristics of the instru-ment are detailed in the “User’s Guide,” which is publicly accessible on the Internet (http://www.solar.com/manuals.htm). A calibrated Microtops II estimate of τa can be
considered accurate to within ±0.03 (Ichoku et al., 2002b). The main advantage in the use of the Microtops II instrument is its easy operation, mobility, and stability of
10
the measurements. These instruments have been used previously in several field ex-periments designed to validate satellite τaretrievals (Ichoku et al., 2002a; Levy et al., 2005).
We operated 5 Microtops II instruments measuring τa in visible wavelengths at 5
locations distributed in the urbanized area. Most of the instruments started
measure-15
ments on 5 March and finished on 28 March. The characteristics, serial number, loca-tion coordinates and period of operaloca-tion of each one of the Microtops II instruments, as well as the AERONET instruments are listed in Table 1, and their locations are also shown in Fig. 1.
The sites called TEC (Tecnologico de Monterrey) in the northwest, UAM-I
(Univer-20
sidad Autonoma Metropolitana at Iztapalapa) in the southeast and UNAM in the west were located at a minimum distance of 10 km from the main supersite T0 in the urban-ized area. The site Hidalgo was chosen to characterize the main downtown conditions, and the last site called Corena represents the southwestern border of the city charac-terized by a vegetated landscape. The measurements were taken every sunny day,
25
from 09:45 a.m. until 02:45 p.m., including weekends. The interval between measure-ments was usually 15 min. However a greater time resolution of 5 min was used for ±1.5 h around the Terra and Aqua overpass times. Each Microtops measurement
ACPD
7, 8113–8139, 2007Surface properties Mexico City using
MODIS A. D. de Almeida Castanho et al. Title Page Abstract Introduction Conclusions References Tables Figures ◭ ◮ ◭ ◮ Back Close
Full Screen / Esc
Printer-friendly Version
Interactive Discussion sisted of 3 independent shots, designed to retain the data with the best alignment of
the instrument line of sight with the Sun.
The procedure used in the τacomputation was the same as the one described in
de-tail by Ichoku et al. (2002b). The τawas recalculated based on the measured voltages, and considering the Rayleigh and ozone atmospheric corrections and new calibration
5
coefficients. The calibration coefficient at a given wavelength for a particular instru-ment represents the extraterrestrial signal at that wavelength. The calibration of each instrument was done by relative calibration against the AERONET radiometer in oper-ation in Mexico City at T0, based on the calibroper-ation methodology described by Ichoku et al. (2002b). The calibrations were performed when there was no cloud cover during
10
2, 3 and 4 March, just prior to deployment and also on 25, 26 and 27 March post-deployment.
3 Quality assurance of the reflectance at the top of the atmosphere (TOA)
A cloud mask was applied on the MODIS reflectance data (Level 1B) at 500 m resolu-tion using a method similar to the procedure described by Martins et al. (2002). In this
15
process, we computed the standard deviation of the reflectance at 0.66 µm for each group of 3×3 pixels, and discarded the groups with standard deviation larger than 0.01 (which is the threshold used to identify the possibility of cloud contamination). To avoid residual contamination from cloud remnants, cloud shadows, or very bright surfaces, we also discarded pixels whose measured reflectance at 2.1 µm was smaller than 0.01
20
or larger than 0.25, as is also done in the MODIS operational algorithm (Remer et al., 2005; Levy et al., 2007). In addition, for each 3×3 set of pixels, we also discarded the darkest and the 4 brightest pixels at 0.66 µm to avoid any other possibility of influence by clouds or water bodies still remaining in the dataset. The remaining pixels were averaged to simulate the surface reflectance at 1.5 km resolution. Furthermore, the
25
parts of the MODIS images acquired with sensor zenith angles greater than 40◦ were excluded from the analyses to avoid any extra issues arising from satellite image wing
ACPD
7, 8113–8139, 2007Surface properties Mexico City using
MODIS A. D. de Almeida Castanho et al. Title Page Abstract Introduction Conclusions References Tables Figures ◭ ◮ ◭ ◮ Back Close
Full Screen / Esc
Printer-friendly Version
Interactive Discussion effects.
4 The aerosol optical model defined for Mexico City
We have defined a set of aerosol optical models that represent the heterogeneity of the aerosols over the Mexico City area. The aerosol optical properties were analyzed using AERONET measurements from 1999 to 2005. Performing a cluster analysis,
5
we identified 5 aerosol optical models based on the spectral single scattering albedo (at the four wavelengths: 1.02, 0.87, 0.67, 0.47 µm). The 5 aerosol optical models were defined by an average of the optical properties in each identified cluster. The optical properties that define an aerosol optical model are the single scattering albedo (̟o(λ)), the phase function (P(Θ,λ)) and the extinction efficiency (Qext(λ)), shown in
10
Table 2. We used a Henyey-Greenstein approximation for the phase function, defined by the asymmetry parameter (g(λ)). The 5 aerosol models were not equally distributed; most of the cases were concentrated on aerosol model 4 which makes the average of all the aerosol models closer to aerosol model 4 than to any other. In this work, we therefore chose to use aerosol model 4, hereafter called the MX (Mexico City) aerosol
15
model.
At 0.55 µm the MX aerosol model has an average single scattering albedo of 0.90±0.02 and asymmetry parameter of 0.64±0.05. Mexico City aerosols have an average ωo, which is higher than that of Sao Paulo (0.85±0.01) but lower than that of the urban pollution in Washington D.C. (0.98). The differences between the absorption
20
and scattering properties of the particles result from several factors, but the most rele-vant factor is the different black carbon concentration in each of the regions (Dubovik et al., 2002; Castanho et al., 2005; Salcedo et al., 2006). As presented in those stud-ies, black carbon represents 21% of the fine mode of the aerosol mass concentration (PM2.5) in Sao Paulo, about 3% of PM2.5 in the east coast of USA, and 11% of PM2.5
25
in Mexico City.
ACPD
7, 8113–8139, 2007Surface properties Mexico City using
MODIS A. D. de Almeida Castanho et al. Title Page Abstract Introduction Conclusions References Tables Figures ◭ ◮ ◭ ◮ Back Close
Full Screen / Esc
Printer-friendly Version
Interactive Discussion
5 Estimation of the surface reflectance
To estimate the surface reflectance (ρsurf) from satellite data, the top of the atmosphere (TOA) radiance signal has to be corrected for atmospheric gas absorption and Rayleigh scattering, and aerosol scattering and absorption (Vermote et al., 1997). This correc-tion eliminates the effects of atmospheric interaccorrec-tion with the radiacorrec-tion, leaving the
radi-5
ation that would be reflected only by the surface (Kaufman et al., 1997a). For accurate correction, it is important to know accurately the aerosol optical depth, aerosol optical properties (single scattering albedo, asymmetry parameter, and extinction efficiency), and atmospheric water vapor and other trace gas concentrations.
In this work, we used real time information on the aerosol optical depth from
ra-10
diometric measurements with the ground-based sun-photometer network. The water vapor contents were also derived from real time data measured by the AERONET in-strument at T0. Aerosol optical properties were defined using the AERONET database from 2002 until 2005. We used the tropical region climatological temperature and gas profiles from the SBDART library, corrected for the Mexico City elevation, which is
15
around 2240 m above see level. We used for each day an average of the sensor and solar geometry in the Mexico City area (less than one degree latitude and longitude). This is an approximation that does not significantly affect the optical depth estimates. The inversion equations expressing the surface reflectance as a function of the TOA reflectance were defined from simulations using the SBDART radiative transfer code
20
(Ricchiazzi et al., 1998). The equations were defined using parameters representative of the relevant conditions described above (water vapor, geometry) for each day for different τa. Once the TOA reflectance was obtained from the satellite and τawas
mea-sured by sun-photometer, the equation generated gives us the corresponding value of the surface reflectance.
25
The surface reflectance used in this work was estimated from MODIS quality-assured TOA reflectances (see Sect. 3 for quality assurance details used in this work) at 1.5 km spatial resolution and at 0.65 and 2.1 µm wavelengths. We calculated
ACPD
7, 8113–8139, 2007Surface properties Mexico City using
MODIS A. D. de Almeida Castanho et al. Title Page Abstract Introduction Conclusions References Tables Figures ◭ ◮ ◭ ◮ Back Close
Full Screen / Esc
Printer-friendly Version
Interactive Discussion face reflectances for each 1.5 km×1.5 km pixel within the 10 km box that was centered
on each sun-photometer deployed. The quantity ρsurf(0.66)/ρsurf(2.1) corresponds to the ratio of the estimated surface reflectance at 0.66 and 2.1 µm wavelengths in each pixel.
5.1 Results and discussion of the surface reflectance estimation
5
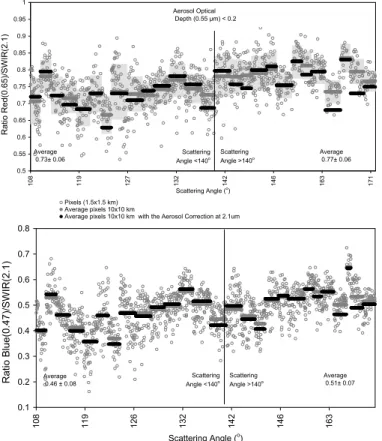
Figure 2 shows the VIS/SWIR ratios for all the days (27) in the period from 2002 to 2005 over the AERONET site at UNAM that met the following predefined conditions: days with no cloud contamination, sensor zenith angle >40◦, and days with τa from AERONET smaller than 0.2 at 0.55 µm. These conditions were intended to minimize errors from assumptions on atmospheric correction (multiple scattering by the aerosol
10
layer) and, therefore, uncertainties on the surface reflectance estimation. We also indicate the days with scattering angle >140◦to show the BRDF effect on the data.
Figure 2a shows the red ratio (ρsurf(0.66)/ρsurf(2.1)) derived over this region. This red ratio is on average 0.73±0.06 for scattering angles lower than 140◦ and increases to 0.77±0.06 on average for scattering angles higher than 140◦. The positive dependence
15
of the ratio on the scattering angle is in agreement with the dependence observed in general for different regions around the world (Levy et al, 2007). However, the surface ratio observed in Mexico City over this site is high compared to the average values (varying from 0.5 to 0.6) used in the MODIS operational algorithm for the retrieval of τa
globally (Levy et al, 2007). This difference is very significant in the retrieval of τa and
20
the effect is shown in Sect. 6.
Figure 2b shows the results for the blue ratio (ρsurf(0.47)/ρsurf(2.1)). In general, the blue ratio presented systematically higher values (0.4–0.6) compared to the global av-erage (0.25–0.3) (Levy et al., 2007). It also shows a positive dependence on the scat-tering angle and a high daily and spatial variability. The best fit for the blue scale,
25
though is the linear fit and the constant factor is not negligible. The linear fit between
ρsurf(0.47) and ρsurf(2.1) gave a slope of 0.65 and an offset of 0.025 (r2=0.6). The blue ratio plot shows more noise than the red channel as observed in previous work (Remer
ACPD
7, 8113–8139, 2007Surface properties Mexico City using
MODIS A. D. de Almeida Castanho et al. Title Page Abstract Introduction Conclusions References Tables Figures ◭ ◮ ◭ ◮ Back Close
Full Screen / Esc
Printer-friendly Version
Interactive Discussion et al., 2005, Levy et al., 2004). Levy et al., 2004 showed that neglecting the effects of
the polarization at the blue channel is a source of noise in short term analyses. Since the polarization effect is not being considered in the current analysis, the results for the blue channel are likely to contain greater uncertainly, and may not meet the level of accuracy necessary in this type of study. Therefore, the blue ratio results are presented
5
in Fig. 2b just as a reference, and will not be considered any further in the rest of this paper.
The reflectance of an aerosol layer at 2.1 µm is significant when there is a substantial coarse mode fraction in the atmosphere. To test for possible interference by the coarse mode on the ratios derived in this analysis we examined the correction of the aerosol
10
layer in the atmosphere at 2.1 µm. Using τa, we defined aerosol models based on aerosol optical properties measured by the AERONET sun-photometer in a 4-h inter-val around the satellite overpass time. The real-time measurements were used to get as close as possible to the real condition of the atmosphere. New look-up tables were generated specifically for each day to correct for the aerosol layer effect at 2.1 µm. The
15
average ratio obtained with this correction for each day is presented (as black bars) in Fig. 2, which shows that the difference between the corrected and uncorrected ratios is less than 4% for the majority of the cases. This confirms that the ρsurf(0.66)/ρsurf (2.1) ratio deduced for Mexico City is not an artifact of any atmospheric aerosol effect on the estimated surface reflectance. However, there is a significant variability in the
20
ratio from one day to another. These variations can be related to different observation geometries: sun/sensor view zenith and azimuth angles. The urban surfaces are gen-erally non-Lambertian (Meister, 2000). While some targets show forward-scattering behavior, others show stronger backscattering behavior. When such characteristics are added to the spectral dependence and the composition of different surface types
25
within a 10-km spatial average, the resultant effect can contribute to the high variability observed in the ratio. The differences can also be related to variations in soil humid-ity, shadows, and aerosol optical model assumptions that would need to be analyzed further.
ACPD
7, 8113–8139, 2007Surface properties Mexico City using
MODIS A. D. de Almeida Castanho et al. Title Page Abstract Introduction Conclusions References Tables Figures ◭ ◮ ◭ ◮ Back Close
Full Screen / Esc
Printer-friendly Version
Interactive Discussion The open circles in Fig. 2 represent the estimates for each pixel (1.5 km spatial
res-olution) in a 10-km box, for each day. Note that even within a single 10-km box there is a high variability of the ratios due to the diversity of the surface cover in each area.
A detailed analysis of the surface spectral reflectance over urban areas requires a high spatial resolution due to the heterogeneity of its surface cover. The
Na-5
tional Consortium on Remote Sensing in Transportation (NCRST) from the Univer-sity of California, Santa Barbara (http://www.ncgia.ucsb.edu/ncrst/resources/easyread/
HyperCenterlines/first.html), using the Airborne Visible InfraRed Imaging Spectrometer (AVIRIS) data, performed a detailed classification of the surface reflectance over Santa Barbara and Goleta urban area and identified distinct surface types. Further analysis
10
was also performed by Herald et al. (2003) using AVIRIS data for 2000. The surface re-flectance of several surface types were derived by taking advantage of the AVIRIS high spatial resolution (4 m) and 224 continuous spectral bands (0.40 to 2.50 µm). The an-alyzed surfaces include several vegetation types, soil and urban materials (asphalted or concreted roads, parking lots, roofs). The authors distinctively selected only
homo-15
geneous scenes in their analyses in order to characterize the specific targets since the 4 m resolution can still have a mix of different surface materials or shadows. Us-ing their spectral data library categorized by different surface types, we computed the
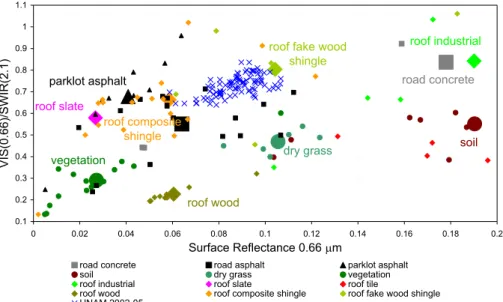
ρsurf(0.66 µm)/ρsurf(2.1 µm) ratio and plotted it against the ρsurf(0.66 µm) as illustrated in Fig. 3.
20
Results of the analysis from the Mexico City AERONET site at UNAM for the period of 2002–2005 are also plotted in Fig. 3. Each point represents a pixel of 1.5 km×1.5 km spatial resolution from a 10 km box centered on the AERONET site and averaged over 6 and 8 days (Aqua and Terra respectively), with τa<0.2 and scattering angle <140◦.
Overall, Figure 3 shows a positive dependence of the ρsurf(0.66 µm)/ρsurf(2.1 µm) ratio
25
on the absolute surface reflectance at 0.66 µm. From the natural surface data it is clear that going from green vegetated surfaces to non-photosynthetic vegetation like dry grass, and through to soils, there is an increase in the red reflectance and at the same time an increase in the reflectance ratio ranging on average from 0.3 to 0.5. The
ACPD
7, 8113–8139, 2007Surface properties Mexico City using
MODIS A. D. de Almeida Castanho et al. Title Page Abstract Introduction Conclusions References Tables Figures ◭ ◮ ◭ ◮ Back Close
Full Screen / Esc
Printer-friendly Version
Interactive Discussion reflectivity in the visible blue and red wavelengths is lower for vegetated surfaces due to
chlorophyll absorption. The shortwave infrared radiation is absorbed due to vibrational absorptions by liquid water and leaf components such as lignin and cellulose (Roberts et al., 1993; Kaufman et al., 2002). Dryer and less photosynthetically active vegetation contribute to increase in the brightness at 0.66 µm and 2.1 µm. This signal is stronger
5
for 0.66 µm causing an increase in the ratio ρsurf(0.66 µm)/ρsurf (2.1 µm) as shown in Fig. 3.
Regarding the urban scenes, the roads and most of the roofs, even for low red re-flectance, show systematically higher reflectance ratios of around 0.7. Our results for Mexico City at 1.5 km×1.5 km resolution in the area surrounding the UNAM site
10
show ρsurf(0.66 µm)/ρsurf (2.1 µm) ratios that vary from 0.60 up to 0.80 and surface reflectances at 0.66 µm varying from 0.06 up to 0.11. This high variability reflects the heterogeneity of the surface cover in the 10-km box. In this area, there is a diversity of building rooftops, vegetated areas, and roads. The results from this work for each 1.5 km×1.5 km pixel already represent a mix of different surface types and on average
15
appear to be reasonably well explained by the reflectances of individual materials in the urban area. In particular, the urban mix of surface covers (asphalt, roof fake-wood shingle, concrete, . . . ) shows reflectance ratios that are higher than the natural land covers (vegetation, dry grass, soil, . . . ).
Figure 4a repeats Fig. 3 but includes results from the sun-photometer network
oper-20
ated during the MILAGRO experiment. Figure 4b qualitatively shows the clustering of the different surface types as urbanized, semi arid and vegetated areas. Applying the same procedures as before, we considered only the cases where τa<0.2, but included all the cases independent of their scattering angles, to increase the statistics. The correction for the aerosol layer was applied using the τa measured from all the
sun-25
photometers in the network in the corresponding areas with one aerosol model used for the whole region. Each point corresponds to a pixel of 1.5 km spatial resolution over an area of 10 km x 10 km centered on each of the sun-photometer sites.
It is important to note that surface properties obtained at the UNAM2006 site with the 8126
ACPD
7, 8113–8139, 2007Surface properties Mexico City using
MODIS A. D. de Almeida Castanho et al. Title Page Abstract Introduction Conclusions References Tables Figures ◭ ◮ ◭ ◮ Back Close
Full Screen / Esc
Printer-friendly Version
Interactive Discussion Microtops II, reconfirm those obtained with AERONET at the same site during 2002–
2005, showing the consistency of the data. Like UNAM, the UAM-I, T0, and TEC sites represent urbanized areas with a high heterogeneity of surface cover. Overall, the ur-banized sites show an average ρsurf(0.66)/ρsurf(2.1) value close to 0.73, in agreement with the value retrieved from the 2002–2005 data. The results from the different
ur-5
banized areas are somewhat different from each other, but detailed analyses of each region would be necessary to explain the differences seen in Fig. 4.
The Corena site is located at the southwest of UNAM in a vegetated park area; part of the 10 km×10 km box includes urban areas as well as some part of the UNAM area. The Corena results in Fig. 4 are in good agreement with expectations from its mix of
10
urban and vegetation characteristics, (i.e., the pixels that show lower reflectance ra-tios and lower surface reflectance at 0.66 µm are in agreement with vegetated surface characteristics).
The T1 site is another representative site, which is located 30 km northeast of Mex-ico City in a very arid area consisting of dry grass and exposed soil. The T1 results
15
presented in Fig. 4 show good agreement with the surface composition of the area (i.e., values range between the dry grass and soil types with lower ratios and higher surface reflectance at 0.66 µm).
The surface ratios estimated from the sun-photometer measurements during MCMA-2006 Study presented different surface properties that were in agreement with the
20
reference library of surface types in an urban area.
6 Aerosol optical depth computation
We obtained aerosol optical depth (τa) retrievals at 1.5 km resolution based on MODIS Level 1B calibrated TOA reflectance at 0.66 and 2.1 µm. The TOA reflectance at 2.1 µm was used to estimate the surface reflectance at 0.66 µm (Kaufman et al., 1997a) based
25
on the ρsurf(0.66)/ρsurf(2.1) ratio estimated for the Mexico City urban area in this work. The aerosol optical model used was determined specifically for Mexico City as
ACPD
7, 8113–8139, 2007Surface properties Mexico City using
MODIS A. D. de Almeida Castanho et al. Title Page Abstract Introduction Conclusions References Tables Figures ◭ ◮ ◭ ◮ Back Close
Full Screen / Esc
Printer-friendly Version
Interactive Discussion scribed in Sect. 4. The retrieval is based on a lookup equation that relates the TOA
reflectance (at 0.66 µm) to an aerosol optical depth (at 0.55 µm), for a given surface re-flectance, aerosol optical model, and satellite and solar geometries. The look up equa-tions were defined based on simulaequa-tions of the TOA reflectance at for several aerosol optical depths using SBDART under the relevant conditions (surface reflectance,
ge-5
ometry, water vapor amount).
Even with the observed variability between the different regions, and from one day to another, when averaged over 10 km×10 km the ρsurf(0.66)/ρsurf (2.1) reflectance ratio is around 0.73 for scattering angles smaller that 140◦. The use of this new “urban” ratio, compared to a mean 0.56 ratio used for MODIS operational retrieval globally,
10
can make a large difference in the τa computation from satellite observations. Fig-ure 5 presents the comparison between the computed τa retrieved in this study with
MODIS data and the measured τa from AERONET in 2002–2005 and the hand-held sun-photometer network during MCMA- 2006 Study. The ratio was defined based on the 2002–2005 data, but the results shown here are meant to demonstrate the effect
15
that it can produce in the τa estimation for the same period, and just confirmed for the independent period of 2006. In Fig. 5a the τa was retrieved using the surface re-flectance ratio of ρsurf(0.66 µm)/ρsurf (2.1 µm) = 0.56 and in Fig. 5b the retrieval was based on ρsurf(0.66 µm)/ρsurf(2.1 µm) = 0.73. The comparison between the two plots shows a great improvement in Fig. 5b of the offset in Fig. 5a that was caused by
in-20
accurate information on surface reflectance. It should be pointed out that the use of a mean aerosol optical model defined from AERONET data in this study was sufficient to represent the aerosol content in all analyses. This is verified by the precise slope of the fit being close to unity.
7 Conclusions
25
Based on the analysis of satellite and ground-based measurements in different urban sites in Mexico City, it can be deduced that even with the high heterogeneity of the
ACPD
7, 8113–8139, 2007Surface properties Mexico City using
MODIS A. D. de Almeida Castanho et al. Title Page Abstract Introduction Conclusions References Tables Figures ◭ ◮ ◭ ◮ Back Close
Full Screen / Esc
Printer-friendly Version
Interactive Discussion surface, the average ratio of ρsurf(0.66)/ρsurf (2.1)=0.73 in a 10 km×10 km area is
rep-resentative of the urbanized surfaces. This was significantly different for a non-urban site T1, whose value of around 0.55 was in agreement with the expected value for the surface materials of dry grass and soil that characterize the site. Comparison be-tween the 10 km×10 km τa averages (retrieved from MODIS at 1.5 km resolution) and
5
1-h averages from the sun-photometers observed for each of the measurement sites shows a significant improvement in the τa estimation for the 2006 independent data set, when using the new surface ratio (0.73). This result shows that for τa retrieval at
10 km×10 km spatial resolution the surface ratio assumption (0.73) is good for the an-alyzed urban area. However, at higher spatial resolutions such as 1.5 km, τa retrieval
10
would need to consider a flexible ρsurf(0.66)/ρsurf(2.1) ratio for each single pixel, as we found a high variability of the ρsurf(0.66)/ρsurf (2.1) (0.60–0.80) at 1.5 km. This variabil-ity of the ratio at 1.5 km resolution is significant enough to increase the uncertainties in the τa values retrieved from satellite at the higher spatial resolution. Therefore, a surface ratio function would need to be defined to represent the large heterogeneity of
15
an urban area if τa is to be derived from MODIS at 1.5 km resolution.
Acknowledgements. This work was supported by a Molina Fellowship in Environmental
Sci-ence (to A. D. de A. Castanho) and Department of Energy grant DE-FG02-0563980. We are very grateful for the immensurable helpful participation of the following students that worked on this project operating the MicrotopsII supported by the INE (Instituto Nacional de
Ecolo-20
gia): F. Ramirez Hernandez, I. Vega del Valle, P. A. Hernandez Priego, G. V. Valdes, A. Ar-raiga and L. D. Reyes Cortes. We also acknowledge the AERONET site managers at Mexico City A. Leyva, Technician H ´ector R. Est ´evez from the Institute of Geophysics at UNAM and AERONET global PI Brent Holben, for making available an extensive and high quality data. We also thank G. Sosa for logistical support at the IMP – T0. We acknowledge L. Remer and
25
R. Levy for the valuable discussion.
ACPD
7, 8113–8139, 2007Surface properties Mexico City using
MODIS A. D. de Almeida Castanho et al. Title Page Abstract Introduction Conclusions References Tables Figures ◭ ◮ ◭ ◮ Back Close
Full Screen / Esc
Printer-friendly Version
Interactive Discussion
References
Al-Saadi, J., Szykman, J., Pierce, R. B., et al.: Improving national air quality forecasts with satellite aerosol observations, Bull. Am. Meteorol. Soc., 86(9), 1249–1264, 2005.
Castanho, A. D. A., Martins, J. V., Hobbs, P. V., Artaxo, P., Remer, L., and Yamasoe, M. A.: Chemical characterization of aerosols on the East Coast of the United States using aircraft
5
and ground based stations during the CLAMS Experiment, J. Atmos. Sci., 62, 934–946, 2005.
Li, C., Lau, A. K. H, Mao, J., and Chu, A.: Retrieval, Validation, and Application of the 1-km Aerosol Optical Depth From MODIS Measurements Over Hong Kong, IEEE Trans. Geosci. Remote Sens, 43(11), 2650–2658, 2005.
10
Dubovik, O. and King, M. D.: A flexible inversion algorithm for retrieval of aerosol optical proper-ties from sun and sky radiance measurements, J. Geophys. Res., 105(D16), 20 673–20 696, 2000.
Dubovik, O., Holben, B., Eck, T. F., Smirnov, A., Kaufman, Y. J., King, M. D., Tanr ´e, D., and Slutsker, I.: Variability of absorption and optical properties of key aerosol types observed in
15
worldwide locations, J. Atmos. Sci., 59, 590–608, 2002.
Gatebe, C. K., King, M. D., Tsay, S., Ji, Q., Arnold, G. T., and Li, J. Y.: Sensitivity of off-nadir zenith angles to correlation between visible and near-infrared reflectance for use in remote sensing of aerosol over land, IEEE Trans. Geosci. Remote Sens. 39(4), 805–819, 2001. Gross, B., Ogunwuyi, O., Moshary, F., Ahmed, S.; Cairns, B.: MODIS aerosol retrieval over
20
urban areas, Atmospheric and Environmental Remote Sensing Data Processing and Utiliza-tion: Numerical Atmospheric Prediction and Environmental Monitoring, edited by: Huang, Hung-Lung A., Bloom, Hal J., Xu, Xiaofeng, and Dittberner, G. J., Proceedings of the SPIE, 5890, 274–283, 2005.
Guenther, B., Xiong, X., Salomonson, V. V., Barnes, W. L., and Young, J.: On-orbit performance
25
of the Earth Observing System Moderate Resolution Imaging Spectroradiometer: First year of data, Remote Sens. Environ., 83, 16–30, 2002.
Herold, M., Gardner, M., and Roberts, D. A.: Spectral Resolution Requirements for Mapping Urban Areas, IEEE Transactions on Geoscience and Remote Sensing, 41(9), 1907–1919, 2003.
30
Holben, B. N., Tanre’, D., and Smirnov, A.: An emerging ground-based aerosol climatology: Aerosol Optical depth from AERONET, Journal of Geophysical Research, 106(D11), 12 067–
ACPD
7, 8113–8139, 2007Surface properties Mexico City using
MODIS A. D. de Almeida Castanho et al. Title Page Abstract Introduction Conclusions References Tables Figures ◭ ◮ ◭ ◮ Back Close
Full Screen / Esc
Printer-friendly Version
Interactive Discussion
12 097, 2001.
Ichoku, C., Chu, D. A., Mattoo, S., Kaufman, Y. J., Remer, L. A., Tanr ´e, D., Slutsker, I., and Hol-ben, B. N.: A spatiotemporal approach for global validation and analysis of MODIS aerosol products, Geophys. Res. Lett., 29, 8006, doi:10.1029/2001GL013206, 2002a.
Ichoku, C., Levy, R., Kaufman, Y. J., et al.: Analysis of the performance characteristics of
5
the five-channel Microtops II sun-photometer for measuring aerosol optical thickness and precipitable water vapor, J. Geophys. Res., 107, 4179, doi:10.1029/2001JD001302, 2002b. Kaufman, Y. J., Tanr ´e, D., Gordon, H. R., et al.: Passive remote sensing of tropospheric aerosol
and atmospheric correction for the aerosol effect, J. Geophys. Res., 102(D14), 16 815– 16 830, 1997a.
10
Kaufman, Y. J., Tanr ´e, D., Remer, L. A., Vermote, E. F., Chu, A., and Holben, B.: Operational remote sensing of tropospheric aerosol over land from EOS moderate resolution imaging spectroradiometer, J. Geophys. Res., 102, 17 051–17 067, 1997b.
Kaufman, Y. J., Gobron, N., Pinty, B., Widlowski, J., and Verstraete, M. M.: Relationship be-tween surface reflectance in the visible and mid-IR used in MODIS aerosol algorithm –
the-15
ory, J. Geophys. Res., 29(23), 2116, doi:10.1029/2001GL014492, 2002.
King, M. D., Menzel, W. P., Kaufman, Y.J., Tanr ´e, D., Gao, B. C., Platnick, S., Ackerman, S. A., Remer, L. A., Pincus, R., and Hubanks, P. A.: Cloud and aerosol properties, precipitable water, and profiles of temperature and water vapor from MODIS, IEEE Trans Geosci. Remote Sens., 41(2), 442–458, 2003.
20
Levy, R. C., Remer, L. A., Martins, J. V., and Kaufman, Y. J.: Evaluation of the MODIS aerosol retrievals over ocean and land during CLAMS experiment, J. Atmos. Sci.-Special Section, 62, 974–992, 2005.
Levy, R. C., Remer, L. A., Matto, S., Vermote, E. F., and Kaufman, Y. J.: A new algorithm for retrieving aerosol properties over land from MODIS spectral reflectance, J. Geophys. Res.,
25
in press, 2007.
Martins, J. V., Tanr ´e, D., Remer, L. A., Kaufman, Y., Mattoo, S., Levy, R.: MODIS cloud screen-ing for remote sensscreen-ing of aerosols over ocean usscreen-ing spatial variability, Geophys. Res. Lett., 29(12), doi:10.1029/2001GL013252, 2002.
Meister, G.: Bidirectional Reflectance of Urban Surfaces, PhD thesis, University of
Ham-30
burg,II, Institut f ¨ur Experimentalphysik, 186, URL:http://kogs-www.informatik.uni-Hamburg.
de/PROJECTS/censis/publications.html, 2000.
Morys M., Mims III, F. M., Hagerup, S., Anderson, S. E., Baker, A., Kia, J., and Walkup, T.:
ACPD
7, 8113–8139, 2007Surface properties Mexico City using
MODIS A. D. de Almeida Castanho et al. Title Page Abstract Introduction Conclusions References Tables Figures ◭ ◮ ◭ ◮ Back Close
Full Screen / Esc
Printer-friendly Version
Interactive Discussion
Design, calibration, and performance of MICROTOPS II handheld ozone monitor and sun-photometer, J. Geophys. Res., 106, 14 573–14 582, 2001.
Parkinson, C.L.: Aqua: An Earth-Observing Satellite Mission to Examine Water and Other Climate Variables, IEEE Transactions on Geoscience and Remote Sensing, 41(2), 173–183, 2003.
5
Remer, L. A., Wald, A. E., and Kaufman, Y.: Angular and seasonal variation of spectral surface reflectance ratios: Implications for the remote sensing of aerosol over land, IEEE Trans. Geosci. Remote Sens., 39(2), 275–283, 2001.
Remer, L.A., Kaufman, Y. J. , Tanre, D., et al.: The MODIS Aerosol Algorithm, products, and validation, Journal of the Atmospheric Sciences-Special Edition, 62, 947–973, 2005.
10
Ricchiazzi, P., Yang, S., Gautier, C., and Sowle, D.: SBDART: A Research and Teaching Soft-ware Tool for Plane-Parallel Radiative Transfer in the earth’s Atmosphere, Bull. Am. Meteorol. Soc., 79, 2101–2114, 1998.
Roberts, D. A., Smith, M. O., and Adams, J. B.: Green Vegetation, Nonphotosynthetic Vegeta-tion, and soils in AVIRIS Data, Remote Sensing Environ., 44(2–3), 255–269, 1993.
15
Salcedo, D., Onasch, T. B., Dzepina, K., et al.: Characterization of ambient aerosols in Mexico City during the MCMA-2003 campaign with Aerosol Mass Spectrometry: results from the CENICA Supersite, Atmos. Chem. Phys., 6, 925–946, 2006,
http://www.atmos-chem-phys.net/6/925/2006/.
Vermote, E. F., Tanr ´e, D, Deuze, J. L., et al.: Second Simulation of the Satellite Signal in
20
the Solar Spectrum, 6S: An overview, IEEE Trans. Geosci. Remote Sens., 35(3), 675–686, 1997.
ACPD
7, 8113–8139, 2007Surface properties Mexico City using
MODIS A. D. de Almeida Castanho et al. Title Page Abstract Introduction Conclusions References Tables Figures ◭ ◮ ◭ ◮ Back Close
Full Screen / Esc
Printer-friendly Version
Interactive Discussion
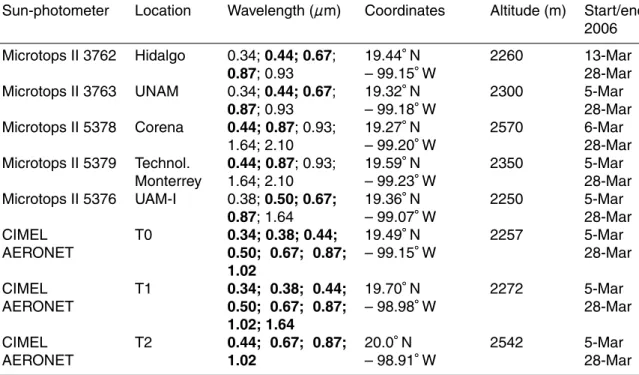
Table 1. Characteristics of the sun-photometer instruments used in the 2006 MILAGRO cam-paign in Mexico City. Only the wavelengths in bold on the Microtops II instruments were cali-brated.
Sun-photometer Location Wavelength (µm) Coordinates Altitude (m) Start/end
2006 Microtops II 3762 Hidalgo 0.34; 0.44; 0.67; 0.87; 0.93 19.44◦N – 99.15◦W 2260 13-Mar 28-Mar Microtops II 3763 UNAM 0.34; 0.44; 0.67; 0.87; 0.93 19.32◦N – 99.18◦W 2300 5-Mar 28-Mar Microtops II 5378 Corena 0.44; 0.87; 0.93; 1.64; 2.10 19.27◦N – 99.20◦W 2570 6-Mar 28-Mar Microtops II 5379 Technol. Monterrey 0.44; 0.87; 0.93; 1.64; 2.10 19.59◦N – 99.23◦W 2350 5-Mar 28-Mar Microtops II 5376 UAM-I 0.38; 0.50; 0.67; 0.87; 1.64 19.36◦N – 99.07◦W 2250 5-Mar 28-Mar CIMEL AERONET T0 0.34; 0.38; 0.44; 0.50; 0.67; 0.87; 1.02 19.49◦N – 99.15◦W 2257 5-Mar 28-Mar CIMEL AERONET T1 0.34; 0.38; 0.44; 0.50; 0.67; 0.87; 1.02; 1.64 19.70◦N – 98.98◦W 2272 5-Mar 28-Mar CIMEL AERONET T2 0.44; 0.67; 0.87; 1.02 20.0◦N – 98.91◦W 2542 5-Mar 28-Mar 8133
ACPD
7, 8113–8139, 2007Surface properties Mexico City using
MODIS A. D. de Almeida Castanho et al. Title Page Abstract Introduction Conclusions References Tables Figures ◭ ◮ ◭ ◮ Back Close
Full Screen / Esc
Printer-friendly Version
Interactive Discussion
Table 2. Spectral optical properties (Single Scattering Albedo (̟o); Asymmetry Parameter
(g); Extinction Coefficient (Qext)) of the 5 aerosol optical models derived from the AERONET
database (UNAM 1999–2005). Aerosol model number four used in this work is shown shaded.
ϖ # (μm) 0.44 0.55 0.67 0.87 1.02 ϖo( ) 0.77 ± 0.06 0.74 ± 0.05 0.72 ± 0.05 0.65 ± 0.06 0.62 ± 0.06 g( ) 0.66 ± 0.05 0.62 ± 0.05 0.59 ± 0.05 0.58 ± 0.05 0.58 ± 0.05 Aerosol Model 1 (315) Qext( ) 1.6 ± 0.1 1.00 0.77 ± 0.04 0.58 ± 0.08 0.5 ± 0.1 ϖo( ) 0.84 ± 0.03 0.82 ± 0.02 0.81 ± 0.02 0.76 ± 0.02 0.74 ± 0.03 g( ) 0.66 ± 0.04 0.63 ± 0.04 0.60 ± 0.04 0.58 ± 0.04 0.58 ± 0.05 Aerosol Model 2 (563) Qext( ) 1.6 ± 0.1 1.00 0.77 ± 0.03 0.56 ± 0.07 0.48 ± 0.09 ϖo( ) 0.87 ± 0.02 0.86 ± 0.02 0.85 ± 0.02 0.82 ± 0.02 0.81 ± 0.03 g( ) 0.66 ± 0.04 0.63 ± 0.04 0.60 ± 0.04 0.57 ± 0.04 0.57 ± 0.05 Aerosol Model 3 (658) Qext( ) 1.6 ± 0.1 1.00 0.77 ± 0.03 0.54 ± 0.08 0.5 ± 0.1 ϖo( ) 0.91 ± 0.02 0.90 ± 0.02 0.90 ± 0.02 0.88 ± 0.03 0.87 ± 0.03 g( ) 0.67 ± 0.05 0.64 ± 0.05 0.61 ± 0.05 0.58 ± 0.05 0.57 ± 0.05 Aerosol Model 4 (1142) Qext( ) 1.5 ± 0.1 1.00 0.77 ± 0.04 0.53 ± 0.08 0.4 ± 0.1 ϖo( ) 0.98 ± 0.01 0.98 ± 0.02 0.98 ± 0.02 0.97 ± 0.02 0.97 ± 0.02 g( ) 0.68 ± 0.06 0.65 ± 0.05 0.62 ± 0.06 0.59 ± 0.06 0.58 ± 0.06 Aerosol Model 5 (607) Qext( ) 1.6 ± 0.2 1.00 0.74 ± 0.06 0.5 ± 0.1 0.4 ± 0.1 5 8134
ACPD
7, 8113–8139, 2007Surface properties Mexico City using
MODIS A. D. de Almeida Castanho et al. Title Page Abstract Introduction Conclusions References Tables Figures ◭ ◮ ◭ ◮ Back Close
Full Screen / Esc
Printer-friendly Version Interactive Discussion T0 T1 T2 2 4 5 1 3 Latitude Longitude −99.6 −99.4 −99.2 −99 −98.8 −98.6 −98.4 19 19.2 19.4 19.6 19.8 20
Fig. 1. Map indicating: (∗) the MILAGRO 2006 super sites T0, T1 and T2; (✷) the sun-photometer network, where (1) Tec, (2) Hidalgo, (3) UAM-I, (4) UNAM and (5) Corena; (+) AERONET site location at UNAM during 2002–2005.
ACPD
7, 8113–8139, 2007Surface properties Mexico City using
MODIS A. D. de Almeida Castanho et al. Title Page Abstract Introduction Conclusions References Tables Figures ◭ ◮ ◭ ◮ Back Close
Full Screen / Esc
Printer-friendly Version Interactive Discussion 0.5 0.55 0.6 0.65 0.7 0.75 0.8 0.85 0.9 0.95 1 1 0 8 1 1 9 1 2 7 1 3 2 1 4 2 1 4 6 1 6 3 1 7 1 Scattering Angle (o ) R a ti o R e d (0 .6 5 )/ SW IR (2 .1 ) Pixels (1.5x1.5 km) Average pixels 10x10 km
Average pixels 10x10 km with the Aerosol Correction at 2.1um Scattering Angle <140o Scattering Angle >140o Aerosol Optical Depth (0.55 ȝm) < 0.2 Average 0.73± 0.06 Average 0.77± 0.06 0.1 0.2 0.3 0.4 0.5 0.6 0.7 0.8 1 0 8 1 1 9 1 2 6 1 3 2 1 4 2 1 4 6 1 6 3 Scattering Angle (o) R a ti o Bl u e (0 .4 7 )/ SW IR (2 .1 ) Average 0.46 ± 0.08 Scattering Angle <140o Scattering Angle >140o Average 0.51± 0.07
Fig. 2. Ratio between surface reflectivities at: (a) 0.66 and 2.1 µm and (b) 0.47 and 2.1 µm, for τasmaller than 0.2, as a function of scattering angle. Open circles represent the individual
ratio for each pixel (1.5 km×1.5 km) within a 10 km box around the AERONET site at UNAM (2002–2005). The average and standard deviation for each day (within the 10-km box) are represented by grey circles and bars respectively. Black bars represent the averages for each day (within the 10 km box) of the surface ratio estimation for correcting the aerosol effect at
ACPD
7, 8113–8139, 2007Surface properties Mexico City using
MODIS A. D. de Almeida Castanho et al. Title Page Abstract Introduction Conclusions References Tables Figures ◭ ◮ ◭ ◮ Back Close
Full Screen / Esc
Printer-friendly Version Interactive Discussion road concrete parklot asphalt soil dry grass vegetation roof industrial roof slate roof wood roof composite shingle
roof fake wood shingle 0.1 0.2 0.3 0.4 0.5 0.6 0.7 0.8 0.9 1 1.1 0 0.02 0.04 0.06 0.08 0.1 0.12 0.14 0.16 0.18 0.2 Surface Reflectance 0.66 Pm VI S(0 .6 6 )/ SW IR (2 .1 )
road concrete road asphalt parklot asphalt
soil dry grass vegetation
roof industrial roof slate roof tile
roof wood roof composite shingle roof fake wood shingle UNAM 2002-05
Fig. 3. The ratio between the VIS(0.66 µm)/SWIR(2.1 µm) is presented as a function of the surface reflectance at 0.66 µm, based on the Herald et al. (2003) spectral library. Results from our MODIS analyses are also presented for data analyzed between 2002 and 2005 at 1.5 km resolution over a 10 km box centered on the AERONET site at UNAM in Mexico City.
ACPD
7, 8113–8139, 2007Surface properties Mexico City using
MODIS A. D. de Almeida Castanho et al. Title Page Abstract Introduction Conclusions References Tables Figures ◭ ◮ ◭ ◮ Back Close
Full Screen / Esc
Printer-friendly Version Interactive Discussion roof wood road concrete parklot asphalt soil dry grass vegetation roof industrial roof slate
roof composite shingle
roof fake wood shingle
0.1 0.2 0.3 0.4 0.5 0.6 0.7 0.8 0.9 1 0 0.02 0.04 0.06 0.08 0.1 0.12 0.14 0.16 0.18 0.2 Surface Reflectance at 0.66 Pm VI S(0 .6 6 )/ SW IR (2 .1 )
UNAM 2002-05 Corena T0 T1 UNAM UAM-I Tech Monterrey road asphalt roof wood road concrete parklot asphalt soil dry grass vegetation roof industrial roof slate
roof composite shingle
roof fake wood shingle
0.1 0.2 0.3 0.4 0.5 0.6 0.7 0.8 0.9 1 0 0.02 0.04 0.06 0.08 0.1 0.12 0.14 0.16 0.18 0.2 Surface Reflectance at 0.66 Pm VI S(0 .6 6 )/ SW IR (2 .1 ) Corena green vegetation + urban UNAM T0 Tech Monterrey UAM-I T1 semi arid road asphalt Urban areas UNAM 2002-05
Fig. 4. (a) Same as Fig. 3 but including results from our MODIS analyses at 1.5 km×1.5 km in a 10 km×10 km box centered on each sun-photometer that operated during the MILAGRO Campaign in Mexico City in 2006; (b) Qualitatively illustrated clusters of the results from each measurement site.
ACPD
7, 8113–8139, 2007Surface properties Mexico City using
MODIS A. D. de Almeida Castanho et al. Title Page Abstract Introduction Conclusions References Tables Figures ◭ ◮ ◭ ◮ Back Close
Full Screen / Esc
Printer-friendly Version Interactive Discussion Ratio RED/SWIR = 0.56 -0.2 0 0.2 0.4 0.6 0.8 1 1.2 1.4 0 0.2 0.4 0.6 0.8 1 1.2 1.4 AOD(0.55μm) sun-photometer A O D (0 .5 5 μ m ) MO D IS a v e ra g e d 1 0 x 1 0 k m 1 (a) τa MODIS = 0.91 τa sun-photometer + 0.33 , R2=0.66 Ratio RED/SWIR = 0.73 -0.2 0 0.2 0.4 0.6 0.8 1 1.2 1.4 0 0.2 0.4 0.6 0.8 1 1.2 1.4 AOD(0.55μm) sun-photometer A O D (0 .5 5 μ m ) MO D IS a v e ra g e d 1 0 x 1 0 k m (b) τa MODIS = 0.96 τa sun-photometer - 0.006, R2=0.87
Figure 5: Aerosol optical depth (τa) retrieved from MODIS reflectance data in this study
τ
ρ ρ
Fig. 5. Aerosol optical depth (τa) retrieved from MODIS reflectance data in this study at
1.5 km×1.5 km resolution and averaged over 10 km×10 km around the sun-photometer site,
compared to τameasured with the sun-photometers averaged over one hour around the
satel-lite overpass time, for ρsurf(0.66 µm)/ρsurf (2.1 µm) values of (a) 0.56 and (b) 0.73. Squares represent data from 2002–2005 from the AERONET at UNAM, and open circles represent data from the sun-photometer network that operated during the MILAGRO Campaign in 2006. The error bars represent their respective standard deviations.