HAL Id: hal-00299115
https://hal.archives-ouvertes.fr/hal-00299115
Submitted on 16 Apr 2004
HAL is a multi-disciplinary open access
archive for the deposit and dissemination of
sci-entific research documents, whether they are
pub-lished or not. The documents may come from
teaching and research institutions in France or
abroad, or from public or private research centers.
L’archive ouverte pluridisciplinaire HAL, est
destinée au dépôt et à la diffusion de documents
scientifiques de niveau recherche, publiés ou non,
émanant des établissements d’enseignement et de
recherche français ou étrangers, des laboratoires
publics ou privés.
Simulation of earthquake caused building damages for
the development of fast reconnaissance techniques
C. Schweier, M. Markus, E. Steinle
To cite this version:
C. Schweier, M. Markus, E. Steinle. Simulation of earthquake caused building damages for the
de-velopment of fast reconnaissance techniques. Natural Hazards and Earth System Science, Copernicus
Publications on behalf of the European Geosciences Union, 2004, 4 (2), pp.285-293. �hal-00299115�
SRef-ID: 1684-9981/nhess/2004-4-285
© European Geosciences Union 2004
and Earth
System Sciences
Simulation of earthquake caused building damages for the
development of fast reconnaissance techniques
C. Schweier1, M. Markus1, and E. Steinle2
1Institute for Technology and Management in Construction, University of Karlsruhe (TH), Germany 2Institute for Photogrammetry and Remote Sensing, University of Karlsruhe (TH), Germany
Received: 30 September 2003 – Revised: 5 January 2004 – Accepted: 7 January 2004 – Published: 16 April 2004 Part of Special Issue “Multidisciplinary approaches in natural hazards”
Abstract. Catastrophic events like strong earthquakes can
cause big losses in life and economic values. An increase in the efficiency of reconnaissance techniques could help to reduce the losses in life as many victims die after and not during the event. A basic prerequisite to improve the rescue teams’ work is an improved planning of the measures. This can only be done on the basis of reliable and detailed infor-mation about the actual situation in the affected regions.
Therefore, a bundle of projects at Karlsruhe university aim at the development of a tool for fast information retrieval af-ter strong earthquakes. The focus is on urban areas as the most losses occur there. In this paper the approach for a damage analysis of buildings will be presented. It consists of an automatic methodology to model buildings in three di-mensions, a comparison of pre- and post-event models to de-tect changes and a subsequent classification of the changes into damage types. The process is based on information ex-traction from airborne laserscanning data, i.e. digital surface models (DSM) acquired through scanning of an area with pulsed laser light.
To date, there are no laserscanning derived DSMs avail-able to the authors that were taken of areas that suffered dam-ages from earthquakes. Therefore, it was necessary to sim-ulate such data for the development of the damage detection methodology. In this paper two different methodologies used for simulating the data will be presented.
The first method is to create CAD models of undamaged buildings based on their construction plans and alter them artificially in such a way as if they had suffered serious dam-age. Then, a laserscanning data set is simulated based on these models which can be compared with real laserscanning data acquired of the buildings (in intact state).
The other approach is to use measurements of actual dam-aged buildings and simulate their intact state. It is possible to model the geometrical structure of these damaged build-ings based on digital photography taken after the event by
Correspondence to: C. Schweier
(schweier@tmb.uni-karlsruhe.de)
evaluating the images with photogrammetrical methods. The intact state of the buildings is simulated based on on-site in-vestigations, and finally laserscanning data are simulated for both states.
1 Introduction
Every year strong earthquakes cause thousands of casualties. Often survivors are located in collapsed buildings, who could be rescued by fast and efficient measures. But in the after-math of an earthquake the situation is chaotic, the number and location of collapsed buildings and of blocked streets are unknown, and it is often not clear how many people are affected (compare Comfort, 2000). Information is mostly available only many hours up to days after the event, and as they originate from different sources, their reliability is uncertain. However, this information is necessary for disas-ter management tasks, like e.g. the allocation of the limited search and rescue (SAR) resources of the disaster area in an optimal way. In addition, this information should be avail-able as fast as possible to increase the survival probability of the persons trapped in collapsed buildings.
Research in the field of disaster management benefits from the collaboration of different disciplines. In this spirit, the Collaborative Research Center 461 (CRC 461) “Strong Earthquakes: A Challenge for Geosciences and Civil Engi-neering” at Karlsruhe University was founded in 1996. This long-term research project is a multidisciplinary attempt at earthquake damage mitigation, with regional focus on the Vrancea events in Romania.
This paper presents work, done within projects of the CRC 461, which aim is to detect earthquake caused building damages. In the following, firstly the technique of airborne laserscanning will be described in brief. To gain informa-tion about affected areas, airborne sensors are very suitable since they operate from a high altitude and are not subject to the situation on the ground thus they can provide fast,
286 C. Schweier et al.: Simulation of earthquake caused building damages
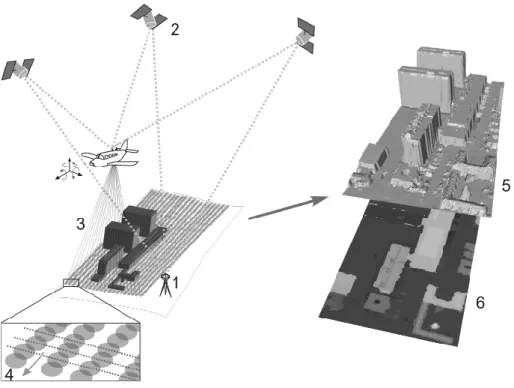
Fig. 1. Principle of Laserscanning
(ex-ample shows TopoSys system); com-ponents for dGPS (relatively position-ing usposition-ing GPS and referrposition-ing to refer-ence points): 1) GPS reference sta-tion, 2) GPS satellites; laserscanning: 3) laser light rays, 4) scan pattern on ground; results: 5) 3-D and 2-D 6) view of resulting DSM.
comprehensive and reliable information even from inacces-sible areas.
Then, the methodology to derive automatically geometri-cal building models will be presented. These models serve as basis for a change detection and damage interpretation step, which concepts will be presented in a following chapter.
To support the development of the damage analysis tools geometrical models of buildings in their undamaged and damaged state were created. The two methods used to gen-erate the model couples are described in detail in the second part of the paper.
2 Modelling of buildings based on laserscanning derived data
The methodology for modelling the buildings is part of an approach to rapidly detect and interpret building damages af-ter earthquakes. Therefore, the acquisition technique for the raw data is part of this procedure (raw data means in this con-text the data on which the analysis can be based on). More-over, the special bounding conditions after earthquakes must be regarded in the data acquisition concept, for instance the already mentioned possible inaccessibility of parts of the af-fected region.
Since the early nineties, an active airborne scanning tech-nique is operational and successfully used for dense three-dimensional point measurements: the laserscanning technol-ogy (see, e.g. Ackermann, 1999). This technique allows to efficiently and rapidly produce height data sets (DSM) which form the basic data set for the building modelling process in this paper. The modelling itself is based on the assump-tion that buildings are complex structures that can be approx-imated by piece-wise planar regions. On account of this,
planar parts in the DSM are extracted and their intercon-nections are analysed. This information is used to produce three-dimensional building vector models.
2.1 Laserscanning
Airborne laserscanning is operated from airplanes or heli-copters. They are equipped with the laserscanning system consisting of a laser light producing, sending and receiving unit, as well as navigation and positioning sensors (compare Fig. 1). The measurement itself is done by registering the time elapsed from sending a single laser light pulse and re-ceiving its reflections at the sensor. The position of the air-craft is continuously determined using the Global Position-ing System (GPS) in differential mode. This means that the coordinates of an already known point are determined at the same time, so that the aircraft’s position can be computed in reference to this point, reducing in that way a number of possible errors (e.g. caused by atmospheric influences). The orientation of the sensor is also registered using Inertial Nav-igation Systems. Regarding the known geometrical emitting relations (fixed through the optics of the scanning system), it is possible to derivate three-dimensional coordinates of the enlighted points in a reference coordinate system (more de-tails see, e.g. Wehr and Lohr, 1999; Steinle and B¨ahr, 1999). The more or less irregularly spread measurement points are used to interpolate the knot points’ height of an overlaid reg-ular grid (normally 1 m grid size). This results in a height matrix which is called Digital Surface Model (DSM).
In this approach, data acquired by the TopoSys sensors are used (see Lohr, 1998). These systems have the ability to scan in high resolution (typically 5–7 points/m2, but up to 25 is possible) with resulting DSMs that have a height accuracy of at least 15 cm (see Baltsavias, 1999).
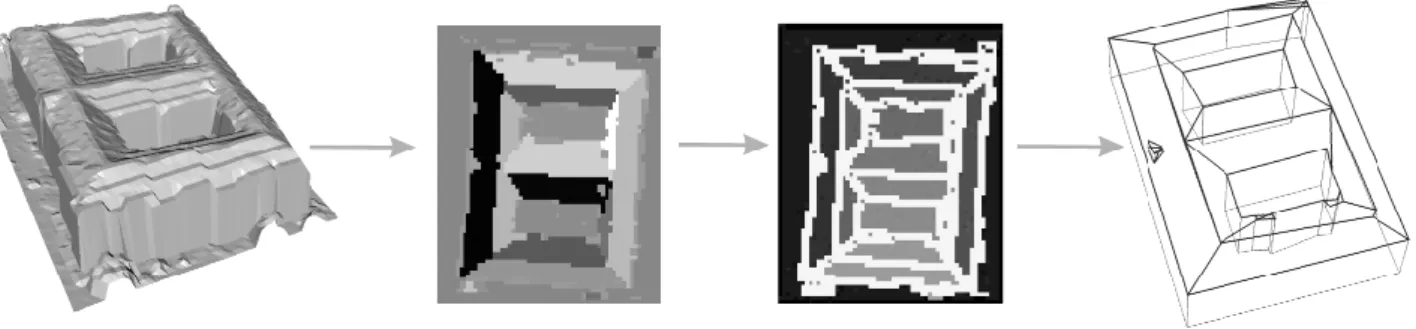
Fig. 2. Building modelling; from left to right: laserscanning derived DSM, extracted planar faces indicated by different grey values, found
common border lines (white) and resulting vector model.
2.2 Building modelling
The basic idea of the approach for modelling the buildings’ geometries is that buildings consist of a number of almost planar faces. Therefore, a technique was developed to find the planar parts of a building in the DSM and use them to compute the building’s edges and corners.
The extraction of the planes is done using a so-called re-gion growing methodology. This is a technique that starts in an image at a certain point or small area which fulfils certain criteria. Subsequently, all the pixels that are neighbouring to the starting point or region are examined. If they have certain features, not necessarily the ones used to find the starting re-gion, they are assumed to be a member of the region and the area of the region is expanded by them.
Here the process starts at 3×3 pixel area that can be approximated sufficiently well by a (mathematically deter-mined) plane. This means that some of the pixels in the re-gion are used to compute the plane’s parameters. The theo-retical heights of the other pixels in that area, computed by using the plane’s equation, and their real heights are com-pared. If the deviations do not exceed a certain threshold, the area is accepted as starting region.
The region, or segment, is then enlarged as long as neigh-bouring pixels can be found that do not deviate from the plane more than a certain (different) threshold. In contrast to the process of finding the starting region, the plane’s param-eters are recomputed each time a pixel is identified as being part of the region. Then, an equalized plane is computed tak-ing into account all the yet identified segments’ pixels. This is done to avoid possible errors caused by the arbitrary choice of the starting region and measurement inaccuracies.
After all the pixels of the image were segmented, which means that each pixel was assigned to a plane, a neighbour-hood analysis is carried out to find the planes topology. This is done in two steps. First the image received by the seg-mentation procedure is analysed. At each pixel position this image contains the number of the segment to which this pixel belongs to. For the analysis, all the segments are increased by one pixel. The segments that now overlap are marked as being possibly neighbouring.
Secondly, the common edges of segments are examined. This means the heights on both sides of these border lines are compared. If they deviate significantly, the two segments are not neighbouring but connected through a vertical plane (this means a wall). Therefore, such a plane is introduced at the common edge and the yet extracted topology altered appropriately.
The extracted planar faces and their topology are used to compute the buildings’ edges by mathematically intersecting the neighbouring planes. Derived from the planes topology, the edges topology can be set up and used to intersect the edges. As a result of these operations the buildings’ corner points are obtained. Thus, the geometric primitives of the regarded buildings (faces, lines and points) are found. They can be connected according to the extracted topology, lead-ing to vector models of the buildlead-ings’ geometry. The whole process is visualised in Fig. 2 (further details can be found in Steinle and V¨ogtle, 2001).
2.3 Change detection and damage interpretation
To be able to detect damages at buildings after destructing events like strong earthquakes, the buildings’ geometry in their intact state must be known. If this information is avail-able, then it is possible to compare it with the geometry extracted of data that was acquired after the event e.g. by the methodology described in the previous chapter. Thus, changes can be detected between the two states. They can be quantified using change measures like volume differences, plane orientation change, height change or size alteration. Further analysis is necessary to classify these changes and in that way interpret them.
Reconnaissance is carried out mainly in an urban environ-ment. But modifications at buildings in such a region are not necessarily the effect of catastrophic events. Therefore, it must be distinguished between changes that are the result of a damage and those that can be considered as normal mod-ifications in urban areas, e.g. by construction activities (see Steinle and B¨ahr, 2002 for details).
The changes identified as not being caused by normal urban modifications are classified using the previously de-veloped damage catalogue. The purpose of this catalogue
288 C. Schweier et al.: Simulation of earthquake caused building damages
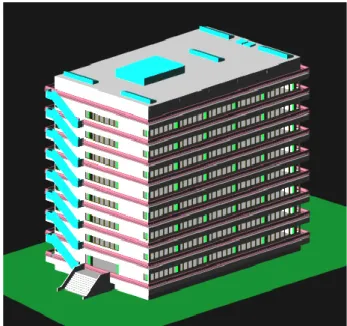
Fig. 3. Geometrical building model of an intact building.
is to serve as a basis for classification of different damage types of buildings occurring after earthquakes and contains the geometrical characteristics of each damage type. Dam-age types describe here the damDam-age situation of complete buildings. The damage catalogue was set up using various reports and pictures of damaged buildings which were col-lected and analysed for this purpose. To date, the damage catalogue database contains e.g. 1089 pictures of 121 differ-ent damaged buildings. Additional data were collected for these buildings, for instance the construction types.
The definition of the damage types used in our approach was done on the basis of the classes suggested by Okada (Okada and Takai, 2000). His classification was developed for a fast survey of damages by observers walking within the affected areas. It covers only a small number of damage structures, therefore, it was adapted and enhanced, according to the detectability of the characteristics in airborne laser-scanning data.
Besides the recognizable differences in the damage types, the needs of international rescue organisations were also taken into account. In an emergency case, rescue teams have to decide rapidly about the appropriate rescue techniques and this decision is highly dependent on the buildings’ ex-act damage state and construction type (see Markus et. al., 2000).
The classification of the identified changes into damage types can now be done automatically by comparing the ge-ometrical characteristics in the damage catalogue with those observed at the modified building (parts) after an earthquake. As they will rarely fit exactly, the most likely damage type of the catalogue will be assigned, but the ratio of concordance will also be given.
3 Simulation of earthquake caused building damages
The evaluation of the developed tools for change detection and damage interpretation requires, as seen above, geometric models of buildings in both their undamaged and damaged state. As at the moment there is no laserscanning derived data of earthquake damaged buildings available to the authors, ge-ometrical model sets, showing the pre- and post-event state of buildings, were artificially created. Using these models the required laserscanning data can be simulated. Two dif-ferent methods were developed for this task. In the first ap-proach, geometrical models of intact buildings are generated and different damages observed at similar buildings are arti-ficially applied to them (see Sect. 3.1); this will be referred to “simulated damage method”. In Sect. 3.2, a second method using the damaged buildings as starting basis is presented. The damage state models are created by photogrammetri-cal evaluation of digital photographs of collapsed buildings. Then, based on these models and additional information that was collected on-site, the buildings in their initial undamaged state can be simulated. In the following this method will be called “realistic damage method”.
3.1 Simulated damage method
In downtown Karlsruhe, several laserscanning flights were carried out. Since the university campus was also included, it was possible to generate geometrical models of some uni-versity buildings in undamaged state. A method to create geometrical models of these buildings with potential dam-ages is described in the following, exemplary shown at two buildings of the campus.
3.1.1 Creation of undamaged building models
The geometrical models of intact buildings extracted from laserscanning data are unsuitable for the “simulated dam-age method”, because they reproduce only the exterior of the buildings. If the simulated damage method is used to create damage state models complete models of the intact buildings are necessary, reproducing also their interior, especially the static structure. For this reason, undamaged building mod-els must be generated first based on construction plans of the respective buildings.
Different criteria were of importance for the selection of the buildings that shall serve as test data for the damage detection methodology. Laserscanning data had to exist of those buildings. Another deciding factor was the construc-tion type. Construcconstruc-tion types with high risk to collapse at earthquakes were to select, thus reliable knowledge about typical earthquake damages was available for the simula-tion of the damaged buildings. Beyond that, buildings with different construction types had to be chosen. It had been taken into account that different constructions lead to differ-ent damage types and a big variety of simulated damages is advantageous for the further development of the change de-tection. Finally, two buildings with different structures were
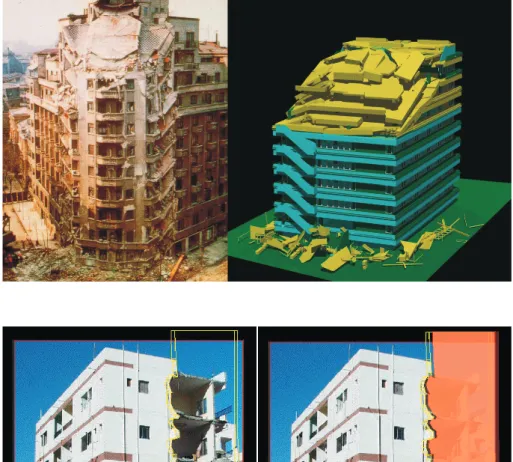
Fig. 4. Multi layer collapse of the
up-per stories: in reality (M¨unchener R¨uck, 1996) and as simulation.
Fig. 5. Marking the run of a crack on
an imported picture (original picture: Markus, 2001).
selected, a reinforced moment resisting concrete frame build-ing with concrete shear walls and a mixed structure consist-ing of a part with concrete frames and unreinforced masonry infill walls and a part with masonry bearing walls. There was a sufficient number of sheer plans and ground plans of both buildings available, which served as basis for the creation of the building models in an intact status. Since the data was partially not detailed enough for the simulation task, it was completed by inspection and partially surveying the build-ings’ interior.
AutoCAD 2000 was used for the creation of the models. It supports three basic types of three-dimensional (3-D) mod-elling: wireframe, surface and solid models. In this case solid models were used. With the AutoCAD solid modelling sys-tem complex 3-D models can be created by combining prim-itive shapes. A solid model contains the complete surface and edge definition, as well as a description of the interior features of the object. It is the only modelling system that of-fers the possibility to automatically calculate volumetric and mass properties (Leach, 2000). Generally, the bearing
ele-ments of the structure as well as all eleele-ments that contribute substantially to the rubble structure or can be detected by the laser ray were modelled. Figure 3 shows as example a geo-metrical model of an intact building generated on the basis of construction plans.
3.1.2 Creation of building models with potential damages Characteristic damage types were determined for the mod-elled buildings based on their construction type and observed damages, stored in the damage catalogue (see Sect. 2.3). For example, reinforced moment resisting concrete frame build-ings often experience a multi layer collapse of the upper sto-ries, therefore this damage type was chosen for simulation (compare Fig. 4).
Pictures of buildings with similar construction types as the modelled ones and damages that were needed for simulation were chosen in order to achieve a high degree of realism. The damage parameters were extracted from these pictures and transferred to the undamaged building models. The creation
290 C. Schweier et al.: Simulation of earthquake caused building damages
Fig. 6. Generation of the solid “crack”.
Fig. 7. Modelling of a crack in the wall.
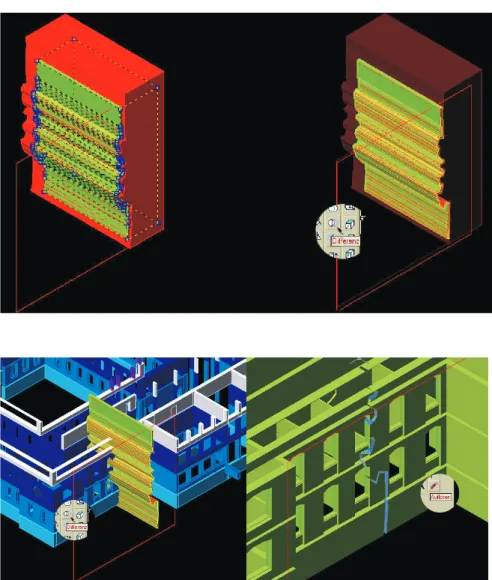
of a crack in a wall is presented exemplarily in Figs. 5–7, and explained in the following.
First, based on a picture of a real crack, a closed polyline (this is an AutoCAD terminology for a line consisting of an arbitrary number of straight lines) following on one side the form of the crack is extracted. This polyline is duplicated and placed close next to the initial one (compare Fig. 5). The two shapes defined by this closed polylines are extruded to solids orthogonally to their facade and subtracted from each other (compare Fig. 6). A solid of the crack is the result, which is used to create the same crack structure in the simu-lation. The placement of the crack at the undamaged building model should be made with respect to the static structure of the building e.g. cracks should not be placed at the position of columns, because the splitting of columns is unlikely. Sub-tracting the “solid crack” from the modelled structure results in a crack in the wall of the building model (compare Fig. 7). Numerous cracks have to be applied to a building model to generate a debris structure. Generally, the creation of sim-ulated damage state models follows the process in reality, i.e. the same sequence of failure of building parts is simu-lated. In the following example, the creation of a complex
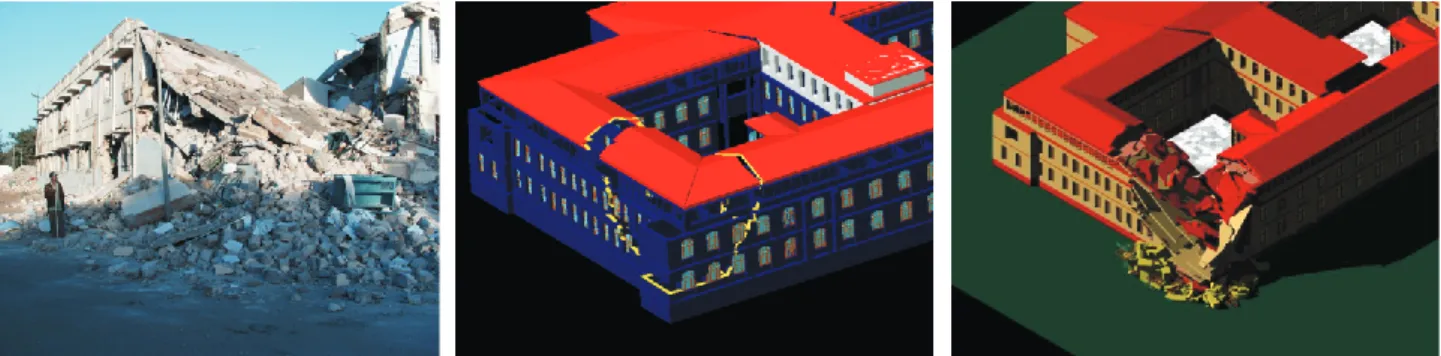
damage type, a so-called multi layer collapse at the corner of a building, is presented. According to a publication of the SwissRe, which describes the possible weak points of build-ings according to their ground plan (Tiedemann, 1992), this damage type arises often at buildings with an inner courtyard. Pictures from buildings damaged by an earthquake in In-dia (2001) in the Gujarat region were used for the creation of this model (compare Fig. 8). The respective characteristics were extracted from the pictures and applied to the building model. The edges of the simulated damaged region were se-lected from realistic cracks visible in the pictures. As at the modelled building the inner walls are masonry bearing walls, the damage simulation should be carried out with respect to this fact. For example, cracks lengthwise through the walls rarely occur in reality. First, big cracks through the whole building were generated defining the damaged area (compare Fig. 8). In a second step, the floor of the first story was split up in small pieces and placed on the lowest floor. This sim-ulates a failure of the first story floor, resulting from lacking support by the external walls. This leads to the collapse of the upper stories resulting in the damage type shown in Fig. 8.
Fig. 8. From left to right: real damage case, the run of the cuts at a building model, geometrical building model with simulated damages.
3.2 Realistic damage method
A second approach is to use photogrammetrical evaluation of digital photographs of collapsed buildings to generate three-dimensional “post-event” CAD-models. On the basis of these damage state models and on-site investigations, mod-els of the buildings in their initial undamaged state are simu-lated.
A small number of these models are intended to be used for response team training purposes. For this reason, the models include more details than is necessary for the dam-age detection process and interior objects are added.
In order to survey building collapse types occurring af-ter earthquakes and to study rescue actions, damaged areas were visited in Bhuj (India) from 31 January to 7 Febru-ary 2001 and in the region around Boumerdes (Algeria) from 24–29 May 2003. This was accomplished shortly after the earthquake events, while international rescue teams were still on-site. Many damage structures were still in their initial state after collapse and were not changed by heavy equip-ment or if altered, then only to a minor degree by rescue ac-tivities. At the moment, the spatial models of 10 different representative damage structures and three pre-collapse state models have been created and another 5 model pairs are in process. The procedure is described showing an example of a damage structure surveyed in Bhuj.
First, digital photographs of the object were taken from all accessible sides using the digital camera of Olympus Came-dia C 1400 XL with a resolution of 1280×1024 pixels. To en-hance accuracy, the structure had to cover the complete pho-tographs. The same prominent points must be located on at least two photographs, and these prominent points should not all be located on the same plane. In detail 36 photographs of the object were taken. Each had to be taken from a different camera position. A distance between the camera positions of at least 50 cm turned out to be sufficient for proper calcu-lation of the image orientation. The photographs in Algeria were taken with a Nikon Coolpix 5700, with a resolution of 2560×1920 pixels.
Good Commercial cameras are sufficient for the proce-dure, the small distortions can be adjusted by a camera cal-ibration procedure. The substantial parameter focal length of the camera has to be kept constant. This was ensured
by setting the focus to infinity and setting zoom to maximal wide. For determining the scale of the spatial models, dis-tances were measured within the damage structures and a 2 m reference basis was positioned in front of the photographed object.
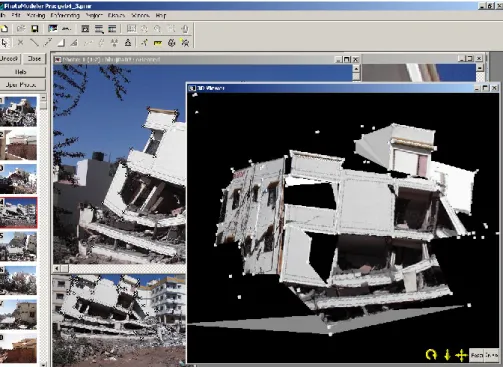
In the second step, the software “PhotoModeler Pro 4.0” of EOS Systems was used to generate a spatial model of ref-erence points of the damaged structure (Close Range Pho-togrammetry) (EOS, 2000). In general, suitable photographs of the object are chosen, and three or four overlapping pho-tographs are loaded with the software. After marking five to ten prominent points on each photograph, which have to be present in at least one of the other photographs, and refer-encing the identical points on the different photographs, an initial spatial model and the positions of the cameras can be calculated. The program’s internal process is iterative and consists of calculation of the camera positions for each pho-tograph (orientation) and subsequent common adjustment of the positions of the object points, camera positions and ori-entations (global optimisation). Based on this model, further photographs are added and the locations of further points are calculated, until the necessary corner points, edges and areas to describe the damaged structure are defined (see Fig. 9). This incremental approach is carried out in order to promptly recognise errors by inaccurate marking and by wrong point referencing. Best results are obtained when the structure is photographed from all sides.
The marking of the points is performed with a higher res-olution than the resres-olution of the digital photographs (Sub-pixel Marking). This is possible since points are usually marked at intersections of different lines which can be deter-mined at a higher accuracy than the pixel size. By marking points of a reference basis in the photographs and assigning the known value to this distance, the scale factor of the model can be computed. To define the coordinate system, three points within the xy−plane (elevation z=0 cm) are marked and the rotation of the model is calculated.
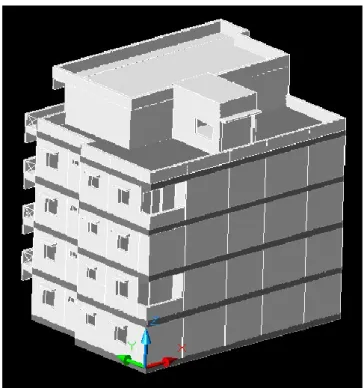
The represented model was created with a positioning curacy of ±7 cm, whereby 50% of all points reach an ac-curacy of ±2.5 cm. For further processing the model is exported into dxf format (“drawing exchange format”) and completed in CAD software to a 3-D-model with closed sur-faces (Fig. 10).
292 C. Schweier et al.: Simulation of earthquake caused building damages
Fig. 9. Creation of a first spatial model
of a damage structure with “Photo-Modeler Pro 4.0”, EOS Systems (EOS 2000).
Fig. 10. Resulting spatial model
com-pleted with AutoCAD 2002 software from Autodesk.
The initial, this means intact, state of the building is re-constructed with the help of the existing model, structural drawings (if available) and further onsite observations (com-pare Fig. 11). Often, the details can be reconstructed with the help of comparable buildings neighbouring the collapsed structure.
In the case of the demonstrated example, the number of storeys was determined based on the existing visible floors and confirmed by interviewing local citizens. Through the interviews it could also be found, that the ground storey was similar to the upper storeys; in these upper storeys large parts remained unchanged but dislocated.
4 Conclusions and future work
In this paper, the generation of geometrical building models based on laserscanning data and the concept of change detec-tion and damage interpretadetec-tion were described as a promis-ing tool for fast reconnaissance after disasters in an urban environment. Furthermore, two possibilities to create sets of geometrical building models, required for the development of the damage detection system, were presented.
The approach shows that the simulation of the damaged and the undamaged buildings with these two methods is pos-sible and leads to realistic results. National and international
Fig. 11. Reconstructed spatial model.
rescue team members have approved the quality of the dam-age state models, even for training aspects where the models are used in virtual reality simulations.
The damage catalogue database will be enlarged to distin-guish more precisely the geometrical characteristics of the different damage types. Further, spatial models of collapsed and reconstructed buildings will be created to provide a rep-resentative range of building damage types. Both measures help to advance in this way the development of the change detection and damage interpretation process.
Acknowledgements. The research presented was done within the project parts C5 and C7 of the Collaborative Research Centre (CRC) 461 Strong Earthquakes: A Challenge for Geosciences and Civil Engineering (http://www-sfb461.physik.uni-karlsruhe.de). The CRC 461 is funded by the Deutsche Forschungsgemeinschaft (German Research Foundation) and supported by the State of Baden-W¨urttemberg and the University of Karlsruhe. The authors would like to take the opportunity and thank for the offered possibilities. We thank Mrs. Brand of IPF for the kind assistance in the production of this paper, too.
Edited by: T. Glade Reviewed by: two referees
References
Ackermann, F.: Airborne laser scanning – present status and future expectations, ISPRS (International Society for Photogrammetry and Remote Sensing), Journal of Photogrammetry and Remote Sensing, 54, 64–67, 1999.
Baltsavias, E. P.: Airborne laser scanning: existing systems and firms and other resources, ISPRS, Journal of Photogrammetry and Remote Sensing, 54, 164–198, 1999.
Comfort, L. K.: Information Technology and Efficiency in Dis-aster Response: The Marmara, Turkey Earthquake, 17 Au-gust 1999, Quick Response Report # 130, Natural Hazards Center at the University of Colorado, Published online in Internet, URL: http://www.colorado.edu/IBS/hazards/qr/qr130/ qr130.html, (Cited 2003–09–20), 2000.
EOS Systems Inc.: Photo Modeler 4.0 Pro User Manual, Vancouver Canada, 2000.
Leach, J. A.: AutoCAD 2000 instructor, McGraw – Hill Companies Inc., USA, 2000.
Lohr, U.: Laserscan DEM for various applications, in: International Archives for Photogrammetry and Remote Sensing (IAPRS), edited by Fritsch, D., Englich, M., and Sester, M., Stuttgart, Ger-many, 32, 353–356, 1998.
Markus, M., Fiedrich, F., Gehbauer, F., and Hirschberger, S.: Strong Earthquakes, Rapid Damage Assessment and Rescue Planning, in: Proc. of the 7th Annual Conference of the International Emer-gency Management Society: “ContinEmer-gency, EmerEmer-gency, Crisis, and Disaster Management: Emergency Management in the Third Millennium”, edited by Kowalski, K. M. and Trevits, M. A., Or-lando, Florida, May 1999, 369–378, 2000.
M¨unchener R¨uck: Photographies from the archives of Dr. Gerhard Berz and Christian Birkner, M¨unchen, 1996.
Okada, S.and Takai, N.: Classifications of Structural Types and Damage Patterns of Buildings for Earthquake Field Investiga-tion, Twelfth World Conference on Earthquake Engineering, 705/4/A, Balkema, Rotterdam, 2000.
Steinle, E. and B¨ahr, H.-P.: Laserscanning for change detection in urban environment, in: Third Turkish-German Joint Geode-tic Days “Towards A Digital Age”, edited by Altan, M. O. and Gr¨undig, L., Istanbul, Turkey, I, 147–156, 1999.
Steinle, E. and B¨ahr, H.-P.: Detectability of urban changes from air-borne laserscanning data, in: Resource and environmental mon-itoring, ISPRS commission VII symposium, Hyderabad, India, December 2002, edited by Navalgund, R. R., Nayak, S. R., Su-darshana, R., Nagaraja, R., and Ravindran, S., 2002.
Steinle, E. and V¨ogtle, T.: Automated extraction and reconstruc-tion of buildings in laserscanning data for disaster management, in: Proceedings of the Workshop Monte Verita, Switzerland, 10–15 June 2001, edited by Baltsavias, E. P., Gruen, A., and Van Gool, L., Automatic Extraction of Man-Made Objects from Aerial and Space Images (III), Balkema (Swets & Zeitlinger), Lisse, The Netherlands, 309–318, 2001.
Tiedemann, H.: Earthquake and Volcanic Eruptions: A Handbook on Risk Assessment, Swiss Reinsurance Company, Z¨urich, 1992 Wehr, A. and Lohr, U.: Airborne laser scanning – an introduc-tion and overview, ISPRS Journal of Photogrammetry & Remote Sensing, 54, 68–82, 1999.