HAL Id: hal-00301316
https://hal.archives-ouvertes.fr/hal-00301316
Submitted on 25 Jun 2004HAL is a multi-disciplinary open access
archive for the deposit and dissemination of sci-entific research documents, whether they are pub-lished or not. The documents may come from teaching and research institutions in France or abroad, or from public or private research centers.
L’archive ouverte pluridisciplinaire HAL, est destinée au dépôt et à la diffusion de documents scientifiques de niveau recherche, publiés ou non, émanant des établissements d’enseignement et de recherche français ou étrangers, des laboratoires publics ou privés.
Atmospheric particle formation events at Värriö
measurement station in Finnish Lapland 1998?2002
H. Vehkamäki, M. Dal Maso, T. Hussein, R. Flanagan, A. Hyvärinen, J.
Lauros, J. Merikanto, P. Mönkkönen, M. Pihlatie, K. Salminen, et al.
To cite this version:
H. Vehkamäki, M. Dal Maso, T. Hussein, R. Flanagan, A. Hyvärinen, et al.. Atmospheric particle for-mation events at Värriö measurement station in Finnish Lapland 1998?2002. Atmospheric Chemistry and Physics Discussions, European Geosciences Union, 2004, 4 (3), pp.3535-3563. �hal-00301316�
ACPD
4, 3535–3563, 2004Atmospheric particle formation events
H. Vehkam ¨aki et al.
Title Page Abstract Introduction Conclusions References Tables Figures J I J I Back Close
Full Screen / Esc
Print Version Interactive Discussion
© EGU 2004 Atmos. Chem. Phys. Discuss., 4, 3535–3563, 2004
www.atmos-chem-phys.org/acpd/4/3535/ SRef-ID: 1680-7375/acpd/2004-4-3535 © European Geosciences Union 2004
Atmospheric Chemistry and Physics Discussions
Atmospheric particle formation events at
V ¨arri ¨
o measurement station in Finnish
Lapland 1998–2002
H. Vehkam ¨aki1, M. Dal Maso1, T. Hussein1, R. Flanagan1, A. Hyv ¨arinen2, J. Lauros1, J. Merikanto1, P. M ¨onkk ¨onen1, M. Pihlatie1, K. Salminen2, L. Sogacheva1, T. Thum2, T. Ruuskanen1, P. Keronen1, P. P. Aalto1, P. Hari3, K. E. J. Lehtinen1, ¨U. Rannik1, and M. Kulmala1
1
Department of Physical Sciences, P.O. Box 64, University of Helsinki, 00014 Helsinki, Finland
2
Finnish Meteorological Institute, P.O Box 503, 00101 Helsinki, Finland
3
Department of Forest Ecology, P.O. Box 27, University of Helsinki, 00014 Helsinki, Finland Received: 13 May 2004 – Accepted: 26 May 2004 – Published: 25 June 2004
ACPD
4, 3535–3563, 2004Atmospheric particle formation events
H. Vehkam ¨aki et al.
Title Page Abstract Introduction Conclusions References Tables Figures J I J I Back Close
Full Screen / Esc
Print Version Interactive Discussion
© EGU 2004
Abstract
We have identified 147 clear 8 nm diameter particle formation events at the SMEAR I station in V ¨arri ¨o, northern Finland during calendar years 1998–2002. The events have been classified in detail according to the particle formation rate, growth rate, event starting time, different gas phase species concentrations and pre-existing particle con-5
centrations as well as various meteorological conditions. Most of the events occurred during the spring months between March and May, suggesting that increasing biolog-ical activity might produce the precursor gases for particle formation. The apparent 8 nm particle formation rates were around 0.1/cm3s, and they were uncorrelated with growth rates that vary between 0.5 and 10 nm/h. The air masses, which had clearly 10
elevated sulphur dioxide concentrations above 1.6 ppb came, as expected, from the direction of Nikel and Monschegorsk smelteries. Only 15 formation events can be ex-plained by the pollution plume from these sources.
1. Introduction
Atmospheric particles affect the Earth’s climate both directly by scattering incoming 15
solar radiation and also the long wave radiation escaping from our planet, and indirectly by influencing the properties and occurrence of clouds (Menon, et al., 2002; Stott et al., 2000). Particles can also have undesirable effects on human health (Dockery and Pope, 1994; Stieb et al., 2002). Most of the atmospheric particulate matter is formed by condensation of vapours onto pre-existing particles. The smallest particles are either 20
formed entirely from vapour without any condensation seed nuclei (Kulmala, 2003), or by electrostatically enhanced condensation onto atmospheric ions (Yu and Turco, 2000).
Atmospheric fine particle formation events have been observed around the world in various environments from polluted cities to remote polar background areas (Kulmala 25
ACPD
4, 3535–3563, 2004Atmospheric particle formation events
H. Vehkam ¨aki et al.
Title Page Abstract Introduction Conclusions References Tables Figures J I J I Back Close
Full Screen / Esc
Print Version Interactive Discussion
© EGU 2004 but sulphuric acid together with ammonia are considered to be the prime candidates
(Napari et al., 2002). It is quite likely that different mechanisms dominate particle for-mation in different atmospheric conditions. Using the present aerosol instrumentation we can detect the newly formed particles only when they have grown to diameters above the experimental cut-off of 3–10 nm. Therefore, it has been suggested that par-5
ticle nucleation occurs continuously, but the formation events are only observed when initial growth is enabled (Kulmala et al., 2000).
This work presents the analysis of continuous aerosol particle size distribution data collected during the five year period 1998–2002 at the SMEAR I station in V ¨arri ¨o 250 km north of the Arctic Circle in Finnish Lapland. Most of the time the air at the 10
station is pollution free with no local sources, but occasionally very polluted air reaches V ¨arri ¨o from the Nikel and Montschegorsk smelters less than 200 km north and east of the station, respectively. The focus of the analysis was to identify the particle forma-tion events, compare the event and non-event days and study the influence of mete-orological variables, air mass origin and measured gas concentrations on the particle 15
formation.
2. Measurement station
The V ¨arri ¨o measurement station SMEAR I (Hari et al., 1994) is located at 67◦460N latitude and 29◦350E longitude 250 km north of the Arctic circle in Eastern Lapland, less than 10 km from the Finnish-Russian border. The measurements were performed 20
on the top of a hill 390 m above sea level (a.s.l.). The main tree species was about 50 year-old Scots pine (Pinus Sylvestris L.) with a mean height of approximately eight meters and a mean diameter of approximately eight centimetres. The station is located below the alpine timberline (400 a.s.l.), and some of the fjell tops are above it. The nearest small road is 8 km from the station, and the nearest major road 100 km. There 25
are no towns or industry close by and thus practically no local pollution. The nearest major pollution sources were Montschegorsk located 150 km east and Nikel located
ACPD
4, 3535–3563, 2004Atmospheric particle formation events
H. Vehkam ¨aki et al.
Title Page Abstract Introduction Conclusions References Tables Figures J I J I Back Close
Full Screen / Esc
Print Version Interactive Discussion
© EGU 2004 190 km north of the station. The V ¨arri ¨o station and Monschegorsk are separated by a
line of mountains ranging from north to south on the Russian side of the border. The aerosol particle size distributions were measured with a DMPS system (Aalto et al., 2001; Jokinen and M ¨akel ¨a, 1997) consisting of a Hauke-type DMA (length 28 cm) and a TSI 3010 condensation nucleus counter. The lower and upper cut-off diameters 5
of the system are 8 nm and 500 nm, respectively, and the set up measured one full size distribution in 10 min, giving 144 distributions a day. The inlet for the DMPS system was at a height of 2 m on the wall of the measurement cabin, and the DMPS itself was inside the cabin at room temperature, which at low atmospheric temperatures led to evaporation of water and possibly some other volatile compounds from the particles 10
before they entered the instrument.
The measurements for trace gases SO2, O3, NOx, temperature, absolute humidity and wind speed were also performed continuously at 2.2 m, 4.4 m, 6.6 m, 9 m and 15 m levels of the measurement tower adjacent to the cabin. A detailed description of the trace gas measurements can be found in Ruuskanen et al. (2003). UVA, UVB, photo-15
synthetically active, reflected and global radiation and wind direction were measured at the top of the tower (15 m), and relative humidity and pressure at 2 m. Rainfall was also measured and we had access to the snow depth data of the Finnish Environment In-stitute. To determine the origin of the air masses we calculated back trajectories using the NOAA Air Resources Laboratory HYSPLIT model.
20
3. Event characterization
The particle size distribution evolution was analysed on each day during 1998–2002, and the particle formation events were identified and characterized. Table 1 shows the criteria used when classifying the formation events. Non-event days are the days that do not fall into any of the categories in Table 1. The analysis focuses on class one and 25
two events, the number of which during each calendar year is given in Table 2.
ACPD
4, 3535–3563, 2004Atmospheric particle formation events
H. Vehkam ¨aki et al.
Title Page Abstract Introduction Conclusions References Tables Figures J I J I Back Close
Full Screen / Esc
Print Version Interactive Discussion
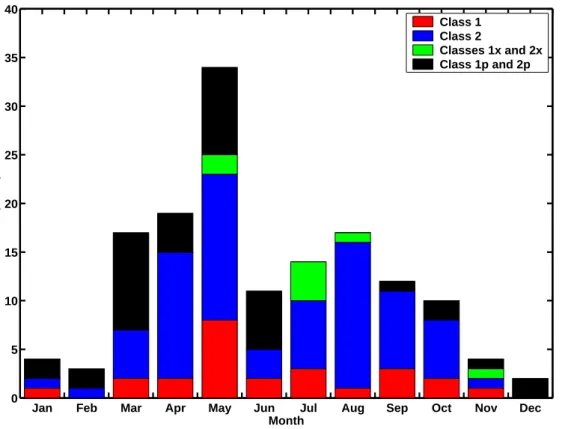
© EGU 2004 seen from Fig. 1. The spring maximum is also typical for other Boreal sites like the
SMEAR II station in Hyyti ¨al ¨a, southern Finland (M ¨akel ¨a et al., 1997). However, there it occurs earlier in the year than in V ¨arri ¨o, consistent with the fact that spring starts earlier in a more southern location. Throughout summer and autumn the number of events per month is just above ten, decreasing to only a few events per month during 5
the winter months. The weaker autumn maximum that is observed in Hyyti ¨al ¨a was not as clearly distinguishable in V ¨arri ¨o.
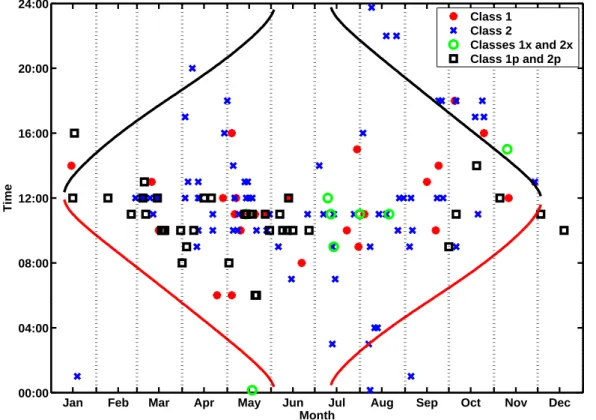
The majority of particle formation events observed all around the world (Kulmala et al., 2004) start between sunrise and noon. However, there is one exception: Wieden-sohler et al. (1997) observed particle formation events during night time. Figure 2 10
shows the yearly cycle of event starting times in V ¨arri ¨o together with sunrise and sun-set times. The starting time is the time when elevated concentrations of 8 nm particles were first observed. In V ¨arri ¨o most of the events also occurred during the daytime, sug-gesting that photochemistry is involved. Sunlight is most likely needed to produce the nucleating and condensing vapours from their precursors by photochemical reactions, 15
but the boundary layer mixing following solar heating can be another factor connect-ing solar radiation with formation bursts. In V ¨arri ¨o the event startconnect-ing times were rather constant throughout the year, unlike in Hyyti ¨al ¨a where they clearly follow the sunrise curve. It must be kept in mind that in Hyyti ¨al ¨a, instrumentation is available with a 3 nm diameter cut-off. The cut-off in V¨arri¨o was 8 nm and thus the time difference between 20
nucleation and observation could be much larger in V ¨arri ¨o, depending on growth rate. This difference in instrumentation might be the reason we a see a difference in the behaviour of event starting times at the two stations.
Due to their rarity dark time events deserve some special attention. Most of the events, which occurred when the sun was below the horizon started within a few hours 25
after the sunset, which could be explained by actual formation during daylight and slow growth to 8 nm diameter. Some of the dark time events occurred after a clear event on the previous day was interrupted by rain and the particle production resumed when the rain stopped. Somewhat surprisingly there were some events also during the
ACPD
4, 3535–3563, 2004Atmospheric particle formation events
H. Vehkam ¨aki et al.
Title Page Abstract Introduction Conclusions References Tables Figures J I J I Back Close
Full Screen / Esc
Print Version Interactive Discussion
© EGU 2004 midwinter polar night. The other possible explanation for dark time events is that the
formation and growth had occurred even days previous at lower latitudes (where there was still some sunlight), since the growth rate in the Arctic and marine atmosphere can sometimes be very small, even as low as 0.1–0.5 nm/h (see Kulmala et al., 2004).
Events were observed to cluster together, which was most likely due to periods of 5
weather conditions that favour particle formation. However, two class 1 events very rarely occur on two consecutive days, which can be explained by the fact that a strong nucleation event will increase the condensational sink and thus decrease the concen-tration of condensable vapours. There were 10 cases where two events occurred dur-ing the same calendar day, the minimum difference in starting times was 6 h, and the 10
events were typically of class 2 or 3. The seasonal distribution of two event days was even.
We also studied the effect of snow fall and melting on the occurrence of events, but did not find any correlation beyond the fact that sunny days in the spring time resulted both in snow melting and particle formation, and events only extremely rarely occurred 15
on days with snowfall.
4. Relation to air mass origin and wind conditions
Figure 3 shows a characterization of the events according to starting time and air mass. Morning events start between midnight and sunrise, and evening events between sun-set and midnight. The air mass was considered polluted if the average concentration 20
of SO2(at 2.2 m level) was over 0.35 ppb (1 µg/m3) during the 10 h period surrounding the event starting time. The diagram indicates that most of the polluted air came from the direction of the Kola Peninsula’s copper and nickel smelteries at Montchegorsk and Nikel (Ruuskanen et al., 2003). In two cases (20 and 21 May 1999) the SO2 concentra-tions were rather high (2.6–4.2 ppb) and the trajectories came from sector 240◦–360◦, 25
but the local wind was clearly easterly. These cases were placed in the sector 0◦–120◦. In the remaining polluted cases with trajectories from sectors 120◦–240◦ and 240◦–
ACPD
4, 3535–3563, 2004Atmospheric particle formation events
H. Vehkam ¨aki et al.
Title Page Abstract Introduction Conclusions References Tables Figures J I J I Back Close
Full Screen / Esc
Print Version Interactive Discussion
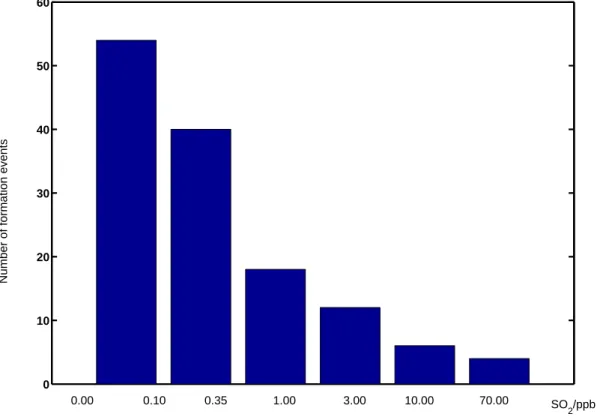
© EGU 2004 360◦the SO2concentrations are around 0.5 ppb, and, in only a couple of cases above
1 ppb, with a maximum of 1.6 ppb. Figure 4 shows the distribution of events according to the SO2concentration. The highest 10 h average concentration on an event day was 65 ppb.
Pirjola et al. (1998) showed that the measured SO2concentrations can only explain 5
part of the events occurring in V ¨arri ¨o, typically the ones where the air mass comes from the Kola peninsula. Most of the morning and evening time events occurred in SO2clean conditions with trajectories from west or north-west, so the Kola pollution sources do not explain the dark time events. One possibility is that these trajectories brought aged polluted air from North America or Britain, and the sulphur dioxide had already been 10
converted into sulphuric acid, which could not be detected with the current instruments in V ¨arri ¨o.
Table 3 shows the local wind direction distribution on event and non-event days. The west-south-westerly winds were connected with events and the south-west-southerly winds with non-events. Westerly winds and trajectories from the Atlantic ocean support 15
the suggestion that air masses and synoptic weather conditions affect particle forma-tion (Nilsson et al., 2001).
5. Effect of temperature, gas concentrations and solar radiation
The yearly averages of the diurnal behaviour of meteorological quantities and gas con-centrations were compared between event days and non-event days. We also made 20
the comparison separately for different seasons to check if the differences between event and non-event conditions are dependent on the time of the year. For gases and temperature we used the value measured at 2 m or 2.2 m height, which was close to the particle measurement level.
The temperature was on average higher on event days than non-event days. This 25
naturally reflects the fact that most of the events occur during the relatively warm sea-son. The seasonal comparisons show that during winter the event days have higher
ACPD
4, 3535–3563, 2004Atmospheric particle formation events
H. Vehkam ¨aki et al.
Title Page Abstract Introduction Conclusions References Tables Figures J I J I Back Close
Full Screen / Esc
Print Version Interactive Discussion
© EGU 2004 temperatures than non-event days, and during the rest of the year the event days are
on average colder than the non-event days. To eliminate the effect of seasonal varia-tions, we show in Fig. 5 the temperature difference compared to 30 day sliding mean temperatures. This figure illustrates that event days have lower morning temperatures but higher noon temperatures which is typical for clear sky conditions. Low tempera-5
tures can strongly enhance particle formation since the saturation vapour pressures of atmospheric substances decrease exponentially with decreasing temperature.
The relative humidity was lower during event days, except for the winter months, when no clear difference was observed. Figure 6 shows the mean diurnal behaviour of relative humidity between event and non-event days. Eliminating the seasonal varia-10
tions in the same way as with temperature (Fig. 5) did not make a significant difference to this figure. High water vapour concentration in the air seemed to prevent particle formation, as has been observed also in Hyyti ¨al ¨a (Boy and Kulmala, 2002). This could be explained by the fact that relative humidity is higher in cloudy days with less solar radiation to produce OH radicals and further condensable vapours, and/or the humid-15
ity causing the pre-existing aerosol sizes to grow so that it provides more surface for vapour condensation.
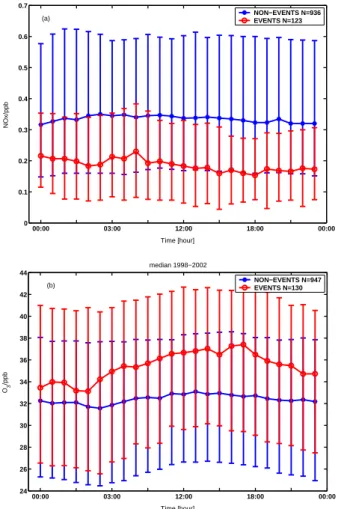
The concentration of NOx was clearly lower and the concentration of O3 higher on event days for the whole year as shown by Figs. 7a–7b. Again, removing the seasonal trend did not change these pictures significantly. The median NO concentration did 20
not differ on event and non-event days. Due to the measurement set-up, the NOx concentrations used in this paper may from time to time include considerable amounts of other nitrogen containing species than NO and NO2.
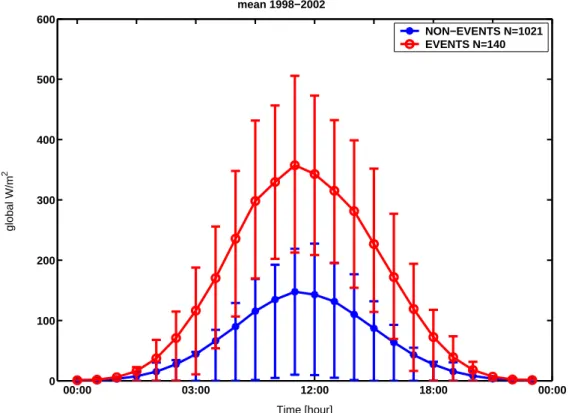
Global radiation was higher on event days during all seasons except winter, when there was very little difference between event and non-event days. The mean diurnal 25
behaviour comparison is shown in Fig. 8.
The higher ozone concentration during event days compared with non-event days can be explained by photochemical reaction cycles (Seinfeld and Pandis, 1998). The same mechanism would explain the lower NOx concentrations on event days.
ACPD
4, 3535–3563, 2004Atmospheric particle formation events
H. Vehkam ¨aki et al.
Title Page Abstract Introduction Conclusions References Tables Figures J I J I Back Close
Full Screen / Esc
Print Version Interactive Discussion
© EGU 2004
6. Formation and growth rates
We estimated the formation rates of 8 nm particles and their growth rates from the size distribution data. The particle growth rates varied between 0.5 and 10 nm/h (Fig. 9a). The growth rates have a maximum in summertime and minimum in wintertime. The formation and growth rates in December, January and February are left out due to poor 5
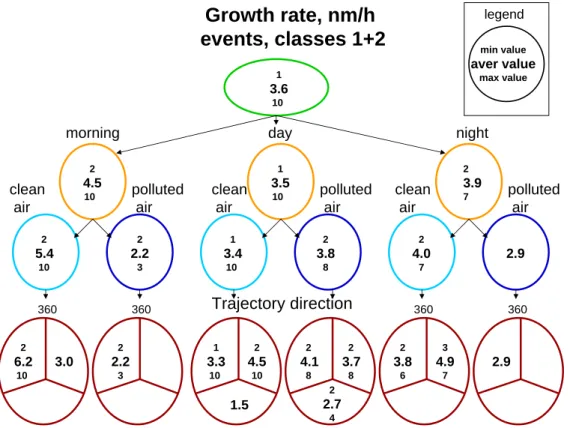
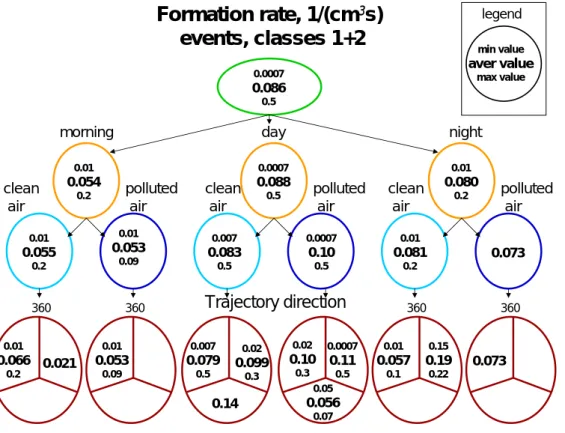
statistics. The formation rates were around 0.1 cm−3s−1 (Fig. 9b), and they exhibited no clear seasonal variation. Furthermore, the growth rates and the formation rates did not seem to correlate with each other. Figures 10 and 11 show the mean, minimum and maximum growth and formation rates, respectively, for events occurring at different times of the day and in different air masses (characterization as in Fig. 3). The growth 10
rates were highest in the morning time clean air events where the air was coming from westerly directions. For day and evening events, easterly air masses led to the highest growth rates. Polluted air with high SO2 concentrations did not increase the growth rates significantly. Note that during morning and night there was altogether only 3 polluted events as seen from Fig. 3, and in all those cases the SO2concentration was 15
only around 0.5 ppb. Morning events had on average slightly lower formation rates than the day and night events. In the case of SO2clean air masses easterly trajectories led to higher formation rates, for polluted day events southerly air masses had clearly lower formation rates.
Figure 12 shows the condensation sink (Dal Maso et al., 2002; Kulmala et al., 2001) 20
calculated from the measured aerosol size distributions during different kinds of event conditions. The condensation sink describes the ability of the pre-existing aerosol par-ticles to deplete the condensable vapour. It was clearly higher during daytime polluted events than during clean air events. The rare morning and night time medium high SO2 events do not seem polluted from the point of view of pre-existing aerosol popu-25
lation. Easterly or southerly trajectories during pollution led to the highest sink values. The condensation sink was on average lower on event days compared to the non-event days throughout the year, February being the only exception, possibly due to bad
statis-ACPD
4, 3535–3563, 2004Atmospheric particle formation events
H. Vehkam ¨aki et al.
Title Page Abstract Introduction Conclusions References Tables Figures J I J I Back Close
Full Screen / Esc
Print Version Interactive Discussion
© EGU 2004 tics. The condensation sink clearly decreased before the start of the event in roughly
half of the cases.
Figure 13 shows the condensable vapour source rate in different conditions. The source rate was calculated from the vapour concentration needed to explain the ob-served growth rate and the condensation sink by assuming that the vapour was in a 5
steady state i.e. the source replaces the losses to aerosol particles (Kulmala et al., 2001). The calculated source rates were high during daytime polluted events, since fast vapour production is needed to compensate high condensation sinks and sustain observed growth. Both for condensation sink and source rate easterly trajectories led to higher values in clean air masses.
10
7. Conclusions
We have identified 147 clear 8 nm diameter particle formation events at the SMEAR I station in V ¨arri ¨o, northern Finland during calendar years 1998–2002. The events have been classified in detail according to the particle formation rate, growth rate, event start-ing time, different gas phase species concentrations and condensable vapour source 15
rates as well as various metrological conditions. Most of the events occurred during the spring months between March and May, suggesting that increasing biological ac-tivity might produce the precursor gases for particle formation. Most of the events also occurred during daylight hours, which is usually the case for other observations around the world. However, around twenty events were observed when the sun was below the 20
horizon. Most, but not all, of these occurred shortly after sunset and could be explained by actual nucleation or initial activation during daylight, but slow growth allowed us to detect the particles only after sunset. There were also a few events during the midwin-ter polar night. The formation event starting times did not follow the seasonal sunrise variation like they do in SMEAR II Hyyti ¨al ¨a, which also could be due to the larger cut off 25
diameter of the particle sizing instrument in V ¨arri ¨o. To study the particle formation rig-orously, a measurement system with a 3 nm cut off diameter (like in Hyyti¨al¨a) is indeed
ACPD
4, 3535–3563, 2004Atmospheric particle formation events
H. Vehkam ¨aki et al.
Title Page Abstract Introduction Conclusions References Tables Figures J I J I Back Close
Full Screen / Esc
Print Version Interactive Discussion
© EGU 2004 needed in V ¨arri ¨o.
Our analysis is consistent with earlier studies showing that low relative humidity and low morning temperatures favour particle formation, and high solar radiation and ozone concentrations are typical for event days, suggesting the importance of photochem-istry. The apparent 8 nm particle formation rates were around 0.1/cm3s, and they were 5
uncorrelated with growth rates, which varied between 0.5 and 10 nm/h. We have clas-sified the air mass as polluted or non-polluted on the basis of SO2concentration using 0.35 ppb as the limit. This classification is crude both due to the arbitrariness of the limit and due to the fact that SO2alone is used. The air masses, which had clearly elevated sulphur dioxide concentrations above 1.6 ppb came, as expected, from the direction of 10
the Nikel and Monschegorsk smelteries. Only 15 formation events can be explained by the pollution plume from these sources, and none of the dark time events fall into this category. The plumes resulted in higher formation rates of 8 nm particles compared to clean air formation events, but they did not influence the growth rate of these particles. The condensation sink, which is a measure of the pre-existing particle surface avail-15
able for condensation correlated with sulphur dioxide concentration confirming that the SO2rich plume air was polluted in a more general sense.
Acknowledgements. The authors gratefully acknowledge the NOAA Air Resources Laboratory
(ARL) for the provision of the HYSPLIT transport and dispersion model and READY web-site (http://www.arl.noaa.gov/ready.html) used in this study. This work was supported by the
20
Academy of Finland. We thank the Finnish Environmental Institute for the snow depth data.
References
Aalto, P., H ¨ameri, K., Becker, E., Weber, R., Salm, J., M ¨akel ¨a, J. M., Hoell, C., O’Dowd, C. D., Karlsson, H., Hansson, H.-C., V ¨akev ¨a, M., Koponen, I. K., Buzorius, G., and Kulmala, M.: Physical characterization of aerosol particles during nucleation events, Tellus, 53B, 344–358,
25
2001.
Boy, M. and Kulmala, K.: Nucleation events in the continental boundary layer: Influence of physical and meteorological parameters, Atmos. Chem. Phys., 2, 1–16, 2002.
ACPD
4, 3535–3563, 2004Atmospheric particle formation events
H. Vehkam ¨aki et al.
Title Page Abstract Introduction Conclusions References Tables Figures J I J I Back Close
Full Screen / Esc
Print Version Interactive Discussion
© EGU 2004
Dal Maso, M., Kulmala, M., Lehtinen, K. E. J., M ¨akel ¨a, J. M., Aalto, P. A., and O’Dowd, C. D.: Condensation and coagulation sinks and formation of nucleation mode particles in coastal and boreal forest boundary layers, J. Geophys. Res., 107, doi:10.1029/2001JD001053, 2002.
Dockery, D. W. and Pope, C. A.: Acute respiratory effects of particulate air pollution, Annu. Rev.
5
Public. Health, 15, 107–132, 1994.
Hari, P., Kulmala, M., Pohja, T., Lahti, T., Siivola, E., Palva, E., Aalto, P., H ¨ameri, K., Vesala, T., Luoma, S., and Pulliainen, E.: Air pollution in eastern Lapland:challenge for an environmental measurement station, Silva Fennica, 28, 1, 29–39, 1994.
Jokinen, V. and M ¨akel ¨a, J. M.: Closed loop arrangement with critical orifice for DMA
10
sheath/excess flow system, J. Aerosol Sci., 28, 643–648, 1997.
Kulmala, M.: How Particles Nucleate and Grow, Science, 302, 1000–1001, 2003.
Kulmala, M., Dal Maso, M., M ¨akel ¨a, J. M., Pirjola, L., V ¨akev ¨a, M., Aalto, P., Miikkulainen, P., H ¨ameri, K., and O’Dowd, C.: On the formation, growth and composition of nucleation mode particles, Tellus B, 53, 479–490, 2001.
15
Kulmala, M., Pirjola, L., and M ¨akel ¨a, J. M.: Stable sulphate clusters as a source of new atmo-spheric particles, Nature, 404, 66–69, 2000.
Kulmala, M., Vehkam ¨aki, H., Pet ¨aj ¨a, T., Dal Maso, M., Lauri, A., Kerminen, V.-M., Birmili, W., and McMurry, P. H.: Formation and growth rates of ultrafine atmospheric particles: a review of observations, J. Aerosol Sci., 35, 143–176, 2004.
20
Menon, S., Del Genio, A. D., Koch, D., and Tselioudis, G.: GCM simulations of the aerosol indirect effect: Sensitivity to cloud parameterization and aerosol burden, J. Atmos. Sc., 59, 692–713, 2002.
M ¨akel ¨a, J. M., Aalto, P., Jokinen, V., Pohja, T., Nissinen, A., Palmroth, S., Markkanen, T., Seitsonen, K., Lihavainen, H., and Kulmala, M.: Observations of ultrafine aerosol particle
25
formation and growth in boreal forest. Geophys. Res. Lett., 24, 1219–1222, 1997.
Napari, I., Noppel, M., Vehkam ¨aki, H., and Kulmala, M.: An improved model for ternary nucle-ation of sulfuric acid – ammonia – water, J. Chem. Phys., 116, 4221–4227, 2002.
Nilsson, E. D., Paatero, J., and Boy, M.: Effects of air masses and synoptic weather on aerosol formation in continental boundary layer, Tellus, 53B, 462–478, 2001.
30
Pirjola, L., Laaksonen, A., Aalto, P., and Kulmala, M.: Sulfate aerosol formation in the Arctic boundary layer, J. Geophys. Res., 103, 8309–8322, 1998.
ACPD
4, 3535–3563, 2004Atmospheric particle formation events
H. Vehkam ¨aki et al.
Title Page Abstract Introduction Conclusions References Tables Figures J I J I Back Close
Full Screen / Esc
Print Version Interactive Discussion
© EGU 2004
Kulmala, M.: Atmospheric trace gas and aerosol particle concentration measurements in Eastern Lapland, Finland 1992–2001, Bor. Env. Res., 8, 335–349, 2003.
Seinfeld, J. H. and Pandis, S. N.: Atmospheric Chemistry and Physics: From Air Pollution to Climate Change, Wiley, New York, 1998.
Stieb, D. M., Judek, S., and Burnett, R. T.: Meta-analysis of time-series studies of air pollution
5
and mortality: Effects of gases and particles and their influence of cause of death, age and seson, J. Air Manag. Techn., 14, 48–65, 2002.
Stott, P. A., Tett, S. F. B., Jones, G. S., Allen, M. R., Mitchell, J. F. B., and Jenkins, G. J.: External control of 20th century temperature by natural and anthropogenic forcings, Science, 290, 2133–2137, 2000.
10
Yu, F. and Turco, R. P.: Ultrafine aerosol formation via ion-mediated nucleation, Geophys. Res. Letters, 27, 883–886, 2000.
ACPD
4, 3535–3563, 2004Atmospheric particle formation events
H. Vehkam ¨aki et al.
Title Page Abstract Introduction Conclusions References Tables Figures J I J I Back Close
Full Screen / Esc
Print Version Interactive Discussion
© EGU 2004
Table 1. The criteria for event classification. Class Criteria
1 Clear formation, smooth growth
2 Clear formation but fluctuating or distorted growth
3 Unclear formation (Number of particles with diameter less than 15 nm increases) 0 Possible formation
X Clear growth starting above the smallest size classes P Pollution during formation
ACPD
4, 3535–3563, 2004Atmospheric particle formation events
H. Vehkam ¨aki et al.
Title Page Abstract Introduction Conclusions References Tables Figures J I J I Back Close
Full Screen / Esc
Print Version Interactive Discussion
© EGU 2004
Table 2. Number of events during calendar years 1998–2002.
Year Number of events Classes 1 and 2
1998 32 1999 30 2000 26 2001 27 2002 32 1998–2002 147
ACPD
4, 3535–3563, 2004Atmospheric particle formation events
H. Vehkam ¨aki et al.
Title Page Abstract Introduction Conclusions References Tables Figures J I J I Back Close
Full Screen / Esc
Print Version Interactive Discussion
© EGU 2004
Table 3. Comparison of local wind direction distribution over 1998–2002 non-event and event days. event non-event degrees % % 0–45 12 10 45–90 19 19 90–135 7 10 135–180 3 9 180–225 12 23 225–270 32 22 270–315 8 4 315–360 8 4
ACPD
4, 3535–3563, 2004Atmospheric particle formation events
H. Vehkam ¨aki et al.
Title Page Abstract Introduction Conclusions References Tables Figures J I J I Back Close
Full Screen / Esc
Print Version Interactive Discussion
© EGU 2004
Jan Feb Mar Apr May Jun Jul Aug Sep Oct Nov Dec
0 5 10 15 20 25 30 35 40 Month Frequency Figure 1 Class 1 Class 2 Classes 1x and 2x Class 1p and 2p
ACPD
4, 3535–3563, 2004Atmospheric particle formation events
H. Vehkam ¨aki et al.
Title Page Abstract Introduction Conclusions References Tables Figures J I J I Back Close
Full Screen / Esc
Print Version Interactive Discussion
© EGU 2004
Jan Feb Mar Apr May Jun Jul Aug Sep Oct Nov Dec
00:00 04:00 08:00 12:00 16:00 20:00 24:00 Month Time Figure 2 Class 1 Class 2 Classes 1x and 2x Class 1p and 2p
Fig. 2. Daily variation of starting times of all events in V ¨arri ¨o 1998–2002. The sunrise and sunset times are marked with red and black solid lines, respectively.
ACPD
4, 3535–3563, 2004Atmospheric particle formation events
H. Vehkam ¨aki et al.
Title Page Abstract Introduction Conclusions References Tables Figures J I J I Back Close
Full Screen / Esc
Print Version Interactive Discussion © EGU 2004
Number of events
classes 1+2
147 (135)morning day night
clean air polluted air clean air polluted air polluted air
Trajectory direction
clean air 6 (7) 117 (124) 12 (16) 4 80 37 11 360 360 360 120 360 120 240 360 120 240 240 120 240 120 240 360 120 240 1 3 13 1 66 2 10 25 9 2 2 2 1 1Fig. 3. Characterization of events by starting time and air mass. Morning stands for the time between midnight and sunrise, evening the time after sunset but before midnight. The air mass was considered polluted if the average concentration of SO2was over 0.35 ppb during the 10 h period surrounding the event starting time. The numbers shown in parentheses are the total number of events including those with no sulphur dioxide data.
ACPD
4, 3535–3563, 2004Atmospheric particle formation events
H. Vehkam ¨aki et al.
Title Page Abstract Introduction Conclusions References Tables Figures J I J I Back Close
Full Screen / Esc
Print Version Interactive Discussion © EGU 2004 0 10 20 30 40 50 60 SO2/ppb
Number of formation events
0.00 0.10 0.35 1.00 3.00 10.00 70.00
Fig. 4. Distribution of days according to the SO2 concentration. The concentration is divided into bins 0–0.1 ppb, 0.1–0.35 ppb, 0.35–1 ppb, 1–3 ppb, 3–10 ppb and 10–70 ppb.
ACPD
4, 3535–3563, 2004Atmospheric particle formation events
H. Vehkam ¨aki et al.
Title Page Abstract Introduction Conclusions References Tables Figures J I J I Back Close
Full Screen / Esc
Print Version Interactive Discussion © EGU 2004 00:00 06:00 12:00 18:00 00:00 −6 −4 −2 0 2 4 6 mean, ∆ T=T−T average, 30days 1998−2002 ∆ T ( oC) Time [hours] NON−EVENTS N=996 EVENTS N=140
Fig. 5. Mean temperature difference compared to the seasonal (sliding 30 day average) tem-perature on event and non-event days, with standard deviation. The legend also shows the number of event and non-event days with reliable data for temperature.
ACPD
4, 3535–3563, 2004Atmospheric particle formation events
H. Vehkam ¨aki et al.
Title Page Abstract Introduction Conclusions References Tables Figures J I J I Back Close
Full Screen / Esc
Print Version Interactive Discussion © EGU 2004 00:00 06:00 12:00 18:00 00:00 45 50 55 60 65 70 75 80 85 90 95 mean 1998−2002 RH (%) Time [hours] NON−EVENTS N=970 EVENTS N=135
Fig. 6. Mean diurnal behaviour of relative humidity on event and non-event days over the whole period 1998–2002. The legend shows the number of days with reliable relative humidity measurement data. Standard deviations are also shown.
ACPD
4, 3535–3563, 2004Atmospheric particle formation events
H. Vehkam ¨aki et al.
Title Page Abstract Introduction Conclusions References Tables Figures J I J I Back Close
Full Screen / Esc
Print Version Interactive Discussion © EGU 2004 00:00 03:00 12:00 18:00 00:00 0 0.1 0.2 0.3 0.4 0.5 0.6 0.7 NOx/ppb Time [hour] median 1998−2002 NON−EVENTS N=936 EVENTS N=123 (a) 00:00 03:00 12:00 18:00 00:00 24 26 28 30 32 34 36 38 40 42 44 O3 /ppb Time [hour] median 1998−2002 NON−EVENTS N=947 EVENTS N=130 (b)
Fig. 7. Median concentrations of (a) NOx and(b) O3 during event and non-event days. The legend shows the number of days with reliable measurement data. 25% and 75% percentiles are also shown.
ACPD
4, 3535–3563, 2004Atmospheric particle formation events
H. Vehkam ¨aki et al.
Title Page Abstract Introduction Conclusions References Tables Figures J I J I Back Close
Full Screen / Esc
Print Version Interactive Discussion © EGU 2004 00:00 03:00 12:00 18:00 00:00 0 100 200 300 400 500 600 global W/m 2 Time [hour] NON−EVENTS N=1021 EVENTS N=140 mean 1998−2002
Fig. 8. Mean global radiation over all seasons for event and non-event days. The legend shows the number of days with reliable measurement data. Standard deviations are also shown.
ACPD
4, 3535–3563, 2004Atmospheric particle formation events
H. Vehkam ¨aki et al.
Title Page Abstract Introduction Conclusions References Tables Figures J I J I Back Close
Full Screen / Esc
Print Version Interactive Discussion
© EGU 2004
Fig. 9. Seasonal variations of growth rate (a) and formation rate (b). Median, maximum, mini-mum, 25% and 75% percentiles are shown for each month. December, January and February are left out due to poor statistics.
ACPD
4, 3535–3563, 2004Atmospheric particle formation events
H. Vehkam ¨aki et al.
Title Page Abstract Introduction Conclusions References Tables Figures J I J I Back Close
Full Screen / Esc
Print Version Interactive Discussion © EGU 2004
Growth rate, nm/h
events, classes 1+2
1 3.6 10 2 4.5 10 1 3.5 10 2 3.9 7 2 5.4 10 2 4.0 7 1 3.4 10 3.0 2 6.2 10 2 2.7 4 2 3.7 8 2 4.1 8 3 4.9 7 2 3.8 6 1.5 2 4.5 10 1 3.3 10 2 3.8 8 clean air polluted air clean air clean air polluted air polluted airmorning day night
Trajectory direction 360 360 360 360 2 2.2 3 2 2.2 3 2.9 2.9 min value aver value max value legend
Fig. 10. Average, minimum and maximum growth rates during events, which occurred at differ-ent times of the day and in differdiffer-ent air masses. Figure 3 shows the number of evdiffer-ents falling into the different classes. Note that there were only a few morning and night time events, especially polluted ones, and the statistical significance of the numbers in these classes in limited.
ACPD
4, 3535–3563, 2004Atmospheric particle formation events
H. Vehkam ¨aki et al.
Title Page Abstract Introduction Conclusions References Tables Figures J I J I Back Close
Full Screen / Esc
Print Version Interactive Discussion © EGU 2004
Formation rate, 1/(cm
3s)
events, classes 1+2
0.0007 0.086 0.5 0.01 0.054 0.2 0.0007 0.088 0.5 0.01 0.080 0.2 0.01 0.055 0.2 0.01 0.081 0.2 0.007 0.083 0.5 0.021 0.01 0.066 0.2 0.05 0.056 0.07 0.0007 0.11 0.5 0.02 0.10 0.3 0.15 0.19 0.22 0.01 0.057 0.1 0.14 0.02 0.099 0.3 0.007 0.079 0.5 0.0007 0.10 0.5 clean air polluted air clean air clean air polluted air polluted airmorning day night
Trajectory direction 360 360 360 360 min value aver value max value legend 0.01 0.053 0.09 0.01 0.053 0.09 0.073 0.073
Fig. 11. Average, minimum and maximum formation rates during events, which occurred at different times of the day and in different air masses. Figure 3 shows the number of events falling into the different classes. Note that there were only a few morning and night time events, especially polluted ones, and the statistical significance of the numbers in these classes is limited.
ACPD
4, 3535–3563, 2004Atmospheric particle formation events
H. Vehkam ¨aki et al.
Title Page Abstract Introduction Conclusions References Tables Figures J I J I Back Close
Full Screen / Esc
Print Version Interactive Discussion © EGU 2004
Condensation sink 10
-4/s
events, classes 1+2
0.6 10 40 0.7 5.9 20 0.6 11 40 2 3.9 7 2 8.6 20 0.9 2.7 5 0.6 7.8 30 3.0 2 11 20 10 18 20 2 17 40 4 14 30 0.9 1.4 2 1 3.0 5 15.5 0.9 10 30 0.6 7.2 30 2 16 40 clean air polluted air clean air clean air polluted air polluted airmorning day night
Trajectory direction 360 360 360 360 0.7 1.1 2 0.7 1.1 2 1.5 1.5 min value aver value max value legend
Fig. 12. Average, minimum and maximum condensation sink calculated from the measured aerosol size distribution during events, which occurred at different times of the day and in different air masses. Figure 3 shows the number of events falling into the different classes. Note that there were only a few morning and night time events, especially polluted ones, and the statistical significance of the numbers in these classes is limited.
ACPD
4, 3535–3563, 2004Atmospheric particle formation events
H. Vehkam ¨aki et al.
Title Page Abstract Introduction Conclusions References Tables Figures J I J I Back Close
Full Screen / Esc
Print Version Interactive Discussion
© EGU 2004
Vapour source rate 10
4/(s cm
3)
events, classes 1+2
0.2 5.4 50 0.3 3.0 8 0.2 5.9 50 0.3 2.2 9 1 4.0 8 0.3 1.3 3 0.2 4.3 50 1.2 3 5.1 8 5 5.8 7 0.5 9.2 20 2 9.1 30 0.3 1.1 2 0.8 1.4 3 3.2 0.2 7.3 20 0.2 3.8 50 0.5 9.0 30 clean air polluted air clean air clean air polluted air polluted airmorning day night
Trajectory direction 360 360 360 360 0.3 0.32 0.4 0.3 0.32 0.4 0.60 0.60 min value aver value max value legend
Fig. 13. Average, minimum and maximum vapour source rates during events, which occurred at different times of the day and in different air masses. Figure 3 shows the number of events falling into the different classes. Note that there were only a few morning and night time events, especially polluted ones, and the statistical significance of the numbers in these classes is limited.