HAL Id: hal-00328381
https://hal.archives-ouvertes.fr/hal-00328381
Submitted on 2 Mar 2005
HAL is a multi-disciplinary open access
archive for the deposit and dissemination of
sci-entific research documents, whether they are
pub-lished or not. The documents may come from
teaching and research institutions in France or
abroad, or from public or private research centers.
L’archive ouverte pluridisciplinaire HAL, est
destinée au dépôt et à la diffusion de documents
scientifiques de niveau recherche, publiés ou non,
émanant des établissements d’enseignement et de
recherche français ou étrangers, des laboratoires
publics ou privés.
2002/2003 compared to other winters
Florence Goutail, Jean-Pierre Pommereau, Franck Lefèvre, M. van
Roozendael, S. B. Andersen, B.-A. Kåstad Høiskar, V. Dorokhov, E. Kyrö, M.
P. Chipperfield, W. Feng
To cite this version:
Florence Goutail, Jean-Pierre Pommereau, Franck Lefèvre, M. van Roozendael, S. B. Andersen, et al..
Early unusual ozone loss during the Arctic winter 2002/2003 compared to other winters. Atmospheric
Chemistry and Physics, European Geosciences Union, 2005, 5 (3), pp.665-677.
�10.5194/acp-5-665-2005�. �hal-00328381�
www.atmos-chem-phys.org/acp/5/665/ SRef-ID: 1680-7324/acp/2005-5-665 European Geosciences Union
Chemistry
and Physics
Early unusual ozone loss during the Arctic winter 2002/2003
compared to other winters
F. Goutail1, J.-P. Pommereau1, F. Lef`evre1, M. Van Roozendael2, S. B. Andersen3, B.-A. K˚astad Høiskar4, V. Dorokhov5, E. Kyr¨o6, M. P. Chipperfield7, and W. Feng7
1Service d’Aeronomie, CNRS, Verri`eres le Buisson, France 2Belgian Institute for Space Aeronomy (BIRA), Brussels, Belgium 3Danish Meteorological Institute, Copenhagen, Denmark
4Institute for Air Research, Kjeller, Norway 5Central Aerological Observatory, Moscow, Russia 6Finnish Meteorological Institute, Sodankyl¨a, Finland
7Institute of Atmospheric Science, School of Earth and Environment, University of Leeds, Leeds, UK Received: 27 May 2004 – Published in Atmos. Chem. Phys. Discuss.: 7 September 2004
Revised: 24 January 2005 – Accepted: 18 February 2005 – Published: 2 March 2005
Abstract. Ozone loss during the winter 2002/2003 has been
evaluated from comparisons between total ozone reported by the SAOZ network and simulated in passive mode by both REPROBUS and SLIMCAT. Despite the fact that the two models have a different approach to calculate the descent in-side vortex, both evaluations provide similar results 18±4% using REPROBUS and 20±4% using SLIMCAT and show that the loss started around mid-December, at least ten to twenty days earlier than during any of the previous eleven winters, except 1993/1994. This unusual behaviour is con-sistent with the low temperatures reported in the stratosphere as well to the signature of early chlorine activation indicated by ground-based, balloon and satellite observations.
A significant ozone loss is also simulated by the current versions of two models, but of lesser amplitude compared to SAOZ, 13±2% for REPROBUS and 16±2% for SLIMCAT, the underestimation being already observed by mid-January. The early ozone depletion captured by both model show that chemical depletion did indeed take place in December, pre-dominantly at the illuminated edge of the distorted vortex, but the reason for the underestimation compared to the ob-servations and the differences among the models have still to be investigated.
Correspondence to: F. Goutail
1 Introduction
Though first signs of stratospheric chemical ozone losses in the Arctic have been reported since 1990 (Hoffman et al., 1989, 1991), the large activity of planetary waves in the northern hemisphere, and thus transport related changes of ozone total column, makes the evaluation of photoccal destruction far more difficult than in the southern hemi-sphere. To overcome the difficulty, several methods for re-moving the contribution of transport have been suggested, described and compared by Harris et al. (2002). Among these is the transport model approach used for deriving the chemical ozone reduction from ground based total ozone measurements consisting in comparing the measurements to 3D model simulations in which ozone is considered as a pas-sive tracer (Goutail et al., 1999).
The amplitude of the ozone loss is very sensitive to strato-spheric temperature history during the winter. The period of ozone destruction and the cumulative loss are thus highly variable from one winter to another. In general, the analyses using the various methods agree to show that strongest ozone losses are occurring during coldest winters while very little or no destruction could be observed during warmest. How-ever the results are less consistent when the loss starts in the early winter in December-January when the sun is low above the horizon. In that case, not only the various methods dis-agree (Tilmnes et al., 2004) casting doubt on the existence of early winter destruction, equally difficult to capture by pho-tochemical models (Goutail et al., 1999).
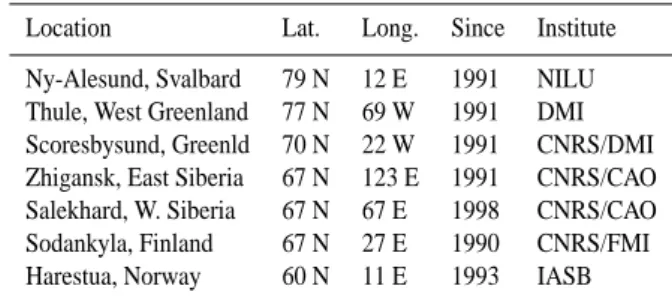
Table 1. Arctic ground-based SAOZ NDSC stations. Location Lat. Long. Since Institute Ny-Alesund, Svalbard 79 N 12 E 1991 NILU Thule, West Greenland 77 N 69 W 1991 DMI Scoresbysund, Greenld 70 N 22 W 1991 CNRS/DMI Zhigansk, East Siberia 67 N 123 E 1991 CNRS/CAO Salekhard, W. Siberia 67 N 67 E 1998 CNRS/CAO Sodankyla, Finland 67 N 27 E 1990 CNRS/FMI Harestua, Norway 60 N 11 E 1993 IASB
This paper deals with the ozone loss of the winter 2002/2003, not of particularly dramatic amplitude, but, at least according to SAOZ evaluation, starting exceptionally in early December. This unique event will be used for checking the ability of models using the most recent photochemical rates of Sander et al. (2003) to capture such low sun loss. The paper is organised as follows. First is a short recall of the SAOZ measurements and the 3-D Chemistry-Transport Models (CTM) used. The average ozone loss which could be determined by the technique for the winter 2002/2003 is detailed in Sect. 3. Section 4 provides a summary of rel-evant PSC (Polar stratospheric Clouds), chlorine activation and ozone loss reports for the same winter supporting those findings. In Sect. 5, the 2002/2003 loss will be compared to that observed during previous years since 1993, showing how exceptional could be the case of 2002/2003. Finally, the ability of the REPROBUS and SLIMCAT 3D CTM models to capture the early ozone destruction of 2002/2003 is inves-tigated and discussed in Sect. 6.
2 Measurements and models
The data used here are total ozone columns measured at seven Arctic stations equipped with SAOZ UV-visible spec-trometers (Pommereau and Goutail, 1988) part of the Net-work for the Detection of Stratospheric Changes (NDSC), plus those of a similar spectrometer but of different design operated at Harestua in Southern Norway (Van Roozendael et al., 1995). The location of the stations, the date of installa-tion and the institutes running the instruments are displayed in Table 1. Among those spectrometers, those located at or southward of the Polar Circle are providing data through-out the whole winter, Scoresbysund at 70◦N starts observ-ing only in mid-January, and Thule and Ny-Alesund around 78◦N only after mid-February.
Ozone slant columns are measured every morning and evening between 86◦and 91◦solar zenith angle (SZA) in the visible Chappuis bands where the absorption cross-sections are well known (1% uncertainty) and insensitive to temper-ature (<1%). Total ozone is retrieved from slant column densities using a constant Air Mass Factor (AMF)
calcu-lated for a typical winter ozone profile in the vortex mea-sured by the balloon-borne version of the SAOZ instrument from Kiruna in Sweden in 2000. The AMF at 90◦ SZA is
16.5. According to Sarkissian et al. (1995), AMF fluctua-tions related to changes in ozone profile shape are smaller than 3%. As demonstrated by several intercomparison cam-paigns (Vaughan et al., 1997; Roscoe et al., 1999), the measurements of different SAOZ instruments are consistent within ±3% (about 15 DU). The presence of dense high alti-tude type II PSCs, which lead to an underestimation of total ozone in the zenith sky measurements because of the lifting of the scattering layer, is detected by a colour index method (Sarkissian et al., 1991). The corresponding ozone data are removed.
The cumulative ozone loss throughout the season is de-rived following the method described by Goutail et al. (1999) consisting in calculating the difference between total ozone observed and simulated by a CTM (Chemical Transport Model) run in passive mode, that is ignoring chemistry. The models runs are initialised at the beginning of the winter using the ozone distribution provided by ECMWF (Euro-pean Centre for Medium-Range Weather Forecasts). “Pas-sive ozone” columns are then extracted in coincidence with each SAOZ observation during the course of the winter. The difference between observed and modelled passive ozone columns thus provides an estimate of the photochemical loss. Two 3-D CTM models have been used in this analysis: REPROBUS (Lef`evre et al., 1994, 1998) and SLIMCAT (Chipperfield, 1999).
REPROBUS calculations are performed on 42 levels extending from the ground up to 0.1 hPa (about 65 km) with a 2×2 degrees horizontal resolution (approximately 220 km×90 km at the polar circle) forced by the 6 hourly ECMWF analyses. The vertical transport is derived from ECMWF vertical winds. For the 2002/2003 simulations, the O3field was initialised from the ECMWF three-dimensional O3analysis on 1 December 2002.
SLIMCAT simulations are performed with a recent ver-sion in which ozone fields are extended down to the tropo-sphere on hybrid σ −θ coordinate (Feng et al., 2005). The model is forced by ECMWF analyses (instead of UKMO – United Kingdom Met. Office – previously) and has a hori-zontal resolution of 2.8◦×2.8◦with 24 levels from the sur-face to ∼55 km. A noticeable difference with REPROBUS is the calculation of vertical advection. SLIMCAT calculates heating rates with a radiation scheme computing solar radia-tion including code based on NCAR CCM (Briegleb, 1992), whereas REPROBUS uses vertical velocities calculated by ECMWF. As for REPROBUS, the O3field was initialised on 1 December 2002.
The present study is limited to the polar stratospheric vor-tex. The selection of the data is based on potential vorticity (PV) fields calculated at 475 K by the Danish Meteorologi-cal Institute from ECMWF analyses. The boundary of the vortex is defined by the maximum PV gradient following the
1 60 50 40 30 20 PV (10 -6 Km 2/kgs ) 600 500 400 300 200 Ozone ( DU ) REPROBUS 600 500 400 300 200 Ozone ( DU )
JAN FEB MAR APR
DEC
SLIMCAT
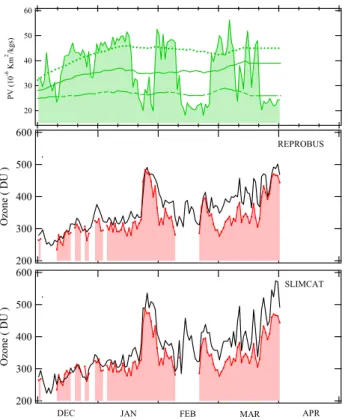
Fig. 1. Upper panel: Potential vorticity at 475K (green shaded area) and vortex boundary (poleward: dotted line, edge: solid line, equa-torward: dashed line). Middle panel: Measured total ozone (pink shaded area) and passive ozone simulated by the REPROBUS CTM (solid black line) from 1 December 2002 until 1 April 2003 above Sodankyla in Northern Finland. Bottom panel: same but for SLIM-CAT. Some data are missing for various technical reasons or re-moved because of the presence of PSC particularly in early Decem-ber.
procedure suggested by Nash et al. (1996). This procedure provides three limits: an “equatorward boundary”, a “vor-tex edge”, and a “poleward boundary”. A serie of tests has shown that the best choice is the use of the vortex edge. In-deed, the use of the poleward boundary instead eliminates the measurements at the edge of the vortex, the only vortex region illuminated near the winter solstice where ozone loss occurs more frequently. While a larger selection by using the equatorward limit introduces a larger noise in the results likely due to some out vortex observations at levels other than 475 K when the vortex is tilted. In the following, the selec-tion criteria is thus the vortex edge at 475 K (approx. 17 km), the altitude of the maximum of ozone concentration and thus of the maximum contribution to the column. The broad geo-graphical distribution of the SAOZ stations allows having in general one or more of them located in the vortex on a given day. 1 220 210 200 190 180 T em perat ur e (K ) 550 K 475 K 435 K TNAT -40 -30 -20 -10 0 10 Ozone l os s (% ) Zhigansk Sodankyla Thule Salekhard Ny Alesund Scoresbysund Harestua 20% + 4% REPROBUS -40 -30 -20 -10 0 10 Ozone l os s (% ) JAN FEB Zhigansk Sodankyla Thule Salekhard Ny Alesund Scoresbysund Harestua
DEC MAR APR
18% + 4% SLIMCAT
Fig. 2. Top panel: ECMWF minimum temperature in the Arctic at 550 K, 475 K and 435 K and limits of TN AT formation. Middle panel: total ozone reduction inside the vortex at the SAOZ Arctic stations (symbols) using REPROBUS passive ozone, 10-day aver-age (solid line) and standard deviation (error bars) from 1 December 2002 until end of March 2003. Bottom: same using SLIMCAT.
3 Ozone loss above SAOZ stations in 2002/2003
Figure 1 shows the evolution of the ozone column and the location of the vortex at Sodankyla in Northern Finland be-tween 1 December 2002 and 31 March 2003. The middle panel displays the SAOZ ozone column (pink shaded area) and the passive ozone column simulated by REPROBUS (solid black line) and the lower panel, the same for SLIM-CAT. In addition, the upper panel displays PV at 475 K above the station (green shaded area) and in dotted, solid and dashed lines the PV at the three boundaries of the vor-tex, poleward, edge and equatorward respectively. The two models capture well the short-term ozone fluctuations related to the reversible vertical motions of the tropopause follow-ing the propagation of planetary waves. Transitions between the inside and the outside of the vortex could also be clearly seen, especially during the second half of January when the vortex moved away from the station and high ozone columns are reported. A significant difference progressively builds up between SAOZ and modelled passive ozone indicative
1 300 250 200 150 100 50 0 OClO (DS C D x 10 12 m ol/ cm 2)
JAN FEB MAR APR
DEC 60 50 40 30 20 PV (10 -6 Km 2/kgs )
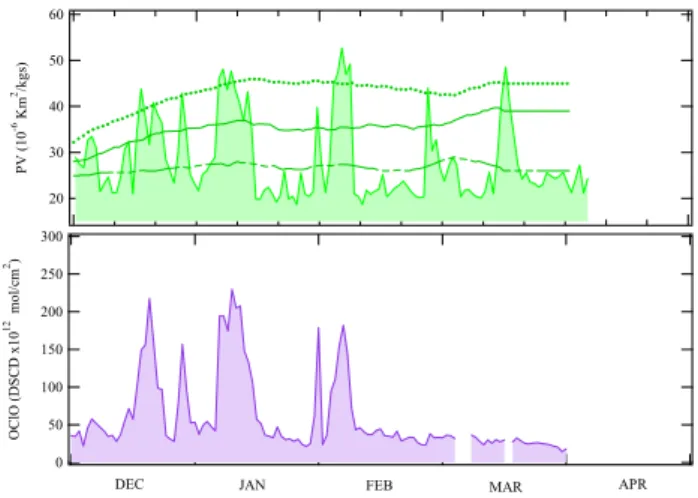
Fig. 3. Top panel: PV at 475 K and limit of vortex (as on Fig. 1). Bottom panel: Time series of OClO Differential Slant Columns (91–80◦SZA) at Harestua in Southern Norway from 1 December 2002 until end of March 2003.
of a chemical reduction. By mid-March, before the end of the simulation, the difference in the vortex with both REPROBUS and SLIMCAT reaches 90 Dobson Units (DU), about 20%. However, a noticeable difference appears be-tween the two models outside the vortex. In contrast to the inside where the columns are very similar, SLIMCAT ampli-fies the ozone outside the vortex compared to REPROBUS and SAOZ as well. Such difference may be related to the different methods used by both models to calculate the ver-tical transport (ECMWF verver-tical winds or computed heating rates).
Similar observations are reported at the other stations (not shown) though the total ozone and hence the absolute loss expressed in DU can vary from one station to another be-cause of the change of tropopause height. In the following, the loss at the various stations is thus compared in relative and not absolute units.
The relative percent ozone reduction in the vortex at the seven stations combined altogether is shown in Fig. 2 in the middle panel for REPROBUS and in the lower one for SLIM-CAT. Also displayed in the plots are 10-day running means with error bars representing standard deviations. The up-per panel shows the minimum ECMWF temup-perature north of 30◦N at three levels (435, 475 and 550 K) and the tem-peratures of NAT (Nitric Acid Trihydrate) PSC formation at each level.
At 550 K, the temperature was well below TN AT at 192 K
from mid-November until mid-January, while at lower levels the period of T<TN AT (195 K at 475 K and 196 K at 435 K)
started later in early December. By mid-January, three minor stratospheric warming could be observed during which the temperature increased, the first around 15 January lasting for 20 days, the second around 10 February for 15 days and the last around 5 March for 10 days. The final warming occurred around 20 March.
The cumulative ozone losses derived using the two mod-els are very similar. On average, the standard deviation of all measurements within a 10-day period is 4% on both evalu-ations. A number of processes could contribute: i) inhomo-geneities of the ozone loss in the vortex; ii) systematic dif-ferences between SAOZ instruments (<3%); iii) AMF fluc-tuations because profile shapes differences (<3%); iv) small mismatches between the location of measurements and the simulations when the ozone is varying fast, v) presence of thin PSC resulting in a drop of ozone not totally removed by the colour index procedure; vi) small shifts in the location of the ECMWF vortex edge compared to the real atmosphere; and vii) out vortex ozone at altitude above 475K, the selec-tion level, because of the smaller size of the vortex.
Consistent with the presence of PSCs, the loss started very early during the second half of December at an aver-age rate of 0.4±0.2% per day, reaching 6–8% by the end of the month and about 10% by 10 January. The process then stopped for a 10-day period when the stratosphere warmed, to restart between 20–31 January, at a rate of 0.4±0.2% per day. This was followed by twenty days of stabilisation (SAOZ/REPROBUS) or of slow decrease at 0.1% per day (SAOZ/SLIMCAT). At last, a third period of destruction at 0.4±0.2% per day could be observed between 20 February and 10 March in coincidence with a further cooling of the stratosphere. The cumulative loss at the end of the win-ter reached 20±4% or ∼94±20 DU (SAOZ/REPROBUS) or 18±4% or ∼86±23 DU (SAOZ/SLIMCAT). Half of it oc-curred before mid-January.
4 Other reports
Several authors have been reporting early PSCs, chlorine ac-tivation and ozone loss in December 2002. The presence of PSCs could be detected as early as 3 and 7 December over Northern Sweden by balloon-borne instruments (Larsen et al., 2004). A very early chlorine activation and ozone loss has been reported by Tilmes et al. (2003) from the analysis of the HALOE (Halogen Experiment on UARS) data using the TRAC (ozone-tracer correlation) method, confirmed by the very low HCl mixing ratio measured at 520 K in the vortex by the MkIV balloon instrument flown over Northern Sweden on 16 December. The occurrence of early chlorine activation is also supported by the measurements of the ODIN Sub-Millimeter Radiometer (SMR) satellite instrument show-ing night-time ClO amounts of about 0.3–0.6 ppbv between 450 K and 525 K on 9–10 December (Urban et al., 2004), im-plying daytime amounts of the order of 1 ppbv. The event is also confirmed by the presence of high OClO levels observed in December by the UV-Visible spectrometer at Harestua in Southern Norway (Fig. 3) when the vortex was passing above the station and by the ERS-2/GOME (Global Ozone Mon-itoring Experiment on board ERS-2 satellite) observations displaying an unusual high activation in December (http://
www.iup.physik.uni-bremen.de/gomenrt2003/) compared to the previous winters (Wagner et al., 2001, 2002; WMO as-sessment, 2003).
Finally, according to Tilmes et al. (2003) on 19–26 Jan-uary (first HALOE available profiles inside vortex during that winter), an average partial column ozone reduction of 23±9 DU (about 10%) would have occurred between 380 and 550 K in the outer Vortex with a maximum value reach-ing 33±8 DU (about 13%).
The early ozone loss observed by the SAOZ network in late December and early January is thus very consistent with the presence of PSCs, chlorine activation, and ozone loss re-ported by other authors.
5 Comparison to other winters
The cumulative ozone loss of the winter 2002/2003 is com-pared in Fig. 4 to that reported during all other winters be-tween 1993/1994 and 2003/2004 by comparison bebe-tween SAOZ and REPROBUS, though a possible bias could exist because of a change in the model in 1999. Indeed by that date, ECMWF with which REPROBUS is forced, moved from 31 vertical levels extending up to 10 hPa to 60 levels up to 0.1 hPa. Figure 4 also displays the minimum ECMWF temperature north of 30◦N at 550 and 475 K.
The 20% loss reported during the winter 2002/2003 is among the average amplitude of the cold winter reductions observed during the decade, after that of the two extremely long lasting winters of 1994/1995 and 1995/1996 (Goutail et al., 1998, 1999, 2000; Harris et al., 2002). But it is the year with 1993/1994 when the ozone depletion has started the ear-liest in the series, in coincidence with the coldest December average stratospheric temperature. The question is to know how well such early winter ozone losses could be captured by photochemical models.
6 Photochemical model simulations of 2002/2003
The two models, REPROBUS and SLIMCAT, have been run with their full current chemical package to examine how much of the observed loss could be captured. However, be-fore that, their chemical characteristics will be briefly sum-marised.
6.1 REPROBUS
The chemical rate constants and absorption cross-sections are those recommended by the latest JPL compilation (Sander et al., 2003). The total chlorine is set to 3.6 ppb, while the total bromine is 20 ppt. Cl2O2cross-sections are those given in the recommendation. They are not extrapo-lated to longer wavelengths. PSCs are assumed to be in ther-modynamic equilibrium. The composition of liquid aerosols
1 200 190 180 93/94 200 190 180 94/95 200 190 180 95/96 200 190 180 96/97 200 190 180 97/98 200 190 180 98/99 200 190 180 00/01 200 190 180 99/00 -40 -20 0 10% 00/01 -40 -20 0 98/99 5% -40 -20 0 99/00 23% -40 -20 0 97/98 20% -40 -20 0 96/97 22% -40 -20 0 95/96 30% -40 -20 0 94/95 31% -40 -20 0 93/94 17%
Minimum Temperature (K) Ozone Reduction (%)
-40 -20 0 01/02 10% -40 -20 0 02/03 20% 200 190 180 02/03 -40 -20 0 03/04 17%
Dec Jan Feb Mar Apr 200
190 180
03/04
Dec Jan Feb Mar Apr 200
190 180
01/02
Fig. 4. Left: minimum ECMWF temperature at 475 K (red) and 550 K (blue) north of 30◦N and limits for NAT PSC formation. Right: Total ozone reduction in the vortex since 1993/1994 from the measurements of the SAOZ stations by comparison to REPROBUS (shaded pink).
is calculated analytically as a function of temperature, pres-sure, and the gas phase amounts of H2O and HNO3. Ice is assumed to incorporate NAT as a co-condensate, removing nitric acid from the vapour phase.
REPROBUS was initialised on 1 July 2002 using a June zonal climatology from a 5-year run coupled to the ARPEGE general circulation model (see WMO 1998 assessment, Chapter 12). The sulphate aerosol content is derived from SAGE-II measurements. The ozone field is reinitialised from the ECMWF ozone analysis on 1 December 2002.
6.2 SLIMCAT
As already said above, SLIMCAT has been recently mod-ified to use a hybrid σ −θ coordinate and has been ex-tended down to the surface: this is the version used in this study. The SLIMCAT gas-phase and heterogeneous chem-istry modules, including liquid aerosols, NAT and ice parti-cles, are described in Chipperfield (1999). The total chlo-rine is set to 3.7 ppb, while the total bromine is 21 ppt. The
1 -40 -30 -20 -10 0 10 Oz on e loss ( % ) Zhigansk Sodankyla Salekhard ScoresbySund Thule Ny Alesund Harestua 13% + 2% REPROBUS -40 -30 -20 -10 0 10 Ozone l os s (% ) Zhigansk Sodankyla Salekhard ScoresbySund Thule Ny Alesund Harestua
JAN FEB MAR APR
16% + 2%
DEC
SLIMCAT
Fig. 5. REPROBUS (top panel) and SLIMCAT (bottom panel) sim-ulated ozone loss in the vortex at the SAOZ Arctic stations (sym-bols), 10-day average (solid line) and standard deviation (error bars) from 1 December 2002 until end of March 2003.
ClO+ClO rate from Sander et al. (2003) has been used. All model photochemical data were taken from this except for the absorption cross sections of Cl2O2. For this, the data of Burkholder et al. (1990) extended to 450 nm by extrapola-tion have been used. PSCs are assumed to be in thermody-namic equilibrium, with no modification of the model tem-perature to account for supersaturation. The composition of liquid aerosols (containing HNO3, H2SO4, H2O and HCl) is calculated analytically. NAT is formed at the equilibrium NAT saturation temperature and the presence of ice is tested using the saturation vapour pressure of water over ice. Ice is assumed to incorporate NAT as a co-condensate, removing nitric acid from the vapour phase. A simple NAT-based den-itrification scheme is used (see Davies et al., 2001; Feng et al., 2005).
SLIMCAT was initialized on 1 December 2002 from an ECMWF-forced multi-annual run which started in 1989.
7 Modelled loss
The ozone loss of the winter 2002/2003 above the SAOZ stations has been simulated by REPROBUS and SLIMCAT. For better consistency with observations, only simulations corresponding to existing measurements (SZA<91◦at noon)
are considered. Figure 5 shows the results of the simula-tions. Both models indicate a significant ozone reduction, but of smaller amplitude in REPROBUS. That of SLIM-CAT (16±2%) is comparable to the loss derived by the comparison of its passive run to SAOZ (18±4%). In con-trast, that of REPROBUS is significantly reduced (13±2% instead of 20±4%). Although both indicate an ozone
de-struction starting in December, the main difference between them comes from its amplitude until mid-January, of 9% for SLIMCAT (similar to that derived from SAOZ) and only 5% for REPROBUS (half of that derived from SAOZ). Since the transport is identical in the passive and full chemistry runs, the difference must come from the chemistry.
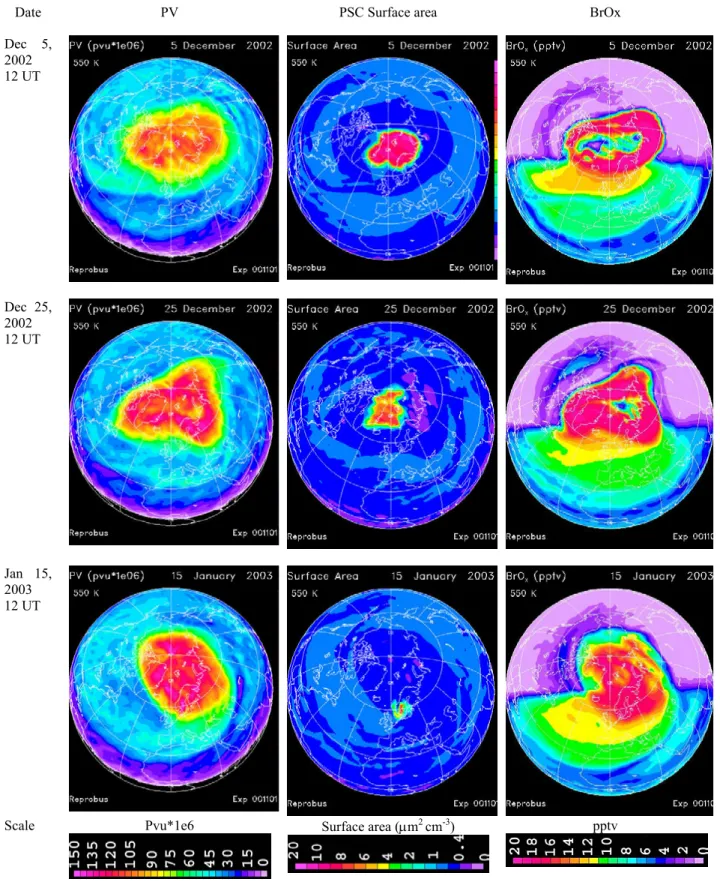
Figures 6 and 7 provide more insight on the development of the REPROBUS ozone loss respectively at 550 K and 475 K from 5 December to 15 January. At the upper level, 550 K, the vortex is well formed at the beginning of the pe-riod, with a large PSC surface area diagnosed on the Euro-pean side. A substantial chlorine and bromine activation is calculated at the edge of the vortex, extending over the whole vortex by 25 December. A very similar evolution though a little delayed could be observed lower down at 475 K. Ab-sent on 5 December, a significant ozone loss is calculated on 25 December at the edge of the vortex. The loss is more abundant at 475 K where the illuminated portion of the polar vortex is larger than at 550 K. The amplitude of the reduction further increases (10% at 550 K, 8% at 475 K) on 15 January when the surface of the vortex enlarges again and its edge moves to sunlit latitudes over Eastern Europe and Siberia.
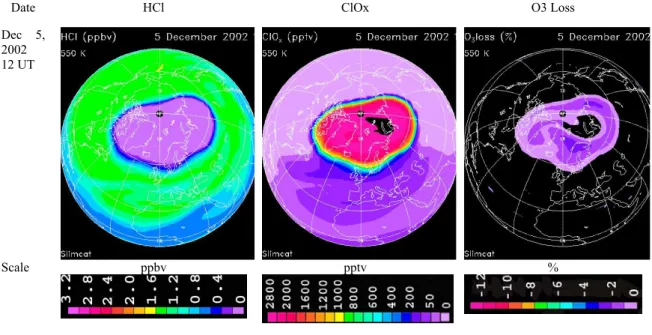
Figures 8 and 9 provide similar plots of HCl, ClOxand O3 loss for SLIMCAT on 5 December. Chlorine species are ac-tivated at the beginning of December not only at 550 K but also at 475 K. It is obvious from the HCl and ClOx distri-bution that SLIMCAT infers more chlorine activation than REPROBUS on 5 December, and thus more ozone loss.
Although both models show an activation of chlorine in early December, the magnitude of this activation is quan-titatively different. The reason for the difference is diffi-cult to identify precisely. The models did their own exper-iment, which were aimed to be realistic, but many details were different. Besides the vertical transport approach, there are also differences in the chemistry. Recent changes made to SLIMCAT to increase polar O3loss such as Cl2O2cross sections from Burkholder et al. (1990) has been tested by REPROBUS. This gives an additional loss of only 0.5% by mid-January. REPROBUS ignores the formation of NAT in the simulation presented here (STS/Ice only). A test has been performed to consider NAT but the additional loss was neg-ligible, less than 0.03% by mid-January.
In conclusion, both models are capturing an ozone loss during the winter 2002/2003, but of lesser amplitude for REPROBUS (13%) than for SLIMCAT (16%). The 3% dif-ference between the models lies in December and is already observed on 5 December 2002. The Cly and Bry initiali-sations being very similar, the temperature being identical (ECMWF), the difference between model may be due i) to the PSC formation scheme, as suggested by the different ac-tivation rate in early December or ii) to the vertical transport which can provide more or less descent and thus a different redistribution of chlorine and bromine species inside the vor-tex. These hypotheses could not be solved in the frame of this paper but will be investigated further in the future.
1
Date PV PSC Surface area BrOx Dec 5, 2002 12 UT Dec 25, 2002 12 UT Jan 15, 2003 12 UTScale Pvu*1e6 Surface area (µm2
cm-3) pptv
Fig. 6a. Vortex, PSC surface area and BrOxfrom REPROBUS at 550 K. Top panel: 5 December 2002. Middle panel: 25 December 2002.
Bottom panel: 15 January 2003.
Date HCl ClOx O3 Loss Dec 5, 2002 12 UT Dec 25, 2002 12 UT Jan 15, 2003 12 UT Scale ppbv pptv %
Fig. 6b. HCl, ClOx, and O3loss from REPROBUS at 550 K. Top panel: 5 December 2002. Middle panel: 25 December 2002. Bottom
panel: 15 January 2003.
1
Date PV PSC Surface area BrOx
Dec 5, 2002 12 UT Dec 25, 2002 12 UT Jan 15, 2003 12 UT
Scale Pvu*1e6 Surface area (µm2 cm-3) Pptv
Fig. 7a. Vortex, PSC surface area and BrOxfrom REPROBUS at 475 K. Top panel: 5 December 2002. Middle panel: 25 December 2002.
Bottom panel: 15 January 2003.
Date HCl ClOx O3 Loss Dec 5, 2002 12 UT Dec 25, 2002 12 UT Jan 15, 2003 12 UT Scale ppbv pptv %
Fig. 7b. HCl, ClOx, and O3loss from REPROBUS at 475 K. Top panel: 5 December 2002. Middle panel: 25 December 2002. Bottom
panel: 15 January 2003.
1
Date HCl ClOx O3 Loss
Dec 5, 2002 12 UT
Scale ppbv pptv %
Fig. 8. HCl, ClOx, and O3loss from SLIMCAT at 550 K on 5 December 2002.
1
Date HCl ClOx O3 Loss
Dec 5, 2002 12 UT
Scale pptv pptv %
Fig. 9. HCl, ClOx, and O3loss from SLIMCAT at 475 K on 5 December 2002.
Acknowledgements. The authors thank the SAOZ stations
opera-tors, ECMWF for the meteorological data and E. Nash for vortex limits. This work was supported by the Centre National d’Etudes Spatiales (CNES), Services d’Observations de l’IPSL, the Pro-gramme National de Chimie de l’Atmosphere (PNCA) in France and the EC Environmental projects (SCUVS, SCUVS-III, SRS, TOPOZ III, THESEO /O3Loss, THESEO 2000 /EUROSOLVE, ENV-2001-QUILT). The SAOZ stations are part of the NDSC (Network for Detection of Stratospheric Changes).
Edited by: K. Carslaw
References
Briegleb, B. P.: Delta-Eddington Approximation for Solar Radia-tion in the, NCAR Community Climate Model, J. Geophys. Res., 97, 7603–7612, 1992.
Burkholder J. B., Orlando, J. J., and Howard, C. J.: Ultraviolet-absorption cross-sections of Cl2O2 between 210 and 410nm, J. Phys. Chem., 94, 687–695, 1990.
Chipperfield, M. P., Lee, A. M., and Pyle, J. A.: Model calcula-tions of ozone depletion in the Arctic polar vortex for 1991/92 to 1994/95, Geophys. Res. Lett., 5, 559–562, 1996.
Chipperfield, M. P. and Pyle, J. A.: Model sensitivity studies of Arctic ozone depletion, J. Geophys. Res., 103, 28 389–28 403, 1998.
Chipperfield, M. P.: Multiannual simulations with a Three-Dimensional Chemical Transport Model, J. Geophys. Res., 104, 1781–1805, 1999.
Davies, S., Chipperfield, M. P., Carslaw, K. S. , Sinnhuber, B.-M., Anderson, J. G., Stimpfle, R., Wilmouth, D., Fahey, D. W., Popp, P. J., Richard, E. C., von der Gathen, P., Jost, H., and Webster, C. R.: Modelling the Effect of Denitrification on Arctic Ozone De-pletion During Winter 1999/2000, J. Geophys. Res., 107, 8322, doi:10.1029/2001JD000445, 2002. [printed 108(D5), 2003] Feng, W., Chipperfield, M. P., Davies, S., Sen, B., Toon, G., Blavier,
J. F., Webster, C. R., Volk, C. M., Ulanovsky, A., Ravegnani, F., von der Gathen, P., Jost, H., Richard, E. C., and Claude, H.: Three dimensional model study of the Arctic ozone loss in 2002/2003 and comparison with 1999/2000 and 2003/2004, At-mos. Chem. Phys., 5, 139–152, 2005,
SRef-ID: 1680-7324/acp/2005-5-139.
Goutail, F., Pommereau, J-P., Kyro, E., Rummukainen, M., Er-icksen, P., Andersen, S., Kaastad-Hoiskar, B-A., Braathen, G.O., Dorokhov, V., Khattatov, V., van Roozendael, M., and de Maziere, M.: Total ozone reduction in the Arctic vortex during the winters of 1995/96 and 1996/97, Proc. 4th European Sympo-sium on Polar Ozone, EC Air Pollution Research Report No. 66, edited by: Harris, N. R. P., Kilbane-Dawe, I., and Amanatidis, G. T., European Commission, 277–280, 1998.
Goutail, F., Pommereau, J-P., Phillips, C. Deniel, C., Sarkissian, A., Lef`evre, F., Kyro, E., Rummukainen, M., Ericksen, P., Ander-sen, S., Kaastad-Hoiskar, B.-A., Braathen, G., Dorokhov, V., and Khattatov, V.: Depletion of Column Ozone in the Arctic during the Winters 1993–94 and 1994–95, J. Atmos. Chem., 32, 1–34, 1999.
Goutail, F., Pommereau, J.-P., and Lef`evre, F.: Winter ozone loss in the Arctic and at mid-latitudes in 1998 and 1999 from the saoz ground-based network and balloon measurements, in: Proc. 5th Europ. Symp., EU Air Pollution Res. Rep. 73, Saint Jean de Luz (France), 1999, edited by: Harris, N. R. P., Guirlet, M., and Ama-natidis, G. T., 433–436, 2000.
Harris, N. P. R., Rex, M., Goutail, F., Knudsen, B. M., Manney, G. L., M¨uller, R., and von der Gathen, P.: Comparison of Empir-ically Derived Ozone Losses in the Arctic Vortex, J. Geophys. Res., 107(D20), doi:10.1029/2001JD000482, 2002.
Hofmann, D. J., Deshler, T. L., Aimedieu, P., Matthews, W. A., Johnston, P. V., Kondo, Y., Sheldon, W. R., Byrne, G. J., and Benbrook, J. R.: Stratospheric clouds and ozone depletion in the arctic during January 1989, Nature, 340, 117–121, 1989. Hofmann D. J. and Deshler, T.: Evidence from balloon
measure-ments for chemical depletion of stratospheric ozone in the Arctic winter of 1989–90, Nature, 349, 300–305, 1991.
Larsen, N., Knudsen, B. M., Svendsen, S. H., Deshler, T., Rosen, J. M., Kivi, R., Weisser, C., Schreiner, J., Mauerberger, K., Cairo, F., Ovarlez, J., Oelhaf, H., and Spang, R.: Formation of solid par-ticles in synoptic-scale Arctic PSCs in early winter 2002/2003, Atmos. Chem. Phys., 4, 2001–2013, 2004,
SRef-ID: 1680-7324/acp/2004-4-2001.
Lef`evre, F., Brasseur, G. P., Folkins, I., Smith, A. K., and Simon, P.: Chemistry of the 1991–92 stratospheric winter: three di-mensional model simulations, J. Geophys. Res., 99, 8183–8195,
1994.
Lef`evre, F., Figarol, F., Carslaw, K. S., and Peter, T.: The 1997 Arctic ozone depletion quantified from three dimensional model simulations, Geophys. Res. Lett., 25, 2425–2428, 1998. Nash, E. R., Newman, P. A., Rosenfield, J. E., and Schoeberl, M.
R.: An objective determination of the polar vortex using Ertel’s potential vorticity, J. Geophys. Res., 101, 9471–9478, 1996. Pommereau, J. P. and Goutail, F.: O3 and NO2 Ground-Based
Measurements by Visible Spectrometry during Arctic Winter and Spring 1988, Geophys. Res. Lett., 891–894, 1988.
Roscoe, H. K, Johnston, P. V., Van Roozendael, M., Richter, A., Pre-ston, K., Lambert, J. C., Hermans, C., de Kuyper, W., Dzenius, S., Winterath, T., Burrows, J., Sarkissian, A., Goutail, F., Pom-mereau, J. P., d’Almeida, E., Hottier, J., Coureul, C., Ramond, D., Pundt, I., Bartlet, L. M., Kerr, J. E., Elokhov, A., Giovanelli, G., Ravegnani, F., Premudan, M., Kostadinov, M., Erle, F., Wag-ner, T., Pfeilsticker, K., KenntWag-ner, M., Marquand, L. C., Gil, M., Puentedura, O., Arlander, W., Kaastad-Hoiskar, B. A., Tellefsen, C. W., Heese, C. W., Jones, R. L., Aliwell, S. R., and Freshwater, R. A.: Slant column measurements of O3and NO2during the
NDSC intercomparison of zenith-sky UV-visible spectrometers in June 1996, J. Atmos. Chem., 32, 281–314, 1999.
Sander, S. P., Friedl, R. R., Ravishankara, A. R., et al.: Chemical kinetics and photochemical data for use in atmospheric studies, Evaluation no. 14, JPL Publ., 02–25, 2003.
Sarkissian, A., Pommereau, J. P., and Goutail, F.: Identification of polar stratospheric clouds from the ground by visible spectrome-try, Geophys. Res. Lett., 18, 779–782, 1991.
Sarkissian, A., Roscoe, H. K., Fish, D., Van Roozendael, M., Gil, M., Chen, H. B., Wang, P., Pommereau, J. P., and Lenoble, J.: Ozone and NO2 AMF for zenith sky spectrometer: Intercom-parison of calculations with different radiative transfert model, Geophys. Res. Lett., 22, 1113–1116, 1995.
Tilmes, S., M¨uller, R., Grooß, J.-U., H¨opfner, M., Toon, G. C., and Russell, J.: Very early chlorine activation and ozone loss in the Arctic winter 2002–2003, Geophys. Res. Lett., 30, 2200, doi:10.1029/2003GL018 792, 2003.
Tilmes, S., M¨uller, R., Grooß, J.-U., and Russell III, J. M.: Ozone loss and chlorine activation in the Arctic winters 1991–2003 de-rived with the tracer-tracer correlations, Atmos. Chem. Phys., 4, 2181–2213, 2004,
SRef-ID: 1680-7324/acp/2004-4-2181.
Urban, J., Lauti`e, N., Le Flochmo¨en, E., Murtagh, D., Ricaud, P., De La No¨e, J., Dupuy, E., Drouin, A., El Amraoui, L., Eriks-son, P., Frisk, U., Jim´enez, C., Kyr¨ol¨a, E., Llewellyn, E. J., M´egie, G., Nordh, L., and Olberg, M.: The northern hemi-sphere stratospheric vortex during the 2002/03 winter: Subsi-dence, chlorine activation and ozone loss observed by the Odin Sub-Millimetre Radiometer, Geophys. Res. Lett., 31, 7, L07103 doi:10.1029/2003GL019089, 2004.
Van Roozendael, M., Hermans, C., Kabbadj, Y., Lambert, J.-C., Vandaele, A.-C., Simon, P. C., Carleer, M., Guilmot, J.-M., and Colin, R.: Ground-based measurements of stratospheric OClO, NO2 and O3 at Harestua, Norway (60◦N, 10◦E)
dur-ing SESAME, Proceeddur-ings 12th ESA Symposium on Rocket and Balloon Programmes & Related Research, Lillehammer, Nor-way, ESA SP-370, 305–310, 1995.
Vaughan, G., Roscoe, H. K, Bartlett, L. M., O’Connor, F.M., Sarkissian, A., Van Roozendael, M., Lambert, J.-C., Simon, P.
C., Karlsen, K., Kaastad Hoiskar, B. A., Fish, D. J., Jones, R., Freshwater, L. R., Pommereau, J.-P., Goutail, F., Andersen, S. B., Drew, D. G., Hughes, P. A., Moore, D., Mellqvist, J., Hegels, E., Klupfel, T., Erle, F., Pfeilsticker, K., and Platt, U.: An in-tercomparison of groundbased UV visible sensors of Ozone and NO2, J. Geophys. Res., 102, 1411–1422, 1997.
Wagner, T., Leue, C., Pfeilsticker, K., and Platt, U.: Monitoring of the stratospheric chlorine activation by Global Ozone Monitor-ing Experiment (GOME) OClO measurements in the austral and boreal winters 1995 through 1999, J. Geophys. Res., 106(D5), 4971–4986, doi:10.1029/2000JD900458, 2001.
Wagner, T., Wittrock, F., Richter, A., Wenig, M., Burrows, J. P., and Platt, U.: Continuous monitoring of the high and persistent chlorine activation during the Arctic winter 1999/2000 by the GOME instrument on ERS2, J. Geophys. Res., 107(D20), 8267, doi:10/1029/2001JD00466, 2002.
WMO (World Meteorological Organization), Scientific Assessment of Ozone Depletion: 1998, Global Ozone Research and Monitor-ing Project – Report no. 44, Geneva, 1999.
WMO (World Meteorological Organization), Scientific Assessment of Ozone Depletion: 2002, Global Ozone Research and Monitor-ing Project – Report no. 47, Geneva, 2003.