HAL Id: hal-00318355
https://hal.archives-ouvertes.fr/hal-00318355
Submitted on 30 Jul 2007
HAL is a multi-disciplinary open access
archive for the deposit and dissemination of
sci-entific research documents, whether they are
pub-lished or not. The documents may come from
teaching and research institutions in France or
abroad, or from public or private research centers.
L’archive ouverte pluridisciplinaire HAL, est
destinée au dépôt et à la diffusion de documents
scientifiques de niveau recherche, publiés ou non,
émanant des établissements d’enseignement et de
recherche français ou étrangers, des laboratoires
publics ou privés.
responses of aurorae, plasma convection and Birkeland
currents in the pre- and postnoon sectors under positive
and negative IMF By conditions
P. E. Sandholt, C. J. Farrugia
To cite this version:
P. E. Sandholt, C. J. Farrugia. Poleward moving auroral forms (PMAFs) revisited: responses of
aurorae, plasma convection and Birkeland currents in the pre- and postnoon sectors under positive
and negative IMF By conditions. Annales Geophysicae, European Geosciences Union, 2007, 25 (7),
pp.1629-1652. �hal-00318355�
www.ann-geophys.net/25/1629/2007/ © European Geosciences Union 2007
Annales
Geophysicae
Poleward moving auroral forms (PMAFs) revisited: responses of
aurorae, plasma convection and Birkeland currents in the pre- and
postnoon sectors under positive and negative IMF B
y
conditions
P. E. Sandholt1and C. J. Farrugia2
1Department of Physics, University of Oslo, Oslo, Norway
2Space Science Center, University of New Hampshire, Durham, USA
Received: 18 December 2006 – Revised: 21 June 2007 – Accepted: 28 June 2007 – Published: 30 July 2007
Abstract. Using five case studies, we investigate the
dynam-ical evolution of dayside auroral precipitation in relation to plasma convection, classifying it by the IMF By component and position with respect to noon. Auroral observations were made by meridian scanning photometers (MSPs) and an all-sky camera (ASC) in Ny ˚Alesund, Svalbard at 76◦ MLAT, while the spatial structure of the ionospheric plasma con-vection is inferred from SuperDARN radars and ion drift observations from spacecraft in polar orbit. The IMF con-figuration of major interest here is one pointing southward and with a dominant east-west component. Our emphasis is on the auroral phenomenon of PMAFs (poleward moving auroral forms), which are ionospheric signatures of pulsed reconnection at the magnetopause. We distinguish between PMAFs/prenoon and PMAFs/postnoon. These two activi-ties are found to be separated by an auroral form around noon with attenuated emission at 630.0 nm. We document for the first time that this “midday gap aurora” appears in the form of a midday auroral brightening sequence (MABS). We study the PMAF activity consisting of an initial bright-ening phase and the later stages of PMAF evolution in re-lation to plasma convection cells, flow vorticity, and pre-cipitation boundaries in the prenoon and postnoon sectors for both By polarities. Flow channels (PIFs) associated with PMAFs are strengthened by polarization effects at au-roral boundaries. Addressing the implications of our pro-posed, extended perspective on dayside auroral morphol-ogy under southeast/west IMF for M-I coupling associated with pulsed magnetopause reconnection (FTEs), we draw in-ferences on the MLT-dependent geoeffectiveness (Birkeland current/auroral intensity) of magnetopause FTEs (subsolar region versus flanks).
Correspondence to: P. E. Sandholt
Keywords. Magnetospheric physics (Auroral phenomena;
Current systems; Magnetopause, cusp, and boundary layers; Solar wind-magnetosphere interactions)
1 Introduction
This paper deals with basic aspects of solar wind-magnetosphere-ionosphere interaction as reflected in aurora, plasma convection and Birkeland currents related to the IMF
By. The data basis consists mainly of ground observations of aurora and plasma convection. The ground perspective is required to obtain the necessary fine-structure which is essen-tial to reveal the true nature of the solar wind-magnetosphere-ionosphere coupling. Through a variety of representative case studies of the ground observations we are able to add im-portant information which is not included in the average pic-ture of plasma convection/precipitation obtained in large sta-tistical studies. The ground observations are supplemented with data on particle precipitation, Birkeland currents and ionospheric ion drift obtained from spacecraft in polar orbit. Our investigation concentrates on the ionospheric foot-print of the magnetopause reconnection process occurring under a steady southward directed interplanetary magnetic field (IMF) but with a nonzero By component. It is well known that the IMF Bycomponent introduces a strong dawn-dusk asymmetry in plasma convection (Svalgaard, 1973; Mozer et al., 1974; Cowley, 1981; Weimer, 1995) and par-ticle precipitation (Newell et al., 2004). What role do pole-ward moving auroral forms (PMAFs) (Sandholt et al., 1986; Fasel, 1995) play in this precipitation asymmetry? That is the topic of this paper. PMAFs are considered to be an au-roral phenomenon which is closely related to pulsed iono-spheric flows (PIFs) (Provan et al., 2002), both phenomena
being signatures of pulsed magnetopause reconnection (flux transfer events; FTEs) (Russell and Elphic, 1978). With this interpretation we follow a long tradition from the early pa-pers by van Eyken et al. (1984), Goertz et al. (1985), Sand-holt et al. (1986) via the Lockwood, SandSand-holt, and Cowley (1989/1990) papers (Lockwood et al., 1989; Sandholt et al., 1990), the later studies by Denig et al. (1993) and Pinnock et al. (1993), the papers by Milan et al. (1999), Milan et al. (2000), Moen et al. (2001), Neudegg et al. (2001), Lock-wood et al. (2001), Wild et al. (2003) to recent studies (Sand-holt et al., 2004a; McWilliams et al., 2004; Oksavik et al., 2005). Quite recently Sandholt and Farrugia (2007) pointed out that PMAFs do contribute to the dawn-dusk precipitation asymmetry. For a given By polarity, the PMAF behaviour is different on the pre- and postnoon sides of the “midday gap aurora”, the latter forming a minimum in the intensity of the dayside auroral emission and its activity level (Dandekar and Pike, 1978; Fasel, 1995; Sandholt et al., 2004b; Farru-gia et al., 2004b). We suggested that the prenoon-postnoon precipitation asymmetry is associated with the different FAC configurations and the asymmetric dusk- and dawn-centered convection cells introduced by IMF By. A recent study by Marchaudon et al. (2006) finds that the particle source of upward-directed Birkeland currents in the cusp region are downward-directed electrons in the 50–300 eV range, imply-ing that the auroral emission at 630.0 nm is a good tracer of upward-directed Birkeland currents. It is well known that higher-energy electrons (0.5–1 keV) that have been accel-erated by field-aligned potential drops in the cusp/cleft re-gion (Newell et al., 2005) are manifested in the green line emission (Sandholt et al., 1993; Denig et al., 1993; Farrugia et al., 1998; Maynard et al., 2006). Therefore we monitor the dayside aurora in both the 630.0 and 557.7 nm emissions.
In this paper we shall follow up the recent study by Sand-holt and Farrugia (2007), where we applied the 630.0 nm emission only, with a more comprehensive description of the fine structure of PMAFs in relation to convection cells, con-vection channels and precipitation boundaries in the pre- and postnoon sectors for both Bypolarities. We thus extend the study of PMAFs prenoon-versus postnoon asymmetry to in-clude the Bynegative case. This aim is achieved by the se-lection of clear, representative examples. In order to avoid ambiguities related to IMF variability, we selected intervals of steady southeast and southwest IMF orientation where the IMF clock angle (i.e. the polar angle in GSM Y-Z plane; 0–180◦) is typically ∼135◦. In this study we shall classify PMAFs into four sub-categories according to the local time of occurrence and IMF By: (i) PMAFs/prenoon/By>0, (ii) PMAFs/postnoon/By>0, (iii) PMAFs/prenoon/By<0, and (iv) PMAFs/postnoon/By<0. In this article we discuss the similarities and contrasts between these PMAF categories. The observations and inferences on the relationship between aurora (PMAFs), FAC-configuration, and plasma convection are discussed in terms of a simple model of solar wind-magnetosphere-ionosphere interconnection topology.
A major result of our study is that the relatively intense PMAF activities of all four categories (prenoon/postnoon for both Bypolarities) are related to strong plasma flow vorticity in the duskside- and dawnside-centered plasma convection cells. This phenomenon at the ionospheric level is discussed in terms of the role played by plasma flow shear/vorticity in the corresponding magnetopause boundary layers on the dusk and dawn sides. PMAFs/prenoon and /postnoon are found to be accompanied by discrete flow channels. Polar-ization effects at auroral boundaries contribute strongly to these convection channels. Thus, using the therminology of Marklund (1984), the PMAFs/postnoon/By<0 we document may be referred to as special types of postnoon anticorrela-tion arcs.
The PMAF activities initiated in the pre- and postnoon sec-tors are found to be separated by a weaker emission around noon, the “midday gap” aurora. We document for the first time that the latter emission band is characterized by a mid-day auroral brightening sequence (MABS) in a region of much reduced plasma flow shear relative to that on either side of noon.
2 Data presentation
2.1 By<0 case overview
In order to demonstrate the aurora-convection association for IMF By negative conditions we shall combine observations from two cases, one representing the postnoon sector (30 November 1997) and the other representing the prenoon sec-tor (16 December 1998). The solar wind and IMF condi-tions for these cases are similar. Our most important selec-tion criterion is stable IMF and solar wind condiselec-tions dur-ing the interval of interest. We want to study the relation-ship between the specific auroral activity in the prenoon and postnoon sectors which we refer to as PMAFs/prenoon and PMAFs/postnoon in relation to the plasma convection cells in the two sectors. The values of some important IMF/solar wind parameters for the two cases (30 November 1997: 11:00–11:40 UT; 16 December 1998: 06:30–07:15 UT) are given below: IMF Bx(4; −5 nT), By (−5; −7 nT), Bz(−4;
−7 nT), clock angle in GSM Y-Z plane (120–140◦; 135◦), solar wind dynamic pressure (2.5; 2 nPa).
Figure 1 shows a schematic summary of aurora and vection/FAC structure for these two cases, summarizing con-clusions detailed in the case studies. The coordinate system is MLAT/MLT. In the PMAFs/prenoon (to the left) we rec-ognize the successive brightening of two latitudinally sep-arate forms (marked A and B) in each event, which is ob-served in a region of significant northward convection. The PMAFs/postnoon activity on 30 November 1997 is marked by the successive activation of three latitudinally separate forms (A, B, and C). The photometer (MSP) observations of PMAFs/prenoon and PMAFs/postnoon are indicated by
Fig. 1. Auroral forms in relation to plasma convection streamlines associated with dusk-centered and dawn-centered convection cells in
MLT/MLAT coordinates for Bynegative conditions. Fields-of-view of the Ny ˚Alesund meridian scanning photometer (MSP) are marked for 06:50 UT (16 December 1998) and 11:30 UT (30 November 1997). Substructure of PMAFs/prenoon and PMAFs/postnoon are indicated by labels A, B, and C. Dusk-dawn passes of spacecraft DMSP F13 on 30 November 1997 and 21 January 2001 are marked by green and blue arrowed lines, respectively. Birkeland current patterns are indicated along the 09:00 and 15:00 MLT meridians.
sections along the local meridians at 10:20 MLT (06:50 UT; 16 December 1998) and at 15:00 MLT (11:30 UT; 30 November 1997). The most equatorward located discrete forms (category A) in each sector are marked by hatch-ing. These forms are subject to a sequence of 1–2 min-long brightenings which successively expand to higher lat-itudes (the B and C forms). Channels of enhanced plasma flow are marked by the bold arrows. Both the prenoon and postnoon auroral activities are seen to span latitudinal ranges characterized by high plasma flow vorticity in the dusk- and dawn-centered convection cells. In the postnoon sector the convection pattern consists of the flow channels marked FC1 and FC2 situated on either side of a convection reversal. The Birkeland current pattern indicated along the photometer scanning meridian (15:00 MLT), corresponding to the auroral observations on 30 November 1997, consists of four regimes which we refer to as R2-R1-C2-C1 (see be-low), moving from lower to higher latitudes. Outward- and inward-directed currents are marked by dotted and crossed circles, respectively. This pattern is based on observations from spacecraft FAST (13:00 MLT meridian) and DMSP F13 (17:00 MLT meridian) obtained during similar IMF condi-tions on 21 January 2001. The detailed observacondi-tions from DMSP F13 will be reported below, while the observations from FAST is given in Farrugia et al. (2004a) (see their Fig. 10).
In relation to Fig. 1 we note that in this case we report auroral activities in the pre- and postnoon sectors, i.e., well
away from noon, but not in the midday sector. As an interest-ing supplement to the present data we note that an example of the continuous observation of the Bynegative aurora ex-tending across the noon meridian has been given in Sandholt et al. (2002).
2.2 The postnoon sector under By<0 conditions
The IMF and solar wind conditions on 30 November 1997 are characterized by the following features, as observed by Wind located at (196, −3, 27) RE: (i) an abrupt southward turning at 10:02 UT, followed by (ii) a southeast field ori-entation (Bz=−5 nT, By=−5 nT) during the interval 10:02– 10:30 UT, (iii) a slow northward rotation of the IMF (Bz approaching +2 nT while By remains at −5 nT) during the period 10:30–11:00 UT. The solar wind speed and dynamic pressures are 420 km/s and 3 nPa, respectively.
The Wind-to-ground propagation delay is estimated to be 54 min. This is fairly consistent with the effect of the south-ward turning being observed as a strong intensification the aurora along the 14:30 MLT meridian at 10:58 UT (Sandholt et al., 1999).
Figure 2 shows meridian scanning photometer (MSP) data for the interval 11:20–11:50 UT when the magnetic meridian through Ny ˚Alesund is close to 15:00 MLT (Fig. 1). The ap-proximate FOV of the MSP for the 630.0 nm emission spans the latitude range ∼70–82◦MLAT. The highest auroral in-tensities (≥10 kRs) appear as red spots in the plot. We note the following features. A series of auroral brightening events
A
A
B
C
C
B
Fig. 2. MSP observations at 630.0 nm for the interval 11:20–11:50 UT as obtained from Ny ˚Alesund (76◦MLAT). Line-of-sight intensities (along the magnetic meridian) as a function of zenith angle and time are shown in a colour coded contour plot. The intensity scale is given at the bottom. North is up. Three latitudinally separate forms are marked A, B, and C. The MSP FOV at 630.0 nm is indicated by the double-arrowed meridinal line in Fig. 1.
appear at the equatorward boundary of the pre-existing lu-minosity. The auroral boundary itself migrates equatorward during the interval shown, a sign that the polar cap is expand-ing durexpand-ing the interval followexpand-ing the southward turnexpand-ing of the IMF. The major brightening forms/events (A) are followed by forms (B and C) located at higher latitudes. The C forms are very weak compared to those located at lower latitudes. We count eigth successive high-latitude forms, marked by arrows on top of Fig. 2 during this 30 min long interval, i.e. they recur on average every 4 min. At 11:30 UT the events span the latitude range ∼73–80◦MLAT.
Figure 3 shows all-sky camera (ASC) 630.0 nm images from Ny ˚Alesund during the interval 11:30–11:40 UT. The image integration time is 2 s. The central vertical line in each image marks the ∼15:00 MLT meridian. North is up and west (towards noon) is to the left. The observation geome-try and FOV in MLAT/MLT coordinates are as indicated in Fig. 1.
The most intense auroral band (A) stretches across the ASC FOV from southeast to northwest, intersecting the lo-cal meridian at 30–40◦south of zenith (SZ). This is the form marked A in Fig. 1. The dynamics of this aurora, appear-ing as a series of brightenappear-ing forms advancappear-ing toward noon, is also seen in Fig. 2. A second form (B) crosses the
lo-cal meridian (15:00 MLT) at slightly higher latitude (∼10◦ SZ). Then a third form (C), appearing as a much weaker band moving eastward (antisunward), is seen at ∼45◦ NZ (∼79◦MLAT). Form (C), marked by circle, appears as a se-quence of emission bands moving from west to east across the 15:00 MLT meridian. One of these events crossed the local meridian (15:00 MLT) between 11:30–11:33 UT, and its signature is clearly seen (at zenith angle 20–60◦ NZ) in the MSP data in Fig. 2. The ASC data show that the lowest-latitude forms (A) are expanding noonward (west-ward), while the highest-latitude forms (C) are moving an-tisunward (eastward).
Figure 4 shows ion drift vectors and plasma convection streamlines for 11:30 UT. SuperDARN (Greenwald et al., 1995) provides line-of-sight velocity measurements of the high-latitude ionosphere (see http://superdarn.jhuapl.edu). The view is looking down on the north pole. Noon is at the top and dawn is to the right. These measurements are combined using the “Map Potential” fitting technique (Ruo-honiemi and Baker, 1998) to produce maps of large-scale ionospheric convection. The data coverage in the MLT-MLAT sector we study (postnoon; high latitudes) was good. The evident distortions of the duskside and dawnside con-vection cells are as expected for southwest IMF (By<0)
11:30:00 11:32:00 11:34:00
11:36:00 11:38:00 11:40:00
Fig. 3. ASC image sequence at 630.0 nm for the interval 11:30–11:40 UT. The coordinate system is zenith angle vs. azimuth angle with
respect to magnetic north. The central vertical line (yellow) marks the 15:00 MLT meridian. Magnetic north is up and west to the left in each image. Latitudinally separate forms have been marked A, B, and C.
conditions (Ruohoniemi and Greenwald, 2005). Our focus is on the crescent-shaped postnoon cell with the convection reversal located at ∼77◦ MLAT, slightly north of the opti-cal site at Ny ˚Alesund, Svalbard (marked by solid dot). At 11:30 UT the optical site is located close to 15:00 MLT, as illustrated in the figure. The approximate FOV of the MSP at 630.0 nm is marked by double-arrowed meridional line cov-ering the MLAT range 70–82◦MLAT.
The convection consists of a channel of fast (1.0–1.5 km/s) noonward (westward) flow at 73–75◦MLAT and a channel of fast duskward (eastward) flow at higher latitudes, within
∼78–82◦MLAT. A previous study shows that the latter con-vection channels in the postnoon sector under By negative conditions (21 January 2001) appear as a sequence of con-vection enhancements propagating from lower to higher lat-itudes (Farrugia et al., 2004a). Such flows are referred to in the literature as pulsed ionospheric flows (PIFs) (Provan et al., 2002). The association between these flow chan-nels/PIFs and the aurora/precipitation pattern is detailed be-low.
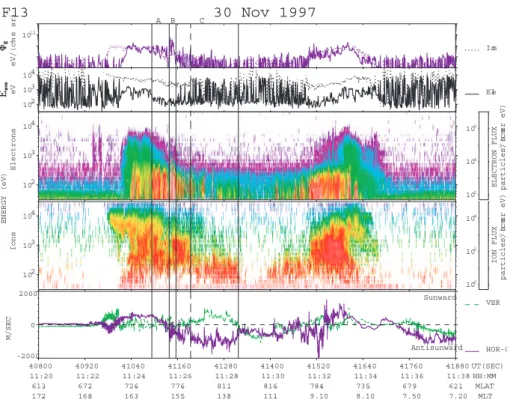
Figure 5 shows particle precipitation and ionospheric ion drift recorded from spacecraft DMSP F13 during the inter-val 11:20–11:38 UT on 30 November 1997. At this time the spacecraft crossed the polar cap from dusk to dawn. We shall focus on the passage through the postnoon/dusk sector
(14:00–16:00 MLT/70–81◦MLAT). (The track is marked by the green line in Fig. 1). We note the crossing of a chan-nel of enhanced antisunward convection (bottom pachan-nel) and very weak precipitation of mantle type in the sector 77– 81◦MLAT/13:30–15:30 MLT (precipitation regime C) dur-ing the interval 11:26–11:29 UT. The F13 track intersected the FOV of the Ny ˚Alesund MSP at 78◦MLAT/15:00 MLT at ∼11:26:30 UT. This time corresponds to the equatorward part of the convection channel (marked FC2 in Fig. 1) and the weak forms of eastward/duskward-moving aurora (our form C).
We shall distinguish between one regime of diffuse aurora (left side/equatorward of first vertical guideline) and the three latitude regimes of discrete auroral precipitation on the dusk side (14:00–16:30 MLT sector), marked by vertical guide-lines and corresponding to auroral forms A, B, and C in Fig. 1.
72–74.5◦ MLAT: diffuse CPS precipitation in regime of noonward (sunward)-directed convection, 74.5–76◦ MLAT (A): mixing layer of magnetosheath-type and plasmasheet-type electrons associated with the poleward edge of a sunward-directed convection channel (marked by hatched area in Fig. 1), 76–77.6◦MLAT (B): intense arc-type precipi-tation located close to the convection reversal, 78–82◦MLAT (C): much weaker, mantle/polar rain-type precipitation in the
-03 -03 -03 -03 -0 9 -09 -09 -15 -15 -21 03 03 03 09 09 09 15 30 Nov 1997 11:30:00 - 11:32:00 UT 0 m/s 2000 2000 m/s APL MODEL 4<BT<6 Bz-/By-05 nT (-54 min) +Y +Z 56 kV SuperDARN http://superdarn.jhuapl.edu JHU/APL.Software by R.J.Barnes
Fig. 4. Plasma convection pattern for 11:30–11:32 UT as obtained from SuperDARN radars. The coordinate system is MLAT/MLT. Ion drift
velocities are color coded according to the scale in the upper left corner. The IMF orientation projected to the GSM Y-Z plane is given in the upper right corner. The FOV of the MSP in Ny ˚Alesund at 11:30 UT (along 15:00 MLT meridian) is marked by a double-arrowed meridional line.
regime of enhanced antisunward convection. The convec-tion (C) corresponds to the high-latitude flow channel seen in the SuperDARN data in Fig. 4 and our auroral form C (see geometry in Fig. 1). The high-latitude auroral form C at the time of the satellite pass (11:26:30 UT) is marked in Fig. 2. From the present information we can see that the polar cap flow channel is located adjacent to the BPS-type precipitation (form B), on its poleward side, in a regime of weak aurora/precipitation/conductance. We will get back to this relationship between the channel of ionospheric ion drift (enhanced electric field) and precipitation/conductivity in the discussion section. Precipitation regime (B), located near the convection reversal at 77◦ MLAT/15:30 MLT, contains a mixture of high fluxes of low-energy (∼200 eV) electrons and weaker fluxes of electrons with energy extending beyond 1 keV. This type is often identified as BPS (boundary plasma sheet) in the literature (Newell et al., 2004, 2005).
A final comment on the association between the F13 parti-cle precipitation and the ground optical data may be made. The very weak precipitation in regime (C) (mantle-type
within 78–82◦MLAT during 11:26–11:28 UT) is consistent with the fact that the satellite crossed this latitude range near the Ny ˚Alesund/MSP meridian (Fig. 1) in the interval when the MSP recorded a weak type C auroral form between zenith angles 10–60◦NZ (see Fig. 2). The more intense precipita-tions (A and B) are seen at lower latitudes in both data sets.
In order to document properly the electrodynamics of PMAFs/postnoon/By<0 we need to study the latitude pro-files of precipitation/aurora (PMAFs/postnoon) and plasma convection reported above in relation to the corresponding Birkeland current pattern under By negative conditions. To this end, we shall report data from a DMSP F13 pass on 21 January 2001. This time the F13 track followed the 17:00 MLT meridian as indicated by the blue arrowed line in Fig. 1. The SuperDARN plasma convection data for this day are shown in Farrugia et al. (2004a). Again the solar wind and IMF conditions were stable and similar to that in the previous cases: IMF Bx=6 nT, By=−8 nT, Bz=−8 nT, clock angle = 130◦, dynamic pressure = 2 nPa.
102 103 104 102 103 104 1012 102 103 104 Ion Ele -2000 0 2000 Sunward Antisunward VER HOR-C 102 104 106
ELECTRON FLUX particles/(cm
2 s sr eV) 100 102 104 ION FLUX particles/(cm 2 s sr eV) F13 M/SEC 30 Nov 1997 ENERGY (eV) Electrons Ions eV eV/(cm 2 s sr) 40800 11:20 61.3 17.2 40920 11:22 67.2 16.8 41040 11:24 72.6 16.3 41160 11:26 77.6 15.5 41280 11:28 81.1 13.8 41400 11:30 81.6 11.1 41520 11:32 78.4 9.10 41640 11:34 73.5 8.10 41760 11:36 67.9 7.50 41880 11:38 62.1 7.20 UT(SEC) HH:MM MLAT MLT A B C
Fig. 5. DMSP F13 particle precipitation and ion drift data for the interval 11:20–11:38 UT. Panels from top to bottom show: (i) energy flux
for electrons and ions (dotted), (ii) average energy of electrons and ions (dotted), (iii) electron and (iv) ion differential fluxes (color-coded according to scale to the right), and (v) horizontally across-track (violet) and vertical (green) ionospheric ion drift components. Different latitude regimes of discrete auroral precipitation on the dusk side are marked by vertical guidelines.
Figure 6 shows particle precipitation, ionospheric ion drift, and FAC data obtained along the dusk-dawn pass during the interval 15:19–15:46 UT as indicated by the blue line in Fig. 1. We note the following features recorded along the dusk-side section of the track (∼17:00 MLT meridian): (i) 63–67◦ MLAT: diffuse precipitation (CPS), a plateau of strong sunward convection, and Region 2 (R2) FAC, (ii) 67–69◦ MLAT: intense auroral arcs in the regime of convection gradient and outward-directed FAC of type Region 1 (R1),
(iii) 69–74◦ MLAT: two auroral arcs located in the region of converging E-field (flow shear arcs) and the associated outward-directed FAC we call C2,
(iv) 74–80◦ MLAT: channel of enhanced antisunward flow, weak particle precipitation flux, and downward-directed FAC (C1).
We note that the ion drift in the antisunward convection channel maximizes at the poleward boundary of the auro-ral arcs (third vertical guideline from left). As explained in the discussion section this increase in the flow speed is the polarization effect of the “evening anticorrelation arcs” in the therminology of Marklund (1984). The low conductiv-ity on the poleward side of the arcs leads to an enhancement of the southward-directed electric field which drives the Ped-ersen current closing the C1-C2 Birkeland currents. (This
E-field is marked Epolin Fig. 1. The conductivity- and
E-field - variations in the vicinity of the arcs are anticorrelated). The IMF By-related Birkeland currents, located poleward of the R1 and R2 FACs, are identified as the HCC and LCC currents of Taguchi et al. (1993). The association between PMAFs/postnoon/By<0, plasma convection and the Birke-land currents (R1-C2-C1) is indicated in Fig. 1. We discuss this further in the last section.
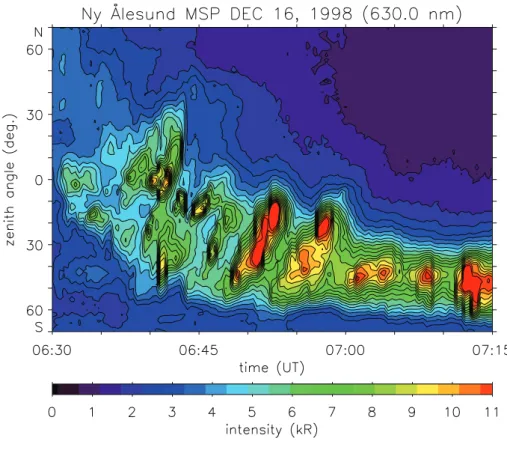
2.3 The prenoon sector under Bynegative conditions As an example of the typical features of the prenoon sector auroral activity under steady By<0 conditions (PMAFs/prenoon/By<0) we next present MSP data for the interval 06:30–07:15 UT (10:00–10:45 MLT) on 16 Decem-ber 1998. These will be discussed in the context of the cor-responding convection data obtained from SuperDARN. IMF conditions obtained from spacecraft Wind during the interval 06:30–07:30 UT are as follows: (i) Bx=−5 nT; By=−7 nT;
Bz=−7 nT (see Thorolfsson et al., 2000). The solar wind dynamic pressure was 2 nPa in this case. At 07:00 UT space-craft Wind was located at (4.4, −28.8, 19.4) RE (GSE co-ordinates). The Wind-to-ground propagation delay is small (few minutes). As in the 30 November 1997 case, the in-terval we study on 16 December 1998 was preceded by a rapid southward turning (recorded by Wind at 06:22 UT). A
102 103 104 102 103 104 1012 102 103 104 Ion Ele -3000 0 3000 Sunward Antisunward VER HOR-C 102 104 106
ELECTRON FLUX particles/(cm
2 s sr eV) 100 102 104 ION FLUX particles/(cm 2 s sr eV) F13 M/SEC 21 Jan 2001 ENERGY (eV) Electrons Ions eV eV/(cm 2 s sr) 55140 15:19 41.0 17.5 55320 15:22 51.1 17.4 55500 15:25 61.2 17.4 55680 15:28 71.3 17.3 55860 15:31 81.4 17.2 56040 15:34 88.2 7.80 56220 15:37 78.3 5.90 56400 15:40 67.7 5.80 56580 15:43 57.1 5.70 56760 15:46 46.9 5.80 UT(SEC) HH:MM MLAT MLT -900 0 900 Sunward Antisunward DBY DBZ nT R2 R1 C2 C1
Fig. 6. DMSP F13 data for the dusk - dawn pass during the interval 15:19–15:46 UT on 21 Januray 2001. Same format as in Fig. 5. The
bottom panel shows the horizontal magnetic deflection components Bx(red; east-west) and By(blue; along the track). Intervals representing different FAC regimes (R2-R1-C2-C1) and auroral precipitation regimes are marked by vertical guidelines.
summary of the observation geometry and the major aurora-convection features in the prenoon sector can be seen in Fig. 1.
Figure 7 shows MSP observations from Ny ˚Alesund for the interval 06:30–07:15 UT when the station moved through the sector ∼10:00–10:45 MLT. (The approximate MSP FOV at 630.0 nm is shown in Fig. 1 for 06:50 UT). The equator-ward boundary is moving equatorequator-ward during the interval 06:30–07:00 UT in response to the IMF southward turning recorded by spacecraft Wind at 06:20 UT. Observations in the interval 06:30–07:00 UT are characterized by a sequence of intensifications at the equatorward boundary of the pre-existing luminosity and PMAFs recurring at 5 min intervals. Each event is strong in both the red and green lines. An ini-tial brightening is typically followed by another bright form at higher latitude. These are the forms marked A and B in Fig. 1
A transition in the auroral state is observed at 07:00 UT (∼10:30 MLT), after which the aurora is characterized by an arc located at a constant latitude of ∼73–74◦ MLAT. This arc is also subject to repeated brightenings but PMAFs are absent. The 07:00 UT transition is related to the spa-tial structure of the plasma convection pattern. From the
SuperDARN convection data reported below we shall con-clude that the PMAF activity observed during the interval 06:30–07:00 UT is a phenomenon restricted to the region where a large northward component of the dawn-centered convection cell is observed. We shall call this aurora for PMAFs/prenoon/By<0. The more latitudinally restricted au-rora observed after 07:00 UT is that marked by hatching in Fig. 1.
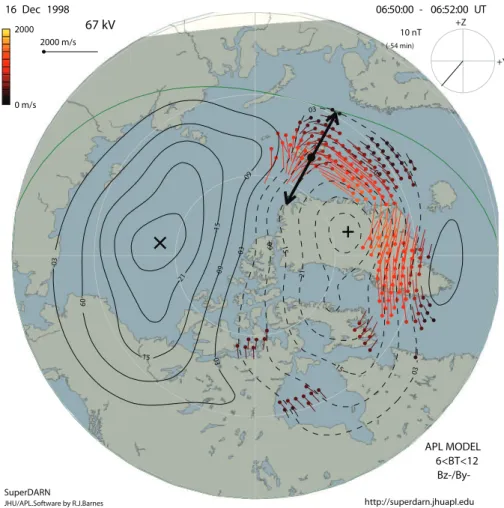
Figure 8 shows SuperDARN plasma convection data in the prenoon sector for the interval 06:50–06:52 UT. The ap-proximate MSP FOV at 630.0 nm is indicated by a double arrowed meridional line. A channel of fast (∼1 km/s) noon-ward (eastnoon-ward) convection at ∼72–75◦MLAT is present in the prenoon sector. The optical site at Ny ˚Alesund is located at the western edge of the convection throat, where the ion flow in the dawn-centered cell rotates from east to north. By
∼07:00 UT the throat of the convection pattern had moved so far eastward (noonward) such that the MSP meridian was located on its western (dawn) side. This longitudinal shift of the convection pattern was accompanied by the local disap-pearance of PMAFs at 07:00 UT.
Fig. 7. MSP observations for the interval 06:30–07:15 UT on 16 December 1998. Upper and bottom panels show the red and green line
-0 3 -03 -03 -09 -09 -09 -15 -15 -21 03 03 0 9 09 15 15 21 16 Dec 1998 06:50:00 - 06:52:00 UT 0 m/s 2000 2000 m/s APL MODEL 6<BT<12 Bz-/By-10 nT (-54 min) +Y +Z 67 kV SuperDARN http://superdarn.jhuapl.edu JHU/APL.Software by R.J.Barnes
Fig. 8. Plasma convection pattern for 06:50–06:52 UT as obtained from SuperDARN radars. Same format as in Fig. 4.
2.4 By>0 case overview
A schematic illustration of the association between auroral forms and plasma convection on both sides of noon, as de-rived from the observations in the By>0 cases given below, is shown in Fig. 9. The derivation of FACs in this per-spective is made by recognizing the close link that exists between upward-directed FACs and discrete aurorae (Frey et al., 1996; McFadden et al., 1999) and by inferences from observations from satellites in polar orbit made previously in similar cases (Sandholt and Newell, 1992; Farrugia et al., 2003, 2004b; Oksavik et al., 2004b). Plasma vorticity in the ionosphere (Reiff et al., 1978; Sofko et al., 1995) and at the magnetospheric level (see e.g. Sonnerup and Siebert, 2003) of the magnetosphere-ionosphere coupling process is a cen-tral feature of the physics behind both the aurora and FACs in this case.
The three essential elements of the auroral morphology, consisting of (i) PMAFs/prenoon, (ii) the “midday gap” emission band at/near noon and (iii) PMAFs/postnoon, are illustrated. As regards feature (ii) we shall introduce the phe-nomenon of midday auroral brightening sequence (MABS)
reported here. It is marked by the hatched belt in our schematic figure. We distinguish between three categories of plasma convection streamlines corresponding to the dusk-centered convection cell (marked 1), the dawn-dusk-centered con-vection cell (marked 2), and concon-vection at noon/near noon, in the close vicinity of the the zero-point potential streamline (marked 3). While streamlines of types 1 and 3 show strong vortical flow, type 2 streamlines have much reduced vorticity. As we shall see below the bright auroral phenomena referred to as PMAFs/postnoon and PMAFs/prenoon are associated with streamline categories 1 and 2, respectively. The mid-day auroral brightening sequence (MABS) is observed in the region of streamlines of type 3.
2.5 By>0 case on 8 December 1999
Here we give a brief introduction to the aurora under By> conditions by reporting a case illustrating the relation be-tween auroral morphology consisting of PMAFs/prenoon, the “midday gap aurora”, and PMAFs/postnoon and plasma convection cells. The specific auroral morphology for 8 December 1999 has been documented in previous studies
Ómidday gapÓ aurora (
)
(MABS)
90
80
70
70
1)
1500
MLT
0900
MLT
80
3)
2)
FC2
FC1
Epol.
0740
0840
PMAFs/prenoon
(A - B - C)
PMAFs/postnoon
(
)
CPS C2 BPS LL C1 JP C B AFig. 9. Schematic view of the association between aurora and plasma convection around noon in MLT/MLAT coordinates for the By>0 case. Plasma convection streamlines in the dusk-centered (1) and dawn-centered (2) convection cells and at noon (3) are marked. Fields-of-view of the optical instruments in Ny ˚Alesund refer to 07:40 UT and 08:40 UT on 8 December 1999. Auroral forms/activities are marked: PMAFs/prenoon and PMAFs/postnoon (red arrows), MABS (hatching). FACs directed into and out of the ionosphere are indicated by crossed and dotted circles.
(Sandholt et al., 2004a,b; Sandholt and Farrugia, 2003; Far-rugia et al., 2004b). Here we shall extend these works by placing this auroral morphology in the context of plasma convection detected by the SuperDARN radars on this same day.
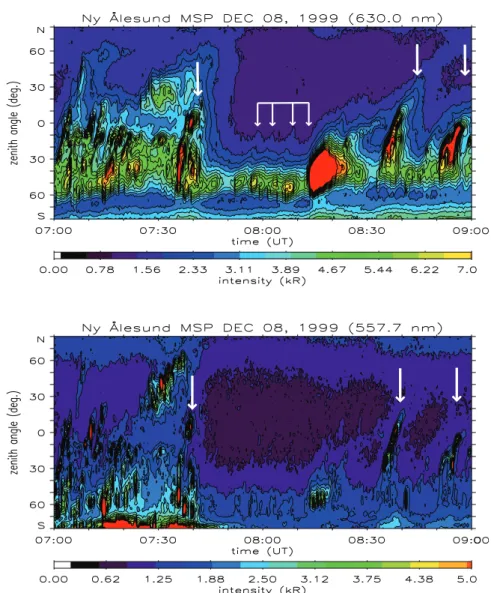
MSP data for the interval 07:00–09:00 UT, represent-ing the prenoon, noon and early postnoon sectors (10:30– 12:30 MLT) on 8 December 1999 are displayed in Fig. 10. The white arrow at 07:40 UT marks an isolated example of PMAFs/prenoon. This event appears as the successive acti-vation of three latitudinally separate auroral forms. A sum-mary of the 2-D view of these observations is given in Fig. 9 (see forms marked A, B, and C). The midday auroral bright-ening sequence (MABS), appearing at relatively moderate intensity during the interval 07:50–08:15 UT, is marked by the four combined arrows in Fig. 10. Two examples of bright PMAFs/postnoon, appearing in the interval 08:35-09:00 UT, are also marked by two separate white arrows. While both PMAFs/prenoon and PMAFs/postnoon are strong in both emission lines, the much weaker MABS is absent in the green line emission. Below we shall document the 2-D evo-lution of the PMAFs/postnoon by describing all-sky cam-era (ASC) observations obtained during the interval 08:35– 08:40 UT. We note that in this case, contrary to the others, the IMF conditions were not steady. Both PMAFs/prenoon
and PMAFs/postnoon occurred when the IMF clock angle entered the regime 90–135◦ (By-dominated). The MABS was observed when the IMF was directed slightly more south (clock angle >135◦) (Sandholt et al., 2004a).
Figure 11 shows ASC data at 630.0 nm for the inter-val 08:35–08:40 UT. (The fields-of-view of the optical in-struments in Ny ˚Alesund (ASC and MSP) are shown for 08:40 UT in Fig. 9). We notice an event of near-simultaneous brightenings on either side of the midday gap aurora. A good example of PMAFs/postnoon is seen to expand west-ward, reaching the meridian of the optical site (12:00 MLT) at 08:36–08:37 UT (marked by red, curved arrow in Fig. 9).
Then the resulting elongated band expanded poleward, reaching the station latitude (76◦ MLAT) at 08:40 UT (around 12:00 MLT). This is followed by a fading phase. When combined with the SuperDARN convection data given below, it appears that the PMAF/postnoon expanded west-ward and polewest-ward towest-wards the optical site in the dusk-centered convection cell, while PMAFs/prenoon appeared as a successive brightening of three latitudinally separate forms in the regime of poleward convection in the dawn-centered merging cell, as shown schematically in Fig. 9. The detailed spatio-temporal evolution of PMAFs/prenoon in the 10:00– 11:00 MLT sector (the 07:40 UT event) is documented in ASC data shown in Fig. 3 in Sandholt et al. (2004a).
Fig. 10. MSP observations for the interval 07:00–09:00 UT on 8 December 1999. Upper and bottom panels show the red and green line
emissions at 630.0 and 557.7 nm, respectively. Same format as in Fig. 2. The auroral phenomena under discussion are marked by white arrows.
In order to illustrate the association plasma convection and PMAFs for IMF By>0, Fig. 12 shows the dayside Super-DARN convection plot for 08:40 UT on 8 December 1999 with auroral features superimposed. We note the following features: (i) A weak and stable midday midday gap aurora, bordered by auroral brightening (AB) events on its eastern (AB east) and western (AB west) sides, (ii) the relation of AB east and AB west forms to the dusk and dawn-centered convection cells, respectively, (iii) the expansion of AB east and AB west into the ASC FOV from the postnoon and prenoon sides, and being followed by PMAF/postnoon and PMAF/prenoon, respectively (see white arrows in Fig. 12). Here we have documented the 2-D evolution of the 08:35– 08:40 UT event on 8 December 1999.
2.6 By>0 case on 12 December 1999
12 December 1999 is characterized by an unusually long in-terval of steady IMF orientation and stable solar wind plasma conditions. The IMF clock angle was ∼135◦ (B
y=3 nT;
Bz=−3 nT) for the whole interval 05:00–12:00 UT, when the ground station at Ny ˚Alesund moved through the MLT sector ∼06:00–15:00 MLT. This allows us to probe the spatial structure of auroral precipitation correspond-ing to the dayside magnetospheric boundary layers via the ground observations of the aurora. We shall emphasis the spatio-temporal structure of PMAFs/prenoon/By>0 versus PMAFs/postnoon/By>0 and the midday gap aurora. A brief report on the red line emission was given in Sandholt and
08:35:00 08:36:00 08:37:00
08:38:00 08:39:00 08:40:00
Fig. 11. ASC data from Ny ˚Alesund for the interval 08:35–08:40 UT. Same format as in Fig. 3. The central vertical line (yellow) marks the 12:00 MLT meridian. The ASC FOV at 630.0 nm is marked in Fig. 9.
Farrugia (2007). In the more extensive documentation of the present paper we include the red and the green line emis-sions.
Figure 13 shows MSP data for the interval 05:30– 08:00 UT representing the prenoon sector (09:00– 11:30 MLT). The red (630.0 nm) and green (557.7 nm) auroral emissions are shown in the upper and lower panels, respectively. The approximate MSP FOV at 630.0 nm is shown by double-arrowed meridional line in Fig. 9 for 07:40 UT. The basic elements are: (i) high-latitude (∼78– 80◦MLAT) forms appearing in both emission lines during the interval 05:30–06:20 UT (09:00–09:50 MLT),
(ii) a series of poleward-propagating brightening events (PMAFs/prenoon) spanning a wide latitude range from well south of zenith (∼73◦MLAT) to well north of zenith (∼73◦ MLAT) during the interval 06:40–07:40 UT (∼10:00– 11:00 MLT),
(iii) weaker events (midday auroral brightening sequence; MABS) during the interval from 0740 UT (∼11:00 MLT) onwards,
(iv) presence of a diffuse, green line aurora near the southern border of the MSP field of view.
The PMAFs (feature (ii)) are characterized by initial brightenings followed by 1–2 “rebrightenings” as the event expand to higher latitudes (upward in the plot). (The three latitudinally separate forms are marked A, B, and C in the schematic Fig. 9). The average recurrence period is 4 min, i.e., the same as in the previously reported By<0 case in the postnoon sector.
The diffuse aurora seen near the equatorward boundary of the FOV in the green line panel is absent in the red line panel and decreasing in intensity with increasing time to-wards 08:00 UT (11:30 MLT). It is caused by energetic cen-tral plasma sheet (CPS) electrons drifting through the dawn sector from the nightside.
Previous studies show that the PMAFs/prenoon activity occurs in the precipitation regimes referred to as BPS, LLBL, and mantle (Sandholt and Newell, 1992). Thus, the north-ernmost form (C) consists of mantle-type precipitation. This precipitation pattern is very similar to the activity of A-B-C forms observed in the postnoon sector during IMF By<0 conditions. The difference is that the highest-latitude form (C) in the present case is much more intense (particularly in the green line emission). This we shall relate to a different FAC polarity (up versus down).
We shall now relate the auroral morphology described above (PMAFs/prenoon and MABS) to the plasma convec-tion pattern derived by SuperDARN radars. Figure 14 shows the ion drift pattern obtained by SuperDARN HF radars at 07:30–07:32 UT. These SuperDARN data are included here as a documentation of the plasma convection pattern in the prenoon sector under the steady southeast IMF conditions on this day.
The plasma convection in the 09:00–11:00 MLT sector is characterized by the following features: (i) noonward con-vection below ∼75◦MLAT, and (ii) northwestward convec-tion at speed ≤1 km/s within 77–82◦ MLAT. Relating the auroral activity to the plasma convection pattern, we find
-03 -03 -03 -09 -09 -15 -15 -15 -21 -21 -27 03 03 09 09 08 Dec 1999 08:40:00 - 08:42:00 UT 0 m/s 2000 2000 m/s APL MODEL 4<BT<6 Bz-/By+ 04 nT (-54 min) +Y +Z 60 kV SuperDARN http://superdarn.jhuapl.edu JHU/APL.Software by R.J.Barnes AB west AB east
midday gap aurora
Fig. 12. SuperDARN plasma convection data for 08:40–08:42 UT on 8 December 1999. Same format as in Fig. 4. The ASC (circle) and
MSP fields of view and auroral brightening events at the eastern (AB east) and western (AB west) boundaries of the ASC FOV have been marked. Auroral expansions in PMAFs/prenoon and PMAFs/postnoon are marked by white arrows.
that the highest-latitude phase of the PMAF activity around 07:30 UT (∼78–80◦ MLAT; 11:00 MLT) is located in the regime where plasma convection is directed northwest at a speed of ∼1 km/s. The initial brightenings at ∼73◦MLAT correspond to the channel of enhanced noonward convec-tion. These forms are propagating noonward (see details in Sandholt et al., 2004a, and Sandholt et al., 2004b). Thus, we conclude that the PMAF activity in the prenoon sector spans the convection reversal of the dawn-centered merging convection cell, as indicated schematically in Fig. 9. The region of PMAFs/prenoon occurrence is therefore charac-terized by high flow vorticity. The weaker MABS, located closer to noon, corresponds to the convection throat where the flow vorticity is much lower (also indicated schematically in Fig. 9).
Figure 15 shows the MSP observations of the aurora in the postnoon sector (08:30–11:00 UT; ∼12:00–14:30 MLT). The approximate MSP FOV at 630 nm is shown in Fig. 9 for 08:40 UT (double-arrowed meridional line). Here we shall focus on the following features:
(i) the presence of MABS as a very weak emission in the green line during the interval 08:30–09:10 UT (12:00– 12:40 MLT; continuation of activity initiated at 07:40 UT), (ii) sequence of five major PMAFs/postnoon (recurrence time = 25 min) observed in the interval 09:15–11:00 UT.
A central feature of the PMAFs/postnoon activity is the sequence of 1–2 min long brightenings (the red spots in the figure) appearing in both emission lines, followed by PMAFs. (The breakup phase of PMAFs/postnoon is marked by double-hatched area in Fig. 9). ASC observations of these events show noonward and poleward propagating forms (PMAFs) that continuously fade during the expansion (Sand-holt and Farrugia, 2003). This contrasts with the “rebright-ening” of PMAFs/prenoon shown in Fig. 13.
From the same all-sky camera observations we know that the PMAFs/postnoon activity (breakup phase) in the present case occur within the ∼13:30–15:00 MLT sector. The all-sky camera images show, for example, that the 09:20 UT event in the MSP records of Fig. 15 consists of an initial brighten-ing appearbrighten-ing within 14:00–15:00 MLT (outside MSP FOV)
Fig. 13. MSP data from Ny ˚Alesund for the interval 05:30–08:00 UT. The red and green auroral lines at 630.0 and 557.7 nm are shown in the upper and lower panels, respectively. Same format as in Fig. 2.
at 09:10 UT, followed by westward expansion reaching the 12:30 MLT (optical site) at 09:17 UT, and a fading phase during the interval 09:20–09:30 UT.
Based on the observations in the pre- and postnoon sectors we detail the following contrasts (asymmetry) be-tween PMAFs/prenoon/By>0 and PMAFs/postnoon/By>0
-03 -03 -09 -09 -09 -15 -15 -21 03 03 03 09 09 15 12 Dec 1999 07:30:00 - 07:32:00 UT 0 m/s 2000 2000 m/s APL MODEL 4<BT<6 Bz-/By+ 04 nT (-54 min) +Y +Z 59 kV SuperDARN http://superdarn.jhuapl.edu JHU/APL.Software by R.J.Barnes
Fig. 14. SuperDARN radar observations of plasma convection during the interval 07:30–07:32 UT. The FOV of the MSP in Ny ˚Alesund (11:00 MLT) is marked. Same format as in Fig. 4.
in this case: (i) PMAFs/postnoon recur less frequently than PMAFs/prenoon, (ii) PMAFs/postnoon span a lower latitude range, (iii) they show less sub-structure, i.e., “rebrightening forms” are less pronounced.
We next show representative SuperDARN plasma con-vection data for the interval (09:15–11:00 UT) of clear PMAFs/postnoon observed on this day.
Figure 16 shows a spatial plot of SuperDARN convec-tion data for 10:00–10:02 UT, representative of the early postnoon sector on this day with steady southeast IMF ori-entation. Enhanced (red) noonward (westward) convection exists within the latitude range ∼70–74◦ MLAT, on the equatorward side of the optical site (marked by solid dot), with weaker northwestward flow at higher latitudes (76–80◦ MLAT). These features constitute a central part of the dusk-centered merging convection cell. A smaller and weaker lobe cell may be seen inside the merging cell, tailward of the 14:00 MLT meridian (see Sandholt et al., 2006, for further documentation and discussion).
Combining the two data sets we note the following associ-ation between aurora and plasma convection: (i) the auroral
brightening forms, this time recurring at ∼25 min intervals, are located at ∼73–74◦ MLAT, corresponding to the pole-ward boundary of the channel of enhanced noonpole-ward con-vection, where the flow vorticity is high,
(ii) PMAFs span the latitude range ∼74–77◦MLAT where plasma is convecting in the northwestward direction.
The presence of PMAFs/postnoon/By>0 activity on the poleward boundary of the convection channel is demon-strated in previous work (Sandholt et al., 1990) and con-firmed in the present case. We note that the brightest forms appearing at 09:45 and 10:05 UT seem to originate at lower latitudes, near the equatorward boundary of the pre-existing luminosity (see the red line panel). This is most likely an alti-tude effect. The relatively high electron energy (∼0.5–1 keV) in these strong events, as manifested by the high green line emission, penetrate to lower altitudes than what is typical in the cusp region and therefore the corresponding auroral emis-sion appears at higher zenith angles in the south. In the green line emission the events still appear at the poleward bound-ary of the pre-existing luminosity. A schematic illustration of the expected spatial structure of the aurora in relation to
Fig. 15. MSP data from Ny ˚Alesund for the interval 08:30–11:00 UT. The red and green auroral lines at 630.0 and 557.7 nm are shown in the upper and lower panels, respectively. Same format as in Fig. 13.
-03 -03 -03 -09 -09 -09 -15 -15 -15 -21 -21 03 03 09 12 Dec 1999 10:00:00 - 10:02:00 UT 0 m/s 2000 2000 m/s APL MODEL 4<BT<6 Bz-/By+ 04 nT (-54 min) +Y +Z 49 kV SuperDARN http://superdarn.jhuapl.edu JHU/APL.Software by R.J.Barnes
Fig. 16. SuperDARN plasma convection data for 10:00–10:02 UT. Same format as in Fig. 4.
the plasma flow channel (FC 1) and Birkeland currents in the postnoon sector is indicated in Fig. 9.
3 Summary and discussion
We have reported observations of the association between dayside auroral forms and plasma convection/Birkeland cur-rents during intervals of southeast and southwest IMF ori-entations when simultaneously |By/Bz|≥1 in most cases. In such cases clear By-related dawn-dusk asymmetries of plasma convection are present. Emphasis is placed on the auroral phenomenon of PMAFs in relation to plasma convec-tion cells in the pre- and postnoon sectors. We conclude from the observations that PMAF activity (initial brightening fol-lowed by poleward moving forms) is closely associated with vortical flows in the dawn- and dusk-centered convection cells. For IMF By>0 PMAFs/prenoon and PMAFs/postnoon are found to be separated by a strongly attenuated band of 630.0 nm emission at/near noon, the midday gap aurora. The latter phenomenon is subject to a brightening sequence which we refer to as MABS (midday auroral brightening se-quence). By this documentation we are able to establish a
more comprehensive view of the dayside aurora in relation to the plasma convection configuration under the given IMF conditions, involving the three elements mentioned above.
We believe that our choice of examples are representative. Except for one case (8 December 1999) we chose steady IMF conditions and By-dominant orientation. Aspects of these observations have been discussed before, as we mention in appropriate places. Here we extend the previous studies of PMAFs asymmetry about noon in relation to plasma convec-tion and for the first time we shall discuss the MLT-dependent auroral activity (MABS versus PMAFs) in relation to M-I coupling associated with magnetopause flux transfer events in the respective local time sectors.
The different plasma convection and FAC configura-tions suggest a subdivision of PMAFs into four types (i) PMAFs/prenoon/By>0, (ii) PMAFs/postnoon/By>0, (iii) PMAFs/prenoon/By<0, and (iv) PMAFs/postnoon/By<0. By PMAFs/postnoon we mean one initiated at postnoon lo-cal times, and evolving on the postnoon side, at least in its earlier stages. The PMAF activity may, however, cross the noon meridian in its later stages, as indicated in Fig. 9. Thus the distinction between pre- and postnoon refers principally
to the local time of their initiation and to the early evolution phase.
We note that the type of fine-structure in auroral precip-itation and plasma convection observed in this study is of-ten averaged out in large statistical studies. In this respect the conclusions reached in our case studies form a neces-sary complement to previous statistical work on the subject of IMF By-related dawn-dusk asymmetries of dayside auro-ral precipitation and plasma convection (Newell et al., 2004, 2005). In this paper we extend the initial study of PMAF asymmetry about noon for the IMF By positive case (Sand-holt and Farrugia, 2007) and we also include the Bynegative case.
We next discuss the three basic elements of the dayside au-roral morphology in terms of the magnetopause reconnection topology and the spatial and temporal evolution of magne-topause reconnection events. The spatiotemporal structure of the magnetopause reconnection process has been a debated issue since the discovery of the magnetopause flux transfer events by Russell and Elphic (1978). On the assumption that the reported auroral activities are ionospheric manifest-stions of FTEs we brought the discussion of magnetosphere – ionosphere coupling associated with FTEs a step forward. A central unresolved issue in this discussion is the question of magnetosphere – ionosphere coupling of FTEs (via Birke-land currents) in the different MLT sectors. With the present documentation of the aurora – convection configurations in the different magnetic local time sectors we now turn to this matter.
In line with previous studies we interpret the PMAFs/prenoon and PMAFs/postnoon in terms of pulsed, near-antiparallel reconnection in the prenoon and postnoon segments of the the dayside magnetopause (Sandholt and Farrugia, 2007). At this stage we remind the reader of the fact that the PMAFs are preceeded by 1–2 min long brightenings of auroral forms in the 09:00–10:30 and 13:00–15:00 MLT sectors (see e.g. Fig. 15). These auroral brightenings, occurring in regions of high plasma flow vor-ticity/flow shears, are taken to be the signature of efficient Birkeland current generation in the flank magnetopause boundary layer associated with reconnection pulses. The flank boundary layer is characterized by viscous shear stress and plasma vorticity. The latter is in fact a critical parameter for FAC generation on newly open field lines, as has been described by Sonnerup and Siebert (2003). There is a close association between plasma flow vorticity and Birkeland current intensity as demonstrated by Sofko et al. (1995) (see also Oksavik et al., 2006). Sofko et al. (1995), making the assumption that the changes in ionospheric conductivity are generally small, showed that the convection vorticity is a good indicator of FACs. Specifically, in this method, a clockwise vorticity is associated with an upward-directed Birkeland current.
In the present study we included the MABS as a third el-ement of the dayside auroral morphology which has
impor-NOFL 1
PMAFs / postnoon
NOFL 2
PMAFs / prenoon
NOFL 3
MABS
IMFDusk
Dawn
Y O =135o Zt
2(C)
t
2t
1(A)
t
1 1 3 2Fig. 17. Schematic view of solar wind-magnetosphere
interconnec-tion topology for a southeast directed IMF. The view is from the Sun. North is up and the dawn side to the left. S-shaped recon-nection X-line and the magnetic tension force on newly open field lines are indicated in the postnoon (1), prenoon (2) and subsolar (3) regions. Newly open (t1) and old open (t2) field lines are marked in the Northern Hemisphere. Insert in upper right corner shows the IMF direction (θ =135◦) in GSM Y-Z coordiates.
tant implications for magnetopause reconnection topology, in general, and FTEs, in particular. The phenomenon of MABS will be interpreted in terms of pulsed reconnection taking place in the subsolar region where magnetic shear and plasma flow configuration differ from that in the boundary layer away from noon on the prenoon and postnoon sides. It is natural to think that the midday auroral activity (cusp-type auroral brightenings recurring at 5–10 min intervals) is related to FTEs in the subsolar region, where reconnection for the actual IMF orientation (southeast/southwest) is of the component type (involving non-antiparallel fields). In many models and observational papers reconnection is con-sidered to take place along a tilted X-line running through the subsolar point and extending parallel and antiparallel to the local magnetopause current towards dusk/north (south) and dawn/south (north) for By>0 (By<0) (Gonzalez and Mozer, 1974; Sonnerup, 1984; Gosling et al., 1990; Taguchi et al., 1993; Wild et al., 2007). In the present discussion we shall apply the reconnection topology for southeast/west IMF ori-entations proposed in the theoretical work of Moore et al. (2002).
A schematic illustration of a possible reconnection topol-ogy for a southeast IMF orientation (clock angle = 135◦) is
shown in Fig. 17. Reconnection occurs along an S-shaped line running through the subsolar point (component recon-nection) and extending towards higher latitudes in the pre-and postnoon sectors where the fields are more antiparallel. Three newly reconnected (t1) field lines connecting to the
Northern Hemisphere have been marked 1, 2 and 3. The po-sitions of field lines 1 and 3 10–15 min after reconnection (t2)
are also marked. This is to illustrate the evolution of open field lines over the dayside magnetopause. In this sketch we combine the reconnection topology of Moore et al. (2002) and the FTE perspective of Rijnbeek et al. (1984). In their Fig. 4 Rijnbeek et al. (1984) indicate the geometry of FTE-related flux tubes in the prenoon, noon, and postnoon sectors for a southeast-directed IMF. In this paper we document the different auroral responses to FTEs appearing in these three sectors on the dayside magnetopause. We note that the re-connection geometry will be reversed for southwest IMF.
An outstanding feature of our auroral observations is the strongly attenuated aurora at noon (MABS) compared to the PMAFs/prenoon and PMAFs/postnoon. This we attribute to the correspondingly reduced strength of FACs and plasma vorticity at noon, due in turn to diminished flow shear there compared to that in the flank boundary layer (see Sonnerup and Siebert (2003)). This is consistent with our observation of the association of PMAFs and vortical flows at the iono-spheric level. Much less vorticity is observed at noon, asso-ciated with field line category 3 as indicated in the schematic Fig. 9.
Initial studies on the association between au-rora, FACs, and plasma convection for the case of PMAFs/postnoon/By>0 was reported by Lockwood et al. (1989) and Sandholt et al. (1990) (see also Lockwood et al., 2001). The plasma convection channel at the equator-ward side of the auroral brightening events were interpreted as a type of pulsed ionospheric flows (PIFs) related to the ionospheric closure of the system of currents flowing up and down along the field lines, as suggested by Southwood (1987). The momentum transfer to the neutral atmosphere is given by the Jp×B – force (Cowley, 2000). This model for momentum transfer in PMAFs has lately been confirmed by e.g. Oksavik et al. (2004a) and Marchaudon et al. (2004). In this paper we place this type of local observation in the larger context of the dayside auroral morphology and PMAF activities which include the asymmetries about noon for a given By polarity and the asymmetries caused by the IMF
Bypolarity at a given MLT.
At this point we return to our summary schematic illus-tration for By>0. By incorporating fine structure in the au-roral precipitation, Fig. 9 may be seen as an extension of previous work (Saflekos and Potemra, 1978; Cowley et al., 1991; Taguchi et al., 1993). The figure is based on the ob-servations of PMAF activity in the prenoon and postnoon sectors as well as the midday gap aurora with its brighten-ing sequence (MABS), as observed on 8 and 12 December 1999 (see Figs. 10 and 13). After the initial brightenings well
away from noon PMAFs/prenoon and PMAFs/postnoon (red arrows) both expand towards noon and, later in the event, forms are seen propagating poleward in the region where the plasma flow also contains a large northward component. The bright phase of PMAFs/prenoon and PMAFs/postnoon are accompanied by strong plasma flow vorticity as indicated in the schematic figure. The successive activations of three latitudinally separate forms in the case of PMAFs/prenoon are marked by the letters A, B, and C. The highest latitude form (C) is shown to extend well into mid-morning sector (09:00 MLT) as this form appears strongly during the in-terval 05:30–06:00 UT on 12 December 1999 (see Fig. 13). Plasma convection streamlines in the dusk (1) and dawn (2) – centered convection cells, as well as the zero-point poten-tial line (3) at noon, were marked in the figure. The magne-topause counterpart to these streamlines, in the form of newly open and more old open field lines, are marked by labels t1
(“newly open”) and t2(“old open”) in Fig. 17.
By suggesting this identification of the association be-tween the magnetopause and ionospheric parts of the M-I coupling during flux transfer events we shall be able to discuss the spatiotemporal structure of these solar wind-magnetosphere-ionosphere coupling events. A basic element in this interpretation is the following. We consider the evolu-tion of PMAFs activities in the prenoon and postnoon sectors to result from the evolution of “newly open” and “old open” field lines along plasma convection streamlines during mag-netopause reconnection events such as indicated schemati-cally in Figs. 9 and 17 for the positive IMF Bypolarity.
We conclude that the three auroral forms
(PMAFs/prenoon, MABS, PMAFs/postnoon) are
cou-pled to pulsed reconnection localized in the corresponding sectors on the magnetopause. The implication is that FTEs are much more geoeffective with respect to FAC/aurora excitation in the prenoon and postnoon sectors of the magnetopause as compared to the subsolar region. The strongly attenuated aurora at noon (MABS) corresponds to a less intense FAC generated at the subsolar magnetopause. It seems furthermore natural to explain this MLT dependence of Birkeland current/auroral intensity (minimum at noon) in terms of a corresponding difference in plasma vorticity in the magnetopause boundary layer in the respective MLT sectors, as indicated above. This is consistent with our ob-servation at the ionospheric level of strong plasma vorticity in association with PMAFs/prenoon and PMAFs/postnoon while much less vortical flow is observed at noon (near the zero-potential line in the flow pattern) where the midday gap aurora and the MABS are observed.
The concentration of open magnetic flux on the dawn side of the magnetosphere for By>0 is consistent with the de-flection of magnetosheath flow at the high latitude bound-ary layer obtained in the MHD simulation studies by Siscoe et al. (2000). The field-aligned currents labelled C1–C2 in Fig. 9 are related to the nonzero divergence of magnetopause current at high latitudes on the dawn side as discussed by
Taguchi et al. (1993). The Birkeland current – aurora rela-tionship for the By>0 case has been documented in a pre-vious study by Farrugia et al. (2003) during a traversal of spacecraft Polar along the 09:00 MLT meridian from the po-lar cap to plasma sheet latitudes, at mid-altitudes (see also Oksavik et al., 2004b; their Fig. 6). The electric field cou-pling from the solar wind to the ionosphere along the “old open” field lines is consistent with the theoretical discussion of Cowley (1981).
The C1–C2 FACs and the plasma convection channel on old open field lines (FC 2 in Fig. 9) are accompanied by the high-latitude stage of PMAFs (form C) as indicated in Fig. 9. This feature is an important element of the plasma convec-tion/precipitation asymmetry about noon induced by IMF
By. In this paper we documented the aurora-convection asso-ciation for the By>0 case and the FAC-aurora-convection as-sociation for the By negative case (PMAFs/By<0/postnoon; see Figs. 1 pluss DMSP F13 data in Fig. 6). The role of the polarization electric fields at auroral boundaries for the for-mation of the FC 2 channel of enhanced convection is em-phasized in this data set. On this point we refer to the in-terpretation of Marklund (1984) which is also summarized in Paschmann et al. (2002) (see their Figs. 6.3 and 6.4 and page 258). In our case (Figs. 5 and 6) the low conductiv-ity (auroral form C) on the polar cap side of the intense au-rora (forms A, B) leads to an enhancement in the electric field, which drives the Pedersen current closing the upward and downward Birkeland currents (the C1–C2 system in our case). The same type of E-field-enhancement adjacent to a bright arc is nicely illustrated in the rocket observations shown in Fig. 6.3 of Paschmann et al. (2002), taken from Marklund et al. (1982). In contrast to the anticorrelation arcs (A, B), the weak form C, which is accompanied by E-field enhancement, may be called a correlation arc.
In summary, the novel elements of this study are the fol-lowing:
(i) we establish a more comprehensive description of day-side auroral morphology applicable to southeast/west IMF which contains as three basic elements the PMAFs/prenoon, midday gap aurora (MABS), and PMAFs/postnoon, (ii) we discuss the implications of this extended perspective on the dayside aurora for M-I coupling associated with pulsed mag-netopause reconnection (FTEs) in the different MLT sectors, i.e., we draw inferences on the MLT-dependent geoeffective-ness (FAC/auroral intensity) of magnetopause FTEs (subso-lar region versus flanks), (iii) we document the association between the dayside auroral forms and large/medium-scale plasma convection cells/vorticity for both By positive and negative conditions, (iv) we classify PMAFs into four cat-egories according to the association with plasma convection cells (prenoon versus postnoon events) and By polarity, (v) we identify the effect of electric polarization on the high-latitude, polar cap convection channels near the boundary between weak mantle/polar rain-type precipitation and the more intense BPS-type arcs/bands (PMAFs/postnoon/By<0)
which are identified as a special type of evening correlation-anticorrelation arcs using the therminology of Marklund (1984).
A final remark on the spatio-temporal structure of the dayside aurora during magnetopause reconnection events (summarized in Fig. 9) in relation to the magnetopause re-connection process (Fig. 17) is appropriate. The noon-ward expansion of the auroral brightening events preceeding PMAFs/prenoon/postnoon/By>0/By<0 may indicate that the magnetopause reconnection events are initiated at the prenoon/postnoon flanks where the magnetic fields are most antiparallel during southeast/west IMF orientation and there-after expand towards the subsolar point. This important point needs further study and will be the topic of a separate paper.
Acknowledgements. We thank B. Lybekk and E. Trondsen for the
preparation of the optical data. We thank the SuperDARN team for the access to SuperDARN convection data. Access to DMSP F13 data were kindly provided by W. F. Denig. The optical observation program in Svalbard is supported by the Norwegian Research Coun-cil, Norwegian Polar Research Institute and AFOSR Task 2311AS. This work is supported in part by a NASA SEC-Guest Investigator grant and by NNG05GG25G as well as by NASA WIND/SWE and MFI grant.
Topical Editor I. A. Daglis thanks K. Oksavik and another anonymous referee for their help in evaluating this paper.
References
Cowley, S. W. H.: Magnetospheric and ionospheric flow and the interplanetary magnetic field, in: The Physical Basic of the Ionosphere in the Solar-Terrestrial System, no. 295 in Confer-ence Proceedings, pp. 4–1–4–12, AGARD (Advisory Group for Aerospace Research & Development), NATO, Neuilly sur Seine, France, 1981.
Cowley, S. W. H.: Magnetosphere-Ionosphere Interactions: A Tu-torial Review, in: Magnetospheric Current Systems, vol. 118 of Geophysical Monograph Series, pp. 91–106, AGU (American Geophysical Union), Washington D.C., USA, 2000.
Cowley, S. W. H., Morelli, J. P., and Lockwood, M.: Dependence of convective flows and particle precipitation in the high-latitude dayside ionosphere on the X and Y components of the interplan-etary magnetic field, J. Geophys. Res., 96, 5557–5564, 1991. Dandekar, B. S. and Pike, C. P.: The midday discrete auroral gap, J.
Geophys. Res., 83, 4227–4236, 1978.
Denig, W. F., Burke, W. J., Maynard, N. C., Rich, F. J., Jacobsen, B., Sandholt, P. E., Egeland, A., Leontjev, S., and Vorobjev, V. G.: Ionospheric signatures of dayside magnetopause transients: A case study using satellite and ground measurements, J. Geophys. Res., 98, 5969–5980, 1993.
Farrugia, C. J., Sandholt, P. E., Denig, W. F., and Torbert, R. B.: Observation of a correspondence between poleward-moving au-roral forms and stepped cusp ion precipitation, J. Geophys. Res., 103, 9309–9316, 1998.
Farrugia, C. J., Sandholt, P. E., Maynard, N. C., Torbert, R. B., and Ober, D. M.: Temporal variations in a four-sheet field-aligned current system and associated aurorae as observed during a Polar-ground magnetic conjunction in the midmorning sector,