HAL Id: hal-00297782
https://hal.archives-ouvertes.fr/hal-00297782
Submitted on 10 Aug 2005HAL is a multi-disciplinary open access
archive for the deposit and dissemination of sci-entific research documents, whether they are pub-lished or not. The documents may come from teaching and research institutions in France or abroad, or from public or private research centers.
L’archive ouverte pluridisciplinaire HAL, est destinée au dépôt et à la diffusion de documents scientifiques de niveau recherche, publiés ou non, émanant des établissements d’enseignement et de recherche français ou étrangers, des laboratoires publics ou privés.
The relationship between ammonia emissions from a
poultry farm and soil NO and N2O fluxes from a
downwind source
U. Skiba, J. Dick, R. Storeton-West, S. Fernades-Lopez, C. Wood, S. Tang, N.
van Dijk
To cite this version:
U. Skiba, J. Dick, R. Storeton-West, S. Fernades-Lopez, C. Wood, et al.. The relationship between ammonia emissions from a poultry farm and soil NO and N2O fluxes from a downwind source. Bio-geosciences Discussions, European Geosciences Union, 2005, 2 (4), pp.977-995. �hal-00297782�
BGD
2, 977–995, 2005Ammonia deposition and N trace gas
emissions U. Skiba et al. Title Page Abstract Introduction Conclusions References Tables Figures J I J I Back Close
Full Screen / Esc
Print Version Interactive Discussion EGU Biogeosciences Discussions, 2, 977–995, 2005 www.biogeosciences.net/bgd/2/977/ SRef-ID: 1810-6285/bgd/2005-2-977 European Geosciences Union
Biogeosciences Discussions
Biogeosciences Discussions is the access reviewed discussion forum of Biogeosciences
The relationship between ammonia
emissions from a poultry farm and soil NO
and N
2
O fluxes from a downwind source
U. Skiba1, J. Dick1, R. Storeton-West1, S. Fernades-Lopez2, C. Wood3, S. Tang1, and N. van Dijk1
1
Centre for Ecology and Hydrology (CEH) Edinburgh, Bush Estate, Penicuik, Midlothian EH26 0QB, UK
2
Dpto. Qu´ımica y An´alisis Agr´ıcola-E.T.S.I. Agr´onomos de Madrid, Ciudad Universitaria s/n, 28040 Madrid, Spain
3
CEH Lancaster, Lancaster Environment Centre, Library Avenue, Bailrigg, Lancaster, LAI1 4AP, UK
Received: 6 July 2005 – Accepted: 27 July 2005 – Published: 10 August 2005 Correspondence to: U. Skiba ([email protected])
BGD
2, 977–995, 2005Ammonia deposition and N trace gas
emissions U. Skiba et al. Title Page Abstract Introduction Conclusions References Tables Figures J I J I Back Close
Full Screen / Esc
Print Version
Interactive Discussion
EGU
Abstract
Intensive livestock farms emit large concentrations of NH3, most of which is deposited very close to the source. The presence of trees enhances the deposition. Rates to down wind forests can exceed 40 kg N ha−1. The steep gradient in large NH3 concen-tration and deposition at the edge of a downwind forest to background concenconcen-trations
5
within a few hundred meters provides an ideal site to study the effect of different rates of N deposition on biological and chemical processes under similar environmental con-ditions. We have investigated the effect of different rates of NH3 deposition (62, 45, 24 and 5 kg NH3-N ha−1y−1) on the flux of NO and N2O from soil in a mixed wood-land downwind of a large poultry farm (160 000 birds) in Scotwood-land, which has been
10
operating for about 40 years. Measurements were carried out for a 6 month period, with hourly NO flux measurements, daily N2O fluxes close to the farm and monthly at all sites and monthly cumulative wet and dry N deposition. The increased NH3and NH+4 deposition to the woodland increased emissions of NO and N2O and soil available NH+4 and NO−3 concentrations. Average NO and N2O fluxes measured 15, 25 and 45 m
15
downwind of the farm were 111.2±41.1, 123.3±40.7, 38.3±28.8 µg NO-N m−2h−1and 9.9±7.5, 34.3±33.3 and 21.2±6.1 µg N2O-N m−2h−1, respectively. At the background site 270 m downwind the N2O flux was reduced to 1.75±2.1 µg N2O-N m−2h−1. NO emissions were significantly influenced by seasonal and daily changes in soil temper-ature and followed a diurnal pattern with maximum emissions approximately 3 h after
20
noon. For N2O no consistent diurnal pattern was observed. Changes in soil moisture content had a less clear effect on the NO and N2O flux. On average the NO emissions expressed as a fraction of the elevated N deposited were 7.1% (at 15 m), 6% (at 25 m) and 2.3% (at 45 m) downwind of the farm, whereas for N2O the emissions were only 2.8% (at 15 m), 3% (at 25 m) and 3% (at 45 m) downwind. These emission fractions
25
exceed the emission factor of 1% advised by the IPCC for N2O emissions resulting from atmospheric N deposition.
BGD
2, 977–995, 2005Ammonia deposition and N trace gas
emissions U. Skiba et al. Title Page Abstract Introduction Conclusions References Tables Figures J I J I Back Close
Full Screen / Esc
Print Version
Interactive Discussion
EGU
1. Introduction
The deposition of nitrogen (N) to the soil has increased since the industrial revolu-tion and now ranges from less than 5 kg N ha−1y−1 in pristine environments to over 80 kg N ha−1y−1in the most polluted locations of Europe (Fowler et al., 2004). In many areas N deposition is dominated by reduced N, NH3(ammonia) and NH+4 (ammonium),
5
which together contribute to 60% of the total annual emission rate in the UK (Fowler et al., 2004). Most of the reduced N is deposited over a much shorter distance than oxidised N, and for islands like the UK the export of NH3to other countries is negligible. The livestock industry is the single largest source of NH3and intensive livestock farms create significant local hotspots of elevated atmospheric NH3concentrations (Theobald
10
et al., 2004). The rate of deposition is dependent on the downwind land use and the surface roughness. Deposition rates to a forest can be 2 to 3 fold larger than to shorter vegetation (Fowler et al., 2004). Fowler et al. (1998) have shown that over 60% of the elevated NH3emitted was deposited to a downwind forest within 50 m, but declined to background concentrations within a few hundred meters. The high rates of N deposited
15
to the forest floor increased the N content of the plant tissues and the soil and also soil emissions of N2O (nitrous oxide) and NO (nitric oxide) (Pitcairn et al., 1998; Skiba et al., 2004). Such high emissions will eventually result in changes in the forest floor plant communities to nitrogen tolerant species (Pitcairn et al., 1998). The steep gradient of NH3 deposition rates does provide an ideal opportunity to study the effect of different
20
rates of N deposition on biological and chemical processes under similar climatic con-ditions. In this paper we have concentrated on the significance of an intensive poultry farm for increased downwind emissions of the atmospheric pollutants NO and N2O.
2. Site description and methods
Measurements were made in mixed woodland downwind of a large poultry farm in
25
BGD
2, 977–995, 2005Ammonia deposition and N trace gas
emissions U. Skiba et al. Title Page Abstract Introduction Conclusions References Tables Figures J I J I Back Close
Full Screen / Esc
Print Version
Interactive Discussion
EGU The poultry farm grows broilers in 8 sheds (63 m long), each containing 20 000 birds
on a 40-day cycle. The sheds are arranged in parallel pointing from NNW to SSE. The prevailing wind direction is from the SW. The edge of this farm borders onto the woodland located on freely drained brown earth (pH 3.2 in CaCl2, 9.5% C and 0.44% N), containing a mixture of pine and birch with undergrowth of grasses in the sunnier
5
parts and brambles, ferns and mosses dominant in the shadier parts.
Four sites were established at increasing distance downwind from the centre of the closest of the poultry sheds. The closest site (A) was established at the edge of the woodland at 15 m directly opposite the centre of the shed. The second site (B) was installed 17 m away from A and 15 m opposite the downwind edge of the poultry shed,
10
and therefore was 25 m downwind of the centre of the farm building. Site C was lo-cated 18 m east of site A and 45 m downwind from the centre of the poultry shed. A “background” site (D) was installed 270 m downwind of the farm (NW).
Monthly concentrations of atmospheric NH3 and NO2 were monitored using con-tinuous time-integrated sampling with passive diffusion samplers. Triplicate ALPHA
15
samplers for NH3 and triplicate diffusion tubes for NO2 were installed at a height of 1.5 m at all sites and were prepared and analysed according to standard protocols de-veloped at CEH (Tang et al., 2001). Throughfall containers (2 per site) containing the biocide thymol collected rainwater falling through the tree canopy over a 0.2 m2 area at sites A-C. At the background site D 3 rainfall collectors (0.035 m2) were installed at
20
a height of 1.5 m. Throughfall and rainfall samples were bulked to provide a monthly sample analysed for NH+4 and NO−3 concentrations by standard colorimetric methods.
For manual N2O measurements by the static chamber approach, two small round polypropylene chambers (31 l) (MacDonald et al., 1997) were installed. Fluxes were measured at roughly monthly intervals, by closing the chambers for 1 h periods.
Sam-25
ples were collected by syringe and stored in Tedlar bags until analysis within 3 days of sample collection, by gas chromatography using an electron capture detector (ECD). A daily sample of the N2O flux was obtained from an automatically closing chamber (1 m2, 130 l) positioned between site A and B, 20 m downwind of the centre point of the
BGD
2, 977–995, 2005Ammonia deposition and N trace gas
emissions U. Skiba et al. Title Page Abstract Introduction Conclusions References Tables Figures J I J I Back Close
Full Screen / Esc
Print Version
Interactive Discussion
EGU shed, and is described in detail by Kitzler et al. (2005). Chambers were closed for
one-hour periods every midday and samples were stored in glass vials for up to 14 days prior analysis for N2O by gas chromatography using an ECD detector. Routine tests showed that over the two-week period concentrations of 1 ppm N2O did not deteriorate inside the vials.
5
NO fluxes were measured by the dynamic chamber approach. At the three clos-est sites (A-C) 2 square automatically closing dynamic PTFE chambers (18 l) were installed for hourly NO, NO2 and O3flux measurements. The chamber system is de-scribed in detail by Pilegaard et al. (1999). Two small fans stirred the air in each chamber. Upon closure ambient air from a single location, and 1 m above the soil
sur-10
face, was pushed through the chamber at a rate of 11 l min−1. At the opposite chamber outlet the combined pump pressure of the NOxand O3analysers drew air into the anal-ysers at a rate of 2 l min−1. One minute average NO, NO2and O3concentrations were recorded on a 23x Campbell data logger. These data could be viewed and downloaded online via a modem. The analysers, logger and pumps were housed in a waterproof
15
powered shed.
The chambers closed in sequence for 8 min in the order Site A, Site B, a blank cham-ber fitted with PTFE bottom adjacent to the two chamcham-bers at site B and then site C. In the remaining 4 min of every hour ambient air was analysed for NOxand O3. In order to avoid long residence times of unstable gases in the supply lines (6 mm bore), these
20
were kept to a maximum, but same length of 20 m. This maximum distance between chambers and analysers also determined the distances between the 3 transect sites. Unfortunately the fourth site was too far to be connected to the automated NOx flux measurement system and the power supply. Fluxes were calculated from the concen-tration difference between the chamber and blank chamber, the flow rate of air through
25
the chamber and the surface area of the chamber. The chemical reactions of NO with O3 inside the chambers were taken into account, as described by Butterbach-Bahl et al. (1998).
BGD
2, 977–995, 2005Ammonia deposition and N trace gas
emissions U. Skiba et al. Title Page Abstract Introduction Conclusions References Tables Figures J I J I Back Close
Full Screen / Esc
Print Version
Interactive Discussion
EGU and soil moisture by theta probe (Delta T) were made continuously. Fifteen-minute
averages were stored on a Campbell 21x data logger. The theta probe voltage mea-surements were converted to volumetric moisture contents, using conversion factors established for the study soil, rather than using the company’s standard calibration fac-tors. Soils were analysed for KCl extractable (1 M) NH+4 and NO−3 concentrations in the
5
surface 10 cm twice during the measurement period.
3. Results
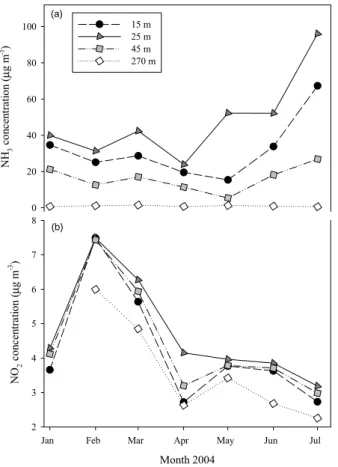
The monthly NH3 concentrations measured at the three sites close to the farm were on average 20 to 40 times larger than at the background site, 270 m away (Fig,. 1a). Largest NH3 concentrations were measured at site B, which is further away from the
10
centre of the farm building (25 m downwind of the farm) than site A; but due to its position in relation to the farm building and the prevailing SW wind direction receives the plume from all farm vents, whereas site A only receives the plume from 50% of the farm vents. This difference was reflected in the NH3concentration measurements (Fig. 1a). Average concentrations for the three sites 15, 25 and 45 m downwind were
15
34.3±20.4, 47.6±24.9 and 21.7±16.8 µg NH3m−3. Background concentrations at the site 270 m downwind were 1.15±0.7 µg NH3m−3.
The NO2concentrations did not differ between the three sites closest to the farm, but they were all slightly larger compared to the background site (Fig. 1b). This could sim-ply reflect the frequent traffic of vehicles to the farm, which did not occur at the more
re-20
mote background site. The average annual concentrations at sites A–C were 3.9±1.4, 4.3±1.3, 4.1±1.3 µg NO2m−3 and at the background site 3.1±1.4 µg NO2m−3.
Rates of NH3deposition to the forest floor were calculated using concentration de-pendent deposition velocities for NH3 as described by Fowler et al. (1998), and a de-position velocity of 1.5 mm s−1 was applied for NO2 (Duyzer, pers. comm.). Average
25
NH3deposition rates close to the farm were calculated at 62, 42, 23 kg NH3-N ha−1y−1 compared to the background deposition rates of 5 kg NH3-N ha−1y−1(Table 1).
BGD
2, 977–995, 2005Ammonia deposition and N trace gas
emissions U. Skiba et al. Title Page Abstract Introduction Conclusions References Tables Figures J I J I Back Close
Full Screen / Esc
Print Version
Interactive Discussion
EGU Cumulative NH+4 concentrations in throughfall were at least 6 times larger than those
in rainwater and followed the same pattern observed for NH3, with largest concen-trations measured at site B, 25 m downwind, and smallest at site C, 45 m downwind (Table 1). The ranking order of NH4 concentrations, site B > site A > site C, was observed in most months. Nitrate concentrations in throughfall were at least 2 times
5
larger than in rainfall, however differences between sites were negligible.
In this forest the dry deposition of NH3was more important than the wet deposition of NH+4. A two fold difference between NH3deposition and the rate of NH+4 deposition was observed at the sites closest to the farm (A & B). This difference was reduced to a 1.5 fold difference at the site C further away from the farm. The relationship between the
10
NH+4 concentration in the throughfall and dry deposition of NH3was linear and highly correlated, with r2>90% for the two sites closest to the farm (A & B).
The increased rate of N deposition to the woodland was reflected in the soil avail-able NH+4 and NO−3 concentrations, measured on one occasion (31 March 2004). The same pattern as observed for the deposition rates, with largest concentrations at site B
15
(25 m), followed by site A (15 m) and then C (45 m) was followed. The soil extractable NH+4 and NO−3 concentrations were 6.8±6.0, 10.3±4.1, 3.2±1.9 µg NH+4-N g−1dry soil and 3.0±1.5, 9.9±5.3, 0.5±0.4 µg NO−3-N g−1dry soilat site A, B and C with n=6, 9, 6, respec-tively.
The increased mineral N concentrations along this NH3deposition gradient provide
20
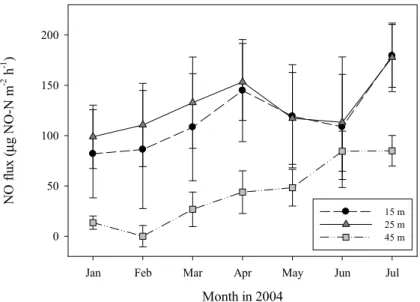
the substrate for the nitrifying and denitrifying microbes, and consequently have in-creased the emissions of NO and to a lesser extent N2O (Figs. 2 and 3). Average NO concentrations for the entire study period for site A, B and C were 111.2±41.1, 123.3±40.7, 38.3±28.8 µg NO-N m−2h−1. The differences between the three sites were statistically significant at p<0.001. Daily NO emissions at site A and B were larger
25
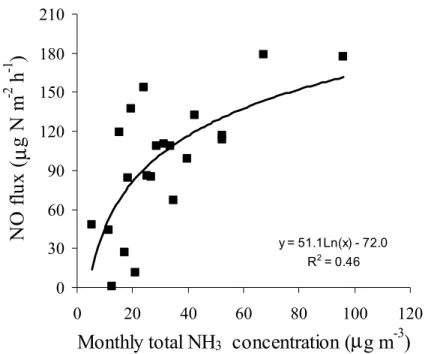
than those measured at site C on 93% and 95% of the 190 days for which flux mea-surements could be calculated, respectively. Fluxes measured at site B were larger than those measured at site A on 69% of the 190 days. The relationship between the monthly average NO flux and monthly cumulative NH3concentration was log linear and
BGD
2, 977–995, 2005Ammonia deposition and N trace gas
emissions U. Skiba et al. Title Page Abstract Introduction Conclusions References Tables Figures J I J I Back Close
Full Screen / Esc
Print Version
Interactive Discussion
EGU significant (p<0.001) (Fig. 4).
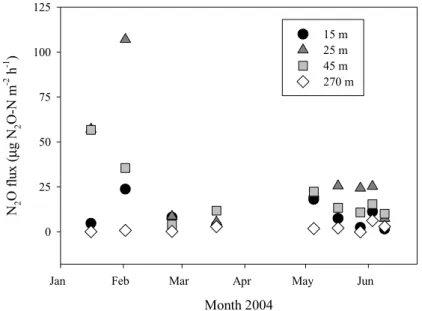
For N2O average fluxes for the 8 measurements were 9.9±7.5, 34.3±33.3, 21.2±6.1 and 1.8±3.5 µg N2O-N m−2h−1for site A, B, C and the background site D respectively. Standard deviations of the mean were large due to temporal and spatial variability. At site B largest flux rates were measured and at site C occasional negative fluxes of N2O,
5
indicating N2O uptake, were measured (Fig. 3). None of these differences were statis-tically significantly. Fluxes at site C were larger than those at site A, possibly caused by the slightly wetter soil conditions at site C. Average soil moisture contents for site C were 35.1±6.2 g g−1dry wt and at sites A and B 31.3±2.3 g g−1dry wtand 31.9±5.2 g g−1dry wt, respectively.
10
Nitric oxide concentrations were significantly influenced by daily and seasonal tem-perature changes. NO emissions followed a diurnal pattern with maximum emissions approximately 3 h after noon (Fig. 5). The oscillation frequency was much larger for locations where large NO fluxes were measured compared to locations where the NO flux was small. Daily average NO fluxes, correlated significantly with daily average soil
15
temperatures measured at the soil surface and 2, 5 and 10 cm below the soil surface. The daily average soil temperature ranged between −1 and 13◦C at the soil surface and between 4.3 and 11.7◦C at a soil depth of 10 cm. For NO the correlations were sig-nificant at p>0.001 at all soil depths. Best linear correlations were observed between NO flux and the soil surface temperature and a depth of 2 cm depth for plots at site A
20
and B. At site C however best correlations were obtained with soil temperatures at 5 and 10 cm depth. The linear relationships between the inverse absolute soil tempera-ture and the natural logarithm of the NO flux at site A and B provided r2values of 46% and 24% (n=186) and activation energies, calculated from the slope of the relationship, of 59 and 33 kJ mol−1. For site C the r2was 39.4% (n=234) and the activation energy
25
was 140 kJ mol−1. For N2O the relationship with soil temperature at all depth was not significant and no diurnal pattern was observed.
The soil moisture content for the entire study period varied between 16 and 63% (v/v). A linear relationships between NO flux and soil moisture content was only
ob-BGD
2, 977–995, 2005Ammonia deposition and N trace gas
emissions U. Skiba et al. Title Page Abstract Introduction Conclusions References Tables Figures J I J I Back Close
Full Screen / Esc
Print Version
Interactive Discussion
EGU served at site C where NO emissions decreased with increasing soil moisture content
(r2=0.001). For N2O fluxes measured by static and auto chambers no linear relation-ship with soil moisture was observed. However, fluxes >27 µg N2O-N m−2h−1 were only observed at soil moisture contents above 30% (v/v).
4. Discussion 5
We have shown that point source emissions of NH3 significantly increased the rate of NH3 deposition to the close by woodland. Ammonia concentrations measured in-side the woodland downwind of the farm were between 20 and 40 times larger than the background concentrations of 1.15 µg m−3 at 270 m downwind. The background concentrations are within the range of concentrations measured and modelled for UK
10
agricultural fields (Dragosits et al., 2002); and the FRAME (Fine Resolution Atmo-spheric Multi-species Exchange, Singles et al., 1998) model output for the 5 km grid square in which the study farm is situated, estimated a grid average NH3concentration of 1.32 µg m−3. Similar elevated NH3 concentrations and relatively fast decay rates over a short distance (<300 m) have been observed at several woodlands downwind of
15
intensive poultry and pig farms (e.g. Theobald et al., 2004; Spangenberg and K ¨olling, 2004) and also downwind of an artificial NH3release source over an ombrotrophic bog (Leith et al., 2004). Thus a shelterbelt can be ideal in not only screening an unsightly animal farm from the public, but also by creating a biological filter, which contains the pollution to a small local area. The side effect, however, is that the enhanced N
deposi-20
tion increases the emission of the atmospheric pollutants N2O and NO and increases the risk of loss or change in biodiversity. Pitcairn et al. (1998) have reported a preva-lence of N loving species and lack of N sensitive species close to the poultry farm discussed in this paper. Due to the close distance to this very large NH3point source, the total N deposition is dominated by dry deposition of NH3rather than wet deposition
25
BGD
2, 977–995, 2005Ammonia deposition and N trace gas
emissions U. Skiba et al. Title Page Abstract Introduction Conclusions References Tables Figures J I J I Back Close
Full Screen / Esc
Print Version
Interactive Discussion
EGU under NOFRETETE (Pilegaard et al., 20051). Both studies have shown strong
rela-tionships between N deposition and NO emission. A linear relationship between NO flux and wet deposition of N was observed for the coniferous forests of the European transect studied in the NOFRETETE project (Pilegaard et al., 20051). For this forest downwind of the poultry farm, where environmental variations are minimal in
compar-5
ison to the European transect, a log linear relationship was demonstrated (Fig. 4). In addition to nitrogen the most important variables that influenced NO emission rates were soil moisture and soil temperature. The literature supports the observations, that NO increased linearly with increased soil temperature, but decreased with increasing soil moisture content (Kitzler et al., 2005; van Dijk and Duyzer, 1999; Skiba et al.,
10
1997).
For both studies, the European transect studied in the NOFRETETE project (Pile-gaard et al., 20051) and the forest downwind of the poultry farm, relationships between N deposition rate and N2O emission were very weak. For the poultry farm also rela-tionships between N2O flux and soil moisture and soil temperature changes were much
15
weaker than for NO. Possible reasons are the data set for N2O in this study is much smaller than for NO (monthly rather than hourly data), but perhaps more importantly, the environmental variables, particularly the redox potential of the soil, most commonly measured by the surrogates soil moisture or water filled pore space, exert a stronger control on N2O than NO.
20
Overall the NO and N2O emissions downwind of this poultry farm were larger than the maximum annual emissions calculated for the European transect (Pilegaard et al., 20051). Downwind of the poultry farm maximum emissions for the study period were 123 µg NO-N m−2h−1and 34.3 µg N2O-N m−2h−1compared to 75 and 81 µg
NO-1
Pilegaard, K., Skiba, U., Ambus, P., Beier, C., Bruggemann, N., Butterbach-Bahl, K., Dick, J., Dorsey, J., Duyzer, J., Gallagher, M.,Gasche, R.,Horvath, L., Kitzler, B., Leip, A., Pihlatie, M. K., Rosenkranz, P., Seufert, G., Vesala, T., Westrate, H., and Zechmeister-Boltenstern, S.: Nitrogen load and forest type determine the soil emission of nitrogen oxides (NO and N2O), Biogeosciences Discuss., in preparation, 2005.
BGD
2, 977–995, 2005Ammonia deposition and N trace gas
emissions U. Skiba et al. Title Page Abstract Introduction Conclusions References Tables Figures J I J I Back Close
Full Screen / Esc
Print Version
Interactive Discussion
EGU N m−2h−1in the Dutch and south German coniferous forests and 20 µg N2O-N m−2h−1
in the Hungarian and Italian forests.
On average the NO emissions expressed as a fraction of the elevated N deposited were 7.1% (at 15 m), 6% (at 25 m) and 2.3% (at 45 m) downwind of the farm, whereas for N2O the emissions were only 2.8% (at 15 m), 3% (at 25 m) and 3% (at 45 m)
down-5
wind. These emission fractions greatly exceed the emission factor of 1% advised by the IPCC for N2O emissions resulting from atmospheric N deposition (Houghton et al., 2001). Even at the background site, 270 m downwind of the farm the N2O emissions accounted for 1.6% of the N deposition.
5. Conclusions 10
This study has shown that increased atmospheric nitrogen deposition rates increased the emissions of NO and N2O. For N2O the rate of increase was larger than predicted by the IPCC (Houghton et al., 2001).
Although the emission rates of atmospheric pollutants downwind of intensive NH3 emitting livestock farms were large, the contribution to the total national NO and N2O
15
emissions are negligible. If we assume the conditions and emission factors observed in this study are true for the entire British poultry flock (360 million), which emits 28 kt NH3y−1(calculated from standard NH3emission factors for poultry manure); then intensive poultry farming will contribute an additional 36 t NO-N y−1and 10 t N2O-N y−1. This is only a small percentage of the total NO (7 kt NO-N y−1) and N2O (56 kt N2
O-20
N y−1) emitted from British soils (Skiba et al., 2001).
Acknowledgements. We wish to thank the farmer for electricity supply and access to the farm,
G. Rutherford, A. Horsburgh and D. McEwan for their help in installing and dismantling the field experiment, L. Love for assistance in preparation and chemical analysis of passive NH3 and NO2 samplers and J. Dorsey and M. Gallagher, University of Manchester, for providing
25
the NO auto chambers and control unit. This work was part of the EU project NOFRETETE EVK2-CT2001-00106.
BGD
2, 977–995, 2005Ammonia deposition and N trace gas
emissions U. Skiba et al. Title Page Abstract Introduction Conclusions References Tables Figures J I J I Back Close
Full Screen / Esc
Print Version
Interactive Discussion
EGU
References
Butterbach-Bahl, K., Gasche, R., Huber, C., Kreutzer, K., and Papen, H.: Impact of N-input by wet depostion on N-trace gas fluxes and CH4-oxidation in spruce forest ecosystems of the temperate zone in Europe, Atmos. Environ., 32, 3, 559–564, 1998.
Dragosits, U., Theobald, M. R., Place, C. J., Lord, E., Webb, J., Hill, J., ApSimon, H. M., and
5
Sutton, M. A.: Ammonia emission, deposition and impact assessment at the field scale: a case study of sub-grid spatial variability, Environ. Pollution, 117, 1147–158, 2002.
Fowler, D., O’Donoghue, M., Muller, J. B. A., Smith, R. I., Dragosits, U., Skiba, U., Sutton, M., and Brimblecombe, P.: A chronology of nitrogen deposition in the UK between 1900 and 2000, Water air and soil pollution: Focus, 4, 9–23, 2004.
10
Fowler, D., Skiba, U., Nemitz, E., Choubedar, F., Branford, D., Donovan, R., and Rowland, P.: Measuring aerosols and heavy metal deposition on urban woodland and grass using inventories of210Pb and metal concentrations in soil, Water, Air and Soil Pollution: Focus, 4, 483–499, 2004.
Fowler, D., Pitcairn, C. E. R., Sutton, M. A., Flechard, C., Loubet, B., Coyle, M., and Munro, R.
15
C.: The mass budget of atmospheric ammonia in woodland within 1 km of livestock buildings, Environ. Pollution 102, 343–348, 1998.
Houghton, J. T., Meira Filho, L. G., Lim, B., Treanton, K., Mamaty, I., and Bonduki, Y.: Revised 1996 IPCC Guidelines for National Greenhouse Gas Inventories, Reference Manual Vol3, edited by: Griggs, D. J. and Callender, B. A., IPCC/OECD/IEAUK Meteorological Office,
20
Bracknell, 2001.
Kitzler, B., Zechmeister-Boltenstern, S., Holtermann, C., Skiba, U., and Butterbach-Bahl, K.: Nitrogen oxides emission from two beech forests subjected to different nitrogen loads, Bio-geosciences Discuss., in press, 2005.
Leith, I. D., Sheppard, L. J., Fowler, D., Cape, J. N., Jones, M., Crossley, A., Hargreaves,
25
K. J., Tang, S. Y., Theobald, M., and Sutton, M. A.: Quantifying dry NH3 deposition to an ombrotrophic bog from an automated NH3 field release system, Water Air and Soil Pollution: Focus, 4, 207–218, 2004.
MacDonald, J. A., Skiba, U. M., Sheppard, L. J., Ball, B., Roberts, J. D., Smith, K. A., and Fowler, D.: The effect of nitrogen deposition and seasonal variability on methane oxidation
30
and nitrous oxide emission rates in an upland spruce plantation and moorland, Atmos. Envi-ron., 31, 3693–3706,1997.
BGD
2, 977–995, 2005Ammonia deposition and N trace gas
emissions U. Skiba et al. Title Page Abstract Introduction Conclusions References Tables Figures J I J I Back Close
Full Screen / Esc
Print Version
Interactive Discussion
EGU Pilegaard, K., Hummelshøj, P., and Jensen, N. O.: Nitric oxide emission from a Norway spruce
forest floor, J. Geophys. Res., 104, 3433–3445, 1999.
Pitcairn, C. E. R., Leith, I. D., Sheppard, L. J., Sutton, M. A., Fowler, D., Munro, R. C., Tang, S., and Wilson, D.: The relationship between nitrogen deposition, species composition and foliar nitrogen concentrations in woodland flora, Environ. Pollution, 102, 41–48, 1998.
5
Singles, R., Sutton, M. A., and Weston, K. J.: A multi-layer model to describe the atmospheric transport and deposition of ammonia in Great Britain, Atmos. Environ., 32, 393–399, 1998. Skiba, U., Fowler, D., and Smith, K. A.: Nitric oxide emissions from agricultural soils in
tem-perate and tropical climates: sources, control and mitigation options, Nutrient Cycling in Agroecosys., 48, 75–90, 1997.
10
Skiba, U., Sheppard, L., Pitcairn, C. E. R., Leith, I., Crossley, A., van Dijk, S., Kennedy, V. H., and Fowler, D.: Soil nitrous oxide and nitric oxide emissions as indicators of elevated atmospheric N deposition rates in seminatural ecosystems, Environ. Pollution, 102 , 457– 461, 1998.
Skiba, U., Sozanska, M., Metcalfe, S., and Fowler, D.: Spatially disaggregated inventories of
15
soil NO and N2O emissions for Great Britain. Water Air and Soil Pollution, 1, 109–118, 2001. Spangenberg, A. and K ¨olling, C.: Nitrogen deposition and nitrate leaching at forest edges
exposed to high ammonia emissions in southern Bavaria, Water, air and soil pollution, 152, 233–255, 2004.
Stohl, A., Williams, E., Wotawa, G., and Kromp-Kolb, H.: A European inventory of soil nitric
20
oxide emissions and the effect of these emissions on the photochemical formation of ozone, Atmos. Environ. 30, 3741–3755, 1996.
Tang, Y. S., Cape, J. N., and Sutton, M. A.: Development and types of passive samplers for monitoring atmospheric NO2 and NH3 concentrations, The Scientific World, 1, 513–529, 2001.
25
Theobald, M., Dragosits, U., Place, C. J., Smith, J. U., Sozanska, M., Brown, L., Scholefield, D., Del Prado, A., Webb, J., Whitehead, P., Angus, A., Hodge, I. D. , Fowler, D., and Sutton, M. A.: Modelling nitrogen fluxes at the landscape scale, Water, Air and Soil Pollution: Focus, 4, 135–142, 2004.
van Dijk, S. M. and Duyzer, J. H.: Nitric oxide emissions from forest soils, J. Geophys. Res.,
30
BGD
2, 977–995, 2005Ammonia deposition and N trace gas
emissions U. Skiba et al. Title Page Abstract Introduction Conclusions References Tables Figures J I J I Back Close
Full Screen / Esc
Print Version
Interactive Discussion
EGU
Table 1. Dry and wet N deposition to a mixed forest downwind of an NH3emitting poultry farm. Average of monthly cumulative samples (January–June 2004).
Distance from farm NH3-N NO2-N NH4-N NO3-N
kg N ha−1y−1 kg N ha−1y−1 kg N ha−1y−1 kg N ha−1y−1 m mean stdev mean stdev mean stdev mean stdev
15 42.62 24.59 0.46 0.06 22.10 11.82 2.96 1.57 25 62.13 32.29 0.54 0.06 27.29 19.65 3.23 2.12 45 23.43 12.53 0.48 0.05 15.05 7.63 4.41 2.36 270 5.26 4.51 0.35 0.08 2.40∗ 1.36 1.43∗ 1.01 ∗ concentrations in rainwater
BGD
2, 977–995, 2005Ammonia deposition and N trace gas
emissions U. Skiba et al. Title Page Abstract Introduction Conclusions References Tables Figures J I J I Back Close
Full Screen / Esc
Print Version Interactive Discussion EGU NH 3 co nc en tr ati on (µ g m -3) 0 20 40 60 80 100 15 m 25 m 45 m 270 m Month 2004
Jan Feb Mar Apr May Jun Jul
NO 2 co ncen tr at io n ( µ g m -3 ) 2 3 4 5 6 7 8 (a) (b) Figure 1
Fig. 1. Concentrations of dry deposited NH3(a) and NO2(b) downwind of the poultry farm.
BGD
2, 977–995, 2005Ammonia deposition and N trace gas
emissions U. Skiba et al. Title Page Abstract Introduction Conclusions References Tables Figures J I J I Back Close
Full Screen / Esc
Print Version
Interactive Discussion
EGU
Month in 2004
Jan Feb Mar Apr May Jun Jul
N O f lux (µ g N O -N m -2 h -1 ) 0 50 100 150 200 15 m 25 m 45 m Figure 2 Month 2004
Jan Feb Mar Apr May Jun
N2 O flux (µ g N 2 O-N m -2 h -1 ) 0 25 50 75 100 125 15 m 25 m 45 m 270 m Figure 3
Fig. 2. Average monthly NO fluxes from hourly data of two automatically closing flow through
chambers per site. The bars show standard errors of the temporal and spatial variability.
BGD
2, 977–995, 2005Ammonia deposition and N trace gas
emissions U. Skiba et al. Title Page Abstract Introduction Conclusions References Tables Figures J I J I Back Close
Full Screen / Esc
Print Version
Interactive Discussion
EGU
Month in 2004
Jan Feb Mar Apr May Jun Jul
N O f lux (µ g N O -N m -2 h -1 ) 0 50 100 150 200 15 m 25 m 45 m Figure 2 Month 2004
Jan Feb Mar Apr May Jun
N2 O flux ( µ g N 2 O-N m -2 h -1 ) 0 25 50 75 100 125 15 m 25 m 45 m 270 m Figure 3
Fig. 3. Nitrous oxide emission downwind of the poultry farm; average fluxes from 2 manual
BGD
2, 977–995, 2005Ammonia deposition and N trace gas
emissions U. Skiba et al. Title Page Abstract Introduction Conclusions References Tables Figures J I J I Back Close
Full Screen / Esc
Print Version Interactive Discussion EGU y = 51.1Ln(x) - 72.0 R2 = 0.46 0 30 60 90 120 150 180 210 0 20 40 60 80 100 120
Monthly total NH
3concentration (
µ
g m
-3)
N
O
flu
x (
µ
g N
m
-2h
-1)
Figure 4 day 144 day 143 day 145 Julian day in 2004 0 6 12 18 24 6 12 18 24 6 12 18 24 N O flux (µ g N O -N m -2 h -1 ) 25 50 75 100 125 150 175 200 15 m 25 m 45 m Figure 5Fig. 4. The relationship between monthly average NO flux and NH3concentrations at the three transect sites downwind of the poultry farm.
BGD
2, 977–995, 2005Ammonia deposition and N trace gas
emissions U. Skiba et al. Title Page Abstract Introduction Conclusions References Tables Figures J I J I Back Close
Full Screen / Esc
Print Version Interactive Discussion EGU y = 51.1Ln(x) - 72.0 R2 = 0.46 0 30 60 90 120 150 180 210 0 20 40 60 80 100 120
Monthly total NH3 concentration (µg m-3)
N O flu x ( µ g N m -2 h -1 ) Figure 4 day 144 day 143 day 145 Julian day in 2004 0 6 12 18 24 6 12 18 24 6 12 18 24 N O flux ( µ g N O -N m -2 h -1 ) 25 50 75 100 125 150 175 200 15 m 25 m 45 m Figure 5
Fig. 5. The diurnal variations in NO flux from 2 chamber each at 15, 25 and 45 m downwind of