HAL Id: hal-00304881
https://hal.archives-ouvertes.fr/hal-00304881
Submitted on 31 Dec 2005HAL is a multi-disciplinary open access archive for the deposit and dissemination of sci-entific research documents, whether they are pub-lished or not. The documents may come from teaching and research institutions in France or abroad, or from public or private research centers.
L’archive ouverte pluridisciplinaire HAL, est destinée au dépôt et à la diffusion de documents scientifiques de niveau recherche, publiés ou non, émanant des établissements d’enseignement et de recherche français ou étrangers, des laboratoires publics ou privés.
High-resolution phosphorus transfers at the catchment
scale: the hidden importance of non-storm transfers
P. Jordan, J. Arnscheidt, H. Mcgrogan, S. Mccormick
To cite this version:
P. Jordan, J. Arnscheidt, H. Mcgrogan, S. Mccormick. High-resolution phosphorus transfers at the catchment scale: the hidden importance of non-storm transfers. Hydrology and Earth System Sciences Discussions, European Geosciences Union, 2005, 9 (6), pp.685-691. �hal-00304881�
High-resolution phosphorus transfers at the catchment scale:
the hidden importance of non-storm transfers
P. Jordan
1, J. Arnscheidt
1, H. McGrogan
1and S. McCormick
1,21School of Environmental Sciences, University of Ulster, Coleraine, Northern Ireland 2Department of Agriculture and Rural Development, Belfast, Northern Ireland
Email for corresponding author: p.jordan@ulster.ac.uk
Abstract
High-resolution measurements of total phosphorus (TP) concentrations in a stream draining a 5 km2 agricultural catchment (a sub-catchment
of Lough Neagh in Northern Ireland) were made every 10 mins by continuous flow instrumentation using new homogenisation, digestion and colorimetric phases. Concurrently, rainfall and stream discharge data were collected at 5 and 15 min. intervals. Major P flushing episodes during storm events peaked on the rising limbs of storm hydrographs. A period of baseflow also indicated the importance of other sources that maintain the stream in a eutrophic state between storm events. These data provide insights into catchment processes that conform to definite patterns that, in a coarser sampling regime, might ordinarily be attributed to sampling and analytical noise.
Keywords: acute and chronic phosphorus transfers, high-resolution monitoring, catchments
Introduction
Monitoring the effectiveness of measures to improve water quality is one of the major phases and challenges of the European Union Water Framework Directive (OJEC, 2000). In managing eutrophication of fresh and coastal waters, this will most likely mean monitoring phosphorus (P) and nitrogen (N) in rivers following strategies aimed at reducing the transfer of these two nutrients (Foy, 2005).
While monitoring changes in point source nutrient transfers from, e.g. waste water treatment works and major industrial discharges, is not too difficult, untangling process-based, hydrologically-driven P and N transfers from diffuse sources in a catchment pose more of a problem (Haygarth
et al., 2005). Furthermore, it is widely recognised that
inter-and intra-catchment process complexity is extremely important in determining the final patterns of nutrient transfers; this is especially so with P transfers mobilised in surface runoff (Harris and Heathwaite, 2005). This pattern of diffuse P transfer is a product, inter alia, of storm mobilisation and attenuation from soils of variable binding and retention capacities (Kurz et al., 2005; Jordan et al., 2005), storm re-suspension in stream networks (McDowell
and Sharpley, 2001), release from P saturated river and lake sediments (Jarvie et al., 2005; Rippey et al., 1997), instream biological cycling (Jarvie et al., 2004) and P release from rural point sources such as septic tanks and farmyard infrastructure (Smith et al., 2005).
This overwhelming scale of P transfers, variable in both time and space in a multiplicity of combinations has, previously, in the absence of continuous monitoring instrumentation, been monitored at the catchment scale by grab sampling of stream water for P analysis. However, monthly or even weekly sampling can greatly underestimate mass P fluxes due to under-representing storm events, when most of the P is routed through the river network (Kronvang and Iversen, 2002). Recently, automatic samplers have been used in streams across all flow percentiles and the resulting data used in linear interpolations to derive P and sediment mass flux estimates (Stone et al., 2000). This type of data collection, which can be used to compare inter-annual mass flux patterns, results in a crude lumping of complex processes. Hence, the reductionist-based hypotheses formed from experiments at much finer temporal and spatial resolutions cannot be tested.
P. Jordan, J. Arnscheidt, H. McGrogan and S. McCormick Haygarth et al. (2005) consider that, for P transfer research and monitoring, high resolution data at the catchment scale should link small scale (i.e. plot and field) process-based hypotheses to large scale river basin patterns. Kirchener et
al. (2004) have shown how averaged hourly water quality
data bear little resemblance to the original dataset when presented in monthly to daily summaries. Heathwaite and Harris (2005) note that patterns in coarser resolution datasets may be overlooked, or deemed an artefact of analytical noise and so not linked back to process. Scholefield et al. (2005) similarly show that a double peak pattern of nutrients in the English River Taw could be observed only by initiating an hourly sampling regime at low flows. However, this effort could be sustained for no more than several days and could not be broadened to cover a range of flow percentiles.
This study describes the application of a high frequency sampling regime to determine total P (TP) concentrations in a stream draining a typical agricultural 5 km2
sub-catchment in the drainage basin of Lough Neagh in Northern Ireland. The sub-catchment is farmed primarily for beef sucklers with a single dairy enterprise and a single poultry unit so the land use is entirely grassland. The characteristically impermeable clay surface soils and the resulting impeded drainage promote flashy runoff that is augmented by a number of sub-soil and edge-of-field drains. Northern Ireland has a high rural population density although this particular sub-catchment has only 17 dwellings, all of which are serviced by domestic septic tank systems.
This monitoring programme is linked to the early stages of a wider project to define the multiple sources of nutrient transfers that are endemic in agricultural landscapes with high rural population densities and to provide recommendations for environmental management solutions to reduce or eliminate their impacts on biota. In such landscapes, high storm P transfers from P saturated soils, augmented by chronic, low flow P transfers from other sources, maintain streams in a eutrophic state between storm events (Jordan et al., 2005).
Methods
A Dr Lange Sigmatax and Phosphax suite of instrumentation has been installed in a 2 m × 1.5 m × 2 m glass-reinforced plastic kiosk at the outlet of the 5 km2 catchment. Each is
powered by 240 v AC. The Sigmatax unit consists of a stainless steel inlet pipe (with a submerged intake pointing downstream), compressor and a homogenisation unit inside the kiosk. The Phosphax unit comprises a refrigeration section for reagents, a digestion section and a colorimetry section with a data logger and storage for standards. The
Sigmatax is both a sample controller and homogeniser; it is set at the factory to create a 2.5 bar vacuum and retrieve a water sample every 10 mins. A 100 ml sample is homogenised in a glass ultra-sound chamber and a 10 ml sub-sample is delivered to the digestion chamber where it is reduced by boiling in sulphuric acid and sodium peroxydisulphate while the remaining homogenised sample is returned to the stream. Phosphorus is then determined photometrically using the molybdate-antimony-ascorbic acid method. The Phosphax performs an auto-calibration using a 2 mg l-1 standard and the method conforms to DIN
EN 38405 D11. Analytical checks were carried out on TP determined by the Phosphax and on discrete stream samples taken at the same time and returned to the laboratory using the method of Eisenreich et al. (1975). The two TP methods are essentially the same (acid-persulphate-digestion and molybdate antimony-ascorbic acid reduction). Calibration checks were also carried out on 1 mg l1, 1.5 mg l1 and
2.0 mg l1 inorganic and organic P standards to check the
stability of the auto-calibrations over time. Every three weeks, intake pipes and internal delivery tubes were flushed through with household bleach, waste was removed and data downloaded.
The operation of the two units in tandem ensures that while a sample is being analysed, the subsequent sample is being prepared. Waste, collected in a 25 L drum in the kiosk, is removed every three weeks. The refrigeration unit holds three 5 L reagent containers at 4°C and a single 1 L standard container is stored adjacent to the photometric chamber at ambient temperatures. At the 10 min resolution set in the factory, these volumes are sufficient for three months continuous sampling and this is also the design life of the reagents. Data, displayed as TP by LCD (liquid crystal display), are logged with time and date. The measuring range of the Phosphax is 0.01 mg l1 to 5.00 mg l1 as TP.
At the same site, water discharge is measured every 15 min. using the mean of 15 scanned data points using a Starflow Doppler flow gauge situated in a 2 m diameter pipe; this integrates measurements of flow velocity and water head using a flow equation specific to the pipe dimensions. Rainfall is measured further up the catchment by an ARG100 0.2 mm tipping bucket rain gauge logging at 5 min intervals.
Results
ANALYTICAL CHECKS
Total P determined by the Phosphax was consistently 20% lower than the laboratory tests with data ranging from 0.05 mg l1 to 0.5 mg l1. Some samples extracted directly
show less discrepancy between the two methods; this suggests that the observed difference was more likely to be caused by lower extraction of particulates by the Sigmatax unit than by inefficient digestion by the Phosphax unit. Despite the 20% discrepancy, over the measured range a linear relationship between laboratory and Phosphax determined TP was significant (y = 0.80x + 0.01, R2 0.99);
this prompted the use of a calibration curve to ensure that the continuous data were consistent with laboratory results. Calibration checks showed that pre-set weekly auto-calibration would drift by up to 8% using both organic and inorganic P standards. This was reduced to less than 1% when the auto-calibration sequence was reset to a daily time-step.
TIME SERIES DATA
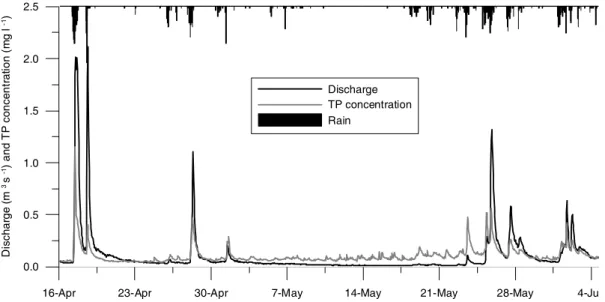
A full time series of rainfall, stream discharge and TP data from 13 April to 8 June 2005 (Fig.1) represents a transition between wet and dry soil moisture conditions with corresponding periods of storm runoff and the early onset of summer baseflow in receiving streams. The data are, therefore, reported as storm and non-storm TP time-series and have been aggregated to hourly time-series for comparison.
The storm time series between 17 April and 19 April (Fig. 2) and between 22 May and 1 June 2005 were periods of P flushing when peak concentrations preceded major storm peaks by several hours. Total P transfer matched storm
Fig. 1. A full time series of hourly rainfall, stream discharge and TP concentration during spring storms and the onset of summer baseflows
(after 2 May 2005) in a 5 km2 grassland catchment in the Lough Neagh basin.
Fig. 2. Hourly storm time-series discharge and TP concentration data (midnight to midnight) showing acute transfers and the onset of TP
concentration recession prior to peak stream discharge and an indication of P wash-out in the double storm peak event, 1719 April 2005.
16-Apr 23-Apr 30-Apr 7-May 14-May 21-May 28-May 4-Ju 0.0 0.5 1.0 1.5 2.0 2.5 D is ch ar ge (m 3 s -1) an d T P c onc en tr at io n (m g l -1) Discharge TP concentration Rain
16-Apr 18-Apr 20-Apr 22-Apr 24-Apr 26-Apr 28-Apr 30-Apr
0.0 0.5 1.0 1.5 2.0 2.5 D is char ge ( m 3 s -1) and T P c onc ent ra tion ( m g l -1) Discharge TP concentration Rain
P. Jordan, J. Arnscheidt, H. McGrogan and S. McCormick runoff only when the hydrographs were shorter (e.g. 23 May and the first peak on 25 May). This process of rapid P transfer during the onset of storm hydrographs is typical of transfers associated with overland flow runoff (Irvine et al., 2002) as well as with streambed resuspension of fine particulate matter with adsorbed P (particulate fraction) (McDowell and Sharpley, 2001). While, at this scale, both processes may operate in tandem during storm runoff, during smaller storms, stream bed re-suspension is more likely to predominate. Phosphorus wash-out from soils and sediments, reported in the literature by Kurz et al. (2005), was observed in the storm of 18 April. In a storm of greater magnitude (albeit shorter duration) than the storm on 17 April, the peak TP concentration was 0.5 mg l1,
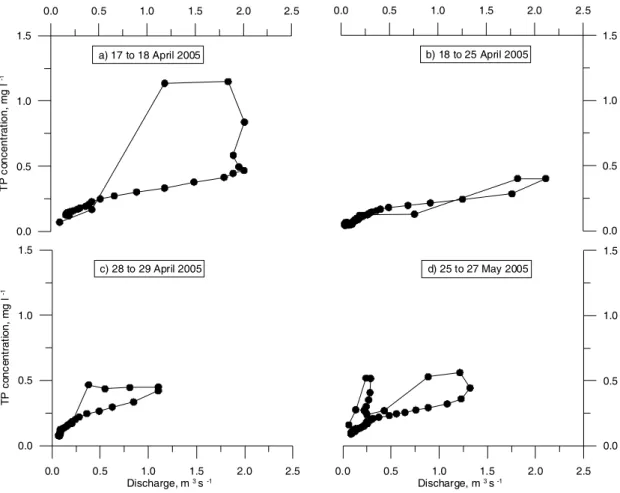
approximately 60% less than the TP peak of 17 April. These storm TP transfers can also be compared with hysteresis effects in Fig. 3a to d. The data follow a clockwise pattern with periods of storm-onset flushing. In Fig. 3b there is no indication of flushing (owing to the event of the previous day) and this event can probably be considered to be runoff interacting with field surfaces only (rather than channel
scouring/flushing); namely truly diffuse TP transfer. This is highlighted to a lesser extent in Fig. 3c and also during a double peaked event in Fig. 3d. Here, the earlier small peak flushes P-rich material away so the hysteresis effect is less acute.
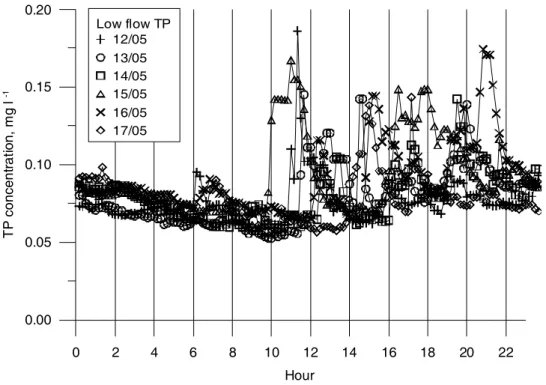
Baseflows between 21 April and 26 April 2005 were typically high prior to soil moisture depletion but, after 3 May 2005, they became depleted, as a soil moisture deficit built up and the TP concentrations became progressively higher. Allied with this is a saw-tooth feature in the TP trace, highlighted in Fig. 4 during a dry period. This pattern was effectively drowned out by low intensity rainfall on 18 May 2005 but was re-established on 20 May 2005. The period of zero rainfall from 12 to 18 May 2005, displayed in Fig. 5 as a combined dataset over 24-hour periods, shows decreasing TP concentrations between midnight and 10:00. Then, on most days, concentrations rise between 10:00 and 12:00, then decrease until 14:00 and subsequently increase in a less defined way between 14:00 and 23:00.
The combined progressive decline in overall TP concentration during this recorded period with zero rainfall
Fig. 3. Hourly discharge and TP concentration data for four storms showing the effects of hysteresis. Most plots show a storm-onset period of
flushing. (b) is the exception that shows true diffuse TP transfer as the previous storm (a) had mobilised previously attenuated material.
0.0 0.5 1.0 1.5 2.0 2.5 0.0 0.5 1.0 1.5 T P c on cent ra tion , m g l -1 a) 17 to 18 April 2005 0.0 0.5 1.0 1.5 2.0 2.5 0.0 0.5 1.0 1.5 b) 18 to 25 April 2005 0.0 0.5 1.0 1.5 2.0 2.5 Discharge, m 3 s -1 0.0 0.5 1.0 1.5 d) 25 to 27 May 2005 0.0 0.5 1.0 1.5 2.0 2.5 Discharge, m 3 s -1 0.0 0.5 1.0 1.5 TP c on ce nt rat ion, m g l -1 c) 28 to 29 April 2005
Fig. 4. Hourly low flow time-series discharge and TP concentration data (midnight to midnight) indicating a period of chronic and cyclic
enrichment during a period of low and zero rainfall. TP data are shown as raw 10minute outputs and hourly means.
Fig. 5. An overlay of daily cycles of TP concentrations generated on a 10min time-step during a period of zero rainfall showing a period of TP
depletion/recovery between midnight and approximately 10:00am and then a consistent stepped increase in TP concentration; a pattern that is most likely linked to a catchment process not allied to storm runoff and which could be missed or regarded as sampling/analytical noise in a coarser sampling regime.
reaches its minimum between 10:00 and 11:00 every day with an average of approximately 0.068 mg l1. The
subsequent increases reach upwards of 0.180 mg l1. The
general trend of increasing (mean daily) TP concentrations as base flow decreases (Fig. 1) indicates a dilution effect and, as such, these non-storm P transfers can be regarded as
rural point sources (in the absence of major sewage or industrial point sources). Samples analysed in the laboratory indicate that these low-flow P transfers are predominantly in particulate form, as might be expected from raw waste-water sources.
12-May 14-May 16-May 18-May 20-May 22-May
0.0 0.1 0.2 0.3 0.4 0.5 D is char ge ( m 3 s -1) and T P c on cent ra tion ( m g l -1) 6 4 2 0 R ain , mm h r -1 Discharge TP 10min data TP hourly mean Rain 0 2 4 6 8 10 12 14 16 18 20 22 Hour 0.00 0.05 0.10 0.15 0.20 T P c onc en trat io n, m g l -1 Low flow TP 12/05 13/05 14/05 15/05 16/05 17/05
P. Jordan, J. Arnscheidt, H. McGrogan and S. McCormick
Discussion and conclusion
This dataset using bank-side, continuous TP monitoring equipment provides a flag for the importance of both storm and non-storm TP transfers to the overall P budget of an agricultural sub-catchment. Storm transfers are responsible for the greater mass flux of P; it is this load that is particularly important for the eutrophic impacts of any receiving standing water body (in this case Lough Neagh) when integrated with the cumulative effects of all acute storm transfers from the wider drainage basin. Hourly storm TP transfers during the period 16 April to 7 June 2005 were over 1 kg hr1 and up to
9 kg hr1 for the largest storm on 17 April. Conversely, the
non-storm loads, all less than 0.01 kg hr-1, maintained the
stream in a eutrophic state between the high flows. These chronic transfers have the greatest impact on the stream system by providing a limiting nutrient that is likely to increase in concentration as discharges decrease towards extreme and warmer baseflows during the summer period. The variation in P concentration observed in this study provides a significant insight into the transfer processes operating in this agricultural basin. The onset of depletion in TP concentration prior to storm peaks indicates that extreme P transfers may be controlled by hysteresis effects and, notably, by early storm flushing or wash-out from soils or stream sediments from materials deposited in previous events. This fits well with the conveyor belt model of sediment and nutrient transfer from land to water described by Jennings et al. (2002).
Manipulating the mode of delivery has been proposed as a possible mitigation option for P transfer (Gburek et al., 2005); promoting soil water infiltration and attenuation could be an option that would fit with this model. Moreover, the changes in daily low flow P transfer between 10:00 and 12:00 are indicative of other significant sources in this stream network. Rather than pinpointing any one source, the data show that this pattern is predictable; when combined with flow data, it is most likely linked to the dilution of one or more rural point sources (e.g. Jarvie et al., 2002).
Providing insights into such fine scale patterns means that searching for or formulating hypotheses on catchment processes/sources can be more focussed. If a discrete sampling regime were employed, even on a daily basis, prior to 10:00 hr, such variability might be missed completely and an underestimated background P transfer assumed (e.g. Kirchner et al., 2004). Alternatively, sampling on a coarser resolution that did not detect the changes after 10:00 and the recovery after 23:00 each day might well result in analytical noise being attributed to the low flow P data (Heathwaite and Harris, 2005). Biochemical fingerprinting, for example, is emerging as a powerful tool to assign sources
to P transfers (Baker et al., 2003; Nash and Halliwell, 2000) and, in this catchment, it seems reasonable to sample fingerprints during three phases; 10:00 to 14:00 (primary daily enrichment phases), post 14:00 to 23:00 (secondary enrichment phases) and 23:00 to 10:00 (recovery phases). This will enable a fuller characterisation of low flow nutrient transfer for mitigation plans.
These points demonstrate the potential of this kind of fine scale nutrient monitoring in highlighting deficiencies in current understanding of rural nutrient transfers. In addition to testing existing hypotheses, the datasets indicate new avenues for research on catchment P transfer processes. Furthermore, as this present dataset is extended, new hypotheses can be linked to mitigation measures and the response to changed management practices can be gauged quickly. Pinpointing and tackling the causes of e.g. rural point sources should have immediate effect on background water quality although, in cases of high flow mitigation, it may take longer to link cause and effect. Nevertheless, this has validation implications for those endeavouring to model the potential effects of changes in catchment management. Although the Sigmatax/Phosphax instrumentation was designed to monitor TP in waste activated sludge and final effluent from waste-water treatment works, its application, here, to river basin research has demonstrated its suitability for monitoring TP transfers at all phases of flow in small to large river catchments (albeit with calibration curves to take into account heavy particulates that may not be sampled adequately by the Sigmatax delivery unit). Unlike some alternative automatic sampling regimes (Lennox et al., 1997), the Sigmatax/Phosphax instruments do not optimise sampling as a proportion of flow volume but they do sample low flows adequately. On a 10-minute cycle, the instrumentation performs a high-resolution time-integrated sampling regime which can be integrated with discharge data to calculate hourly to annual load statistics. Thus, it is easier to gauge the effects of changes in management as many data-points can be assigned to long term flow percentiles over the full flow range rather than comparing annual statistics, which can be influenced by hydroclimatic variations.
Indeed, for many of the statistical methodologies used within dynamic modelling studies of water quality, sampling at a good (high frequency) resolution, over a constant time interval, is crucial to their application. High resolution water quality monitoring of the type described here is central to the science that will allow the achievement of the proper and full aims of the Water Framework Directive in respect of nutrient impacts in the freshwater environment.
Acknowledgements
The authors thank and acknowledge NERC (NER/H/S/1999/ 00164) and the SEUPB (INTERREG IIIa 020204) for infrastructure and funding of personnel. Helpful comments on earlier drafts of this manuscript were made by Prof Louise Heathwaite, Lancaster University, UK, Dr Phil Haygarth, IGER, Oakhampton, UK, Dr Hubert Tunney Teagasc, Wexford, Republic of Ireland and Prof Colin Neal, CEH Wallingford, UK.
References
Baker, A., Inverarity, R., Charlton, M. and Richmond, S., 2003. Detecting river pollution using fluorescence spectrophotometry: case studies from the Ouseburn, NE England. Environ. Pollut..
124, 5770.
Eisenreich, S.J., Bannerman, R.T. and Armstrong, D.E., 1975. A simplified phosphorus analysis technique. Environ. Lett., 9, 43 53.
Foy, R.H., 2005. The return of the phosphorus paradigm: agricultural phosphorus and Eutrophication. In: Phosphorus:
agriculture and the environment, J.T. Sims and A.N. Sharpley,
(Eds.) Agronomy Monograph no.46, ASA/CSCA/SSSA, Wisconsin, USA. 911-940, 2005.
Gburek, W.J., Barberis, E., Haygarth, P.M., Konvang, B. and Stamm, C., 2005. Phosphorus mobility in the landscape. In:
Phosphorus: agriculture and the environment, J.T. Sims and
A.N. Sharpley (Eds.) Agronomy Monograph no.46, ASA/ CSCA/SSSA, Wisconsin, USA. 911-980, 2005.
Haygarth, P.M., Condron, L.M., Heathwaite, A.L., Turner, B.L. and Harris, G.P., 2005. The phosphorus transfer continuum: linking source to impact with an interdisciplinary and multi-scaled approach. Sci. Total Envir., 344. 514.
Harris, G. and Heathwaite, A.L., 2005. Inadmissible evidence: knowledge and prediction in land and riverscapes. J. Hydrol.,
304, 319.
Irvine, K., Coulter, B., Coxon, C., Daly, K., Jeffrey, D., Kiely, G., Kurz, I., Mills, P., Morgan, G. and Tunney, H., 2002. Exports of phosphorus loads from grassland catchments in the Republic of Ireland. In: Diffuse phosphorus losses at the catchment scale, B. Kronvang (Ed.), COST Action 832 - Quantifying the agricultural contribution to eutrophication, ALTERRA, Wageningen, The Netherlands. 2731.
Jarvie, H.P., Neal, C., Williams, R.J., Neal, M., Wickham, H.D., Hill, L.K., Wade, A.J., Warwick, A. and White, J., 2002. Phosphorus sources, speciation and dynamics in the lowland eutrophic River Kennet, UK. Sci. Total Envir., 282/283, 175 203.
Jarvie, H.P., Neal, C. and Williams, R.J., 2004. Assessing changes in phosphorus concentrations in relation to in-stream plant ecology in lowland permeable catchments: bringing ecosystem functioning into water quality monitoring. Water Air Soil Pollut.,
4, 641655.
Jarvie, H.P., Jurgens, M.D., Williams, R.J., Neal, C., Davies, J.J.L., Barrett, C. and White J., 2005. Role of river bed sediments as sources and sinks of phosphorus across two major eutrophic UK river basins: the Hampshire Avon and Herefordshire Wye.
J. Hydrol., 304, 5174.
Jennings, E., Irvine, K., Mills, P., Jordan, P., Jensen, J., Søndergaard, M., Barr, A. and Glasgow, G., 2002. Relative
eutrophic effects of seasonal discharges of phosphate to water bodies. Wexford, Ireland, 90 pp. (EPA report
2000-LS-2.1.7-M2).
Jordan, P., Menary, W., Daly, K., Kiely, G., Morgan, G., Byrne, P. and Moles, R., 2005. Patterns and processes of phosphorus transfer from Irish Grassland soils to rivers-integration of laboratory and catchment strudies. J. Hydrol., 304, 2034. Kirchner, J.W., Xiahong, F., X., Neal, C. and Robson, A.J., 2004.
The fine structure of water-quality dynamics: the (high-frequency) wave of the future. Hydrol. Process., 18, 13531359. Kronvang, B. and Iversen, H.L., 2002. Danish experience on sampling strategy and estimation method when calculating phosphorus transport in streams. In: Diffuse phosphorus losses
at the catchment scale, B.Kronvang,(Ed), COST Action 832
-Quantifying the agricultural contribution to eutrophication, ALTERRA, Wageningen, The Netherlands. 2126.
Kurz, I., Coxon, C., Tunney, H. and Ryan, D., 2005. Effects of grassland management practices and environmental conditions on nutrient concentrations in overland flow. J. Hydrol., 304, 3550.
Lennox, S.D., Foy, R.H., Smith, R.V. and Jordan, C., 1997. Estimating the contribution from agriculture to the phosphorus load in surface water. In: Phosphorus Loss from Soil to Water, H. Tunney, O.T. Carton, P.C. Bookes and A.E.Johnston. CAB International, Wallingford, UK. 5575.
McDowell, R.W. and Sharpley, A.N. 2001. A comparison of fluvial sediment P chemistry in relation to location and potential to influence stream P concentrations. Aquat. Geochem., 7, 255 265.
Nash, D.M. and Halliwell, D.J., 2000. Tracing phosphorus from grazing land to water. Water Res., 34, 19751985.
Official Journal of the European Community, 2000. Establishing a framework for Community action in the field of water policy (Water Framework Directive), 2000/60/EC, L327.
Rippey, B., Anderson, N.J. and Foy, R.H. 1997. Accuracy of diatom-inferred total phosphorus concentrations and the accelerated eutrophication of a lake due to reduced flushing and increased internal loading. Can. J. Fisheries Aquat. Sci.,
54, 26372646.
Scholefield, D., Le Goff, T., Baven, J., Ebdon, L., Long, T. and Butler, J., 2005. Concerted diurnal patterns in riverine nutrient concentrations and physical conditions. Sci. Total Envir., 344, 201210.
Smith, R.V., Jordan, C. and Annett, J.A., 2005. A phosphorus budget for Northern Ireland. J. Hydrol. 304, 193202. Stone, K.C., Hunt, P.G., Novak, J.M. Johnson, M.H. and Watts,
D.W., 2000. Flow-proportional, time-composited, and grab sample estimation of nitrogen export from an eastern coastal plain watershed. Trans. Amer. Soc. Agr. Eng., 43, 281290.