HAL Id: hal-02662329
https://hal.inrae.fr/hal-02662329
Submitted on 30 May 2020
HAL is a multi-disciplinary open access
archive for the deposit and dissemination of
sci-entific research documents, whether they are
pub-lished or not. The documents may come from
teaching and research institutions in France or
abroad, or from public or private research centers.
L’archive ouverte pluridisciplinaire HAL, est
destinée au dépôt et à la diffusion de documents
scientifiques de niveau recherche, publiés ou non,
émanant des établissements d’enseignement et de
recherche français ou étrangers, des laboratoires
publics ou privés.
Copyright
Are the lowest-cost healthful food plans culturally and
socially acceptable ?
Mathieu Maillot, Nicole Darmon, Adam Drewnowski
To cite this version:
Mathieu Maillot, Nicole Darmon, Adam Drewnowski. Are the lowest-cost healthful food plans
cultur-ally and socicultur-ally acceptable ?. Public Health Nutrition, Cambridge University Press (CUP), 2010, 13
(8), pp.1178-1185. �10.1017/S1368980009993028�. �hal-02662329�
Are the lowest-cost healthful food plans culturally and
socially acceptable?
Matthieu Maillot
1,2,3, Nicole Darmon
1,2,3and Adam Drewnowski
4,*
1INSERM U476, UMR1260, Nutriments Lipidiques et Pre´vention des Maladies Me´taboliques, Marseille, France: 2INRA, 1260, Marseille, France:3Faculte´ de Me´decine, Universite´ Aix-Marseille, IPHMFR 125, Marseille,
France:4Nutritional Sciences Program and Center for Public Health Nutrition, School of Public Health,
University of Washington, Seattle, WA 98195-3410, USA Submitted 11 February 2009: Accepted 11 November 2009
Abstract
Objective: Nutritious yet inexpensive foods do exist. However, many such foods are rejected by the low-income consumer. Is it because their use violates unspoken social norms? The present study was designed to assess the variety and cost of the lowest-cost market basket of foods that simultaneously met required dietary standards and progressively stricter consumption constraints.
Design: A mathematical optimisation model was used to develop the lowest-cost food plans to meet three levels of nutritional requirements and seven levels of consumption constraints.
Subjects: The nationally representative INCA (National Individual Survey of Food Consumption) dietary survey study of 1332 adults provided population estimates of food consumption patterns in France. Food plan costs were based on retail food prices.
Results: The lowest-cost food plans that provided 9204 kJ/d (2200 kcal/d) for men and 7531 kJ/d (1800 kcal/d) for women and met specified dietary standards could be obtained for ,1?50 h/d. The progressive imposition of consumption con-straints designed to create more mainstream French diets sharply increased food plan costs, without improving nutritional value.
Conclusions: Minimising diet costs, while meeting nutrition standards only, led to food plans that provided little variety and deviated substantially from social norms. Aligning the food plan with mainstream consumption led to higher costs. Food plans designed for low-income groups need to be socially acceptable as well as affordable and nutritious.
Keywords Costs and cost analysis Micronutrients Nutrition policy Food Linear programming
By necessaries I understand, not only the com-modities which are indispensably necessary for the support of life, but whatever the custom of the country renders it indecent for creditable people, even of the lowest order, to be without.
Adam Smith, 1776(1) Lower-income groups have poor diets(2)and suffer from higher rates of obesity and chronic disease(3). Food, health and incomes may be linked through food prices and diet costs(4). Refined grains, fats and sweets are affordable, accessible and convenient(5). By contrast, many nutrient-rich foods cost more and are consumed by more affluent persons(2). One barrier to the adoption of healthful diets by the lower-income groups may be diet cost(6,7).
Arguably, not all healthful foods cost more(8). Some nutrient-rich foods can be obtained at very low cost. Recipes and tips for healthy thrifty meals have featured
ground turkey, chickpeas and condensed or powdered milk(9). Home-cooked lentil soup and inexpensive rice and beans have been proposed as suitable staple diets for the US poor(10). Nuts, seeds, legumes, cereals, carrots, potatoes and cabbage offer good nutrition at an afford-able cost(11). The search for affordable nutrient-rich foods is being aided further by the new techniques of nutrient profiling(12) and by the new metrics of nutrients per energy and nutrients per unit cost(11).
However, many low-cost yet nutritious foods are rejected by the consumer. The present hypothesis is that such foods deviate from the current consumption stan-dards; fail to meet cultural requirements, and may be socially or culturally inappropriate. The custom of the country – to borrow a phrase from Adam Smith – may place such foods or diets outside the accepted social norms. In striving to meet nutrient requirements at mini-mum cost, the search for lowest-cost healthful diets may have ignored the current eating habits of the population.
S
Public
Health
Nutrition
Mathematical optimisation models have shown for a long time that nutritious diets could be obtained at very low cost(13,14). The USDA Thrifty Food Plan (TFP) model creates a diet that is as similar as possible to the current diet of low-income Americans, while simultaneously meet-ing a fixed set of nutritional and cost constraints(15,16). Upper and lower bounds on food energy are based on the Institute of Medicine energy requirements, whereas nutri-ent and food group constraints are based on the Dietary Guidelines for Americans and on MyPyramid, respectively. The cost constraint keeps computer-generated diets below the target cost. To arrive at the optimisation solu-tion, the TFP tolerates up to tenfold deviations from the current eating habits.
The present study reversed the situation in that the model minimised cost, while meeting different sets of nutritional and consumption constraints. Instead of meeting a single set of nutrition constraints, the model created food plans that met three sets of nutritional constraints of progressive severity. The intent was to determine whether healthier diets cost more. In addition, significant deviations from the mainstream French diet were progressively disallowed. Seven levels of increasingly stringent consumption con-straints ensured that the final model had little tolerance for any deviation from the French mainstream eating habits. The intent was to estimate the cost of healthful diets that were also consistent with French cultural expectations and societal norms.
Methods
Dietary data, food composition database and food prices
The input data used in the present analysis were based on data collected in a cross-sectional dietary survey of a nationally representative sample of 1985 French adults (INCA; National Individual Survey of Food Consumption survey), aged 15–92 years, conducted in 1999 by the French National Agency for Food Safety(17). Usual food
intakes were estimated using a 7 d food record completed by all participants, aided by a photographic manual of portion sizes(18). Participants who under- or over-reported their energy intake (284 men and 312 women), according to Black’s method(19), were removed from the sample. The physical activity level assumed in the calculation of the threshold was 1?55, corresponding to seated work with low walking and leisure activity. The final sample(15) of 1332 participants aged between 15 and 92 years included 596 men and 736 women.
After excluding diet beverages, tea, coffee, dietary supplements and drinking water, a total of 614 different foods were declared as consumed by the participants. Their nutritional composition, expressed per 100 g of edible portion, and their edible conversion factors were computed from the INCA food composition database(20),
the Suvimax food composition database(21)or from other databases(22–25). A column of French mean national 1997 retail prices primarily obtained from marketing research (SECODIP) was added to nutrient composition table. The prices were those paid by a representative panel of French consumers; therefore, the mean price reflected the most frequently purchased forms of each food. The prices were obtained for the foods ‘as purchased’, whereas the nutrient contents were based on the food ‘as consumed’. To adjust for preparation and waste and to have a common mode of expression for price and for nutrients, retail prices were converted into prices per 100 g of edible food, based on the edible conversion factors of each food.
The foods were aggregated into seven major food groups (meat, fruit and vegetables, mixed dishes and snacks, dairy, starches and grains, sweets and salted snacks and added fats), twenty subgroups (e.g. subgroups in the fruit and vegetable group were fruits, vegetables and dried fruits) and thirty-six families (e.g. families in the fruit subgroup were fresh fruits, fruit juices and other processed fruits). The recipes used to calculate the nutrient compo-sition of mixed dishes were derived from the SUVIMAX food composition database(21).
Mathematical diet optimisation model
The principle of diet modelling with linear programming has been explained before(26), and the characteristics of the optimisation models used in the present study were also published(12).
All linear programming models and statistical analyses were performed using the Operational Research Package of the SAS statistical software package version 9?2 (SAS Institute Inc., Cary, NC, USA).
Creation of twenty-one food plans per gender
Linear programming models were used to create twenty-one different food plans for men and women, meeting three sets of nutritional and seven sets of consumption constraints. All diets were isoenergetic as the model-fixed dietary energy at 9204 kJ/d (i.e. 2200 kcal/d) for men and 7531 kJ/d (i.e. 1800 kcal/d) for women. The optimisation process yielded a suggested food plan that consisted of quantities of different foods selected into the market basket from a pool of 614 foods (i.e. the number of foods in the food database). Total diet cost was minimised to obtain the lowest-cost food plans that fulfilled all the constraints introduced in each linear programming models and were presently developed to select twenty-one isoenergetic diets for each gender at minimal cost that differed in the nutritional (three sets) and consumption (seven sets) constraints.
Objective function
The chosen ‘objective function’ of the model ensured that the food plan basket was at minimal cost. Variables in the objective function were represented by the quantity of the
S
Public
Health
Nutrition
614 food items. Each item was linked to the nutrient composition and cost database.
The objective function Z was minimized:
Z ¼ X
j ¼614 j ¼1
cj
.
Qjwhere Qjwas the quantity of food j in the modelled food
basket plan; cjwas the cost of 1 g of food j.
Nutritional constraints
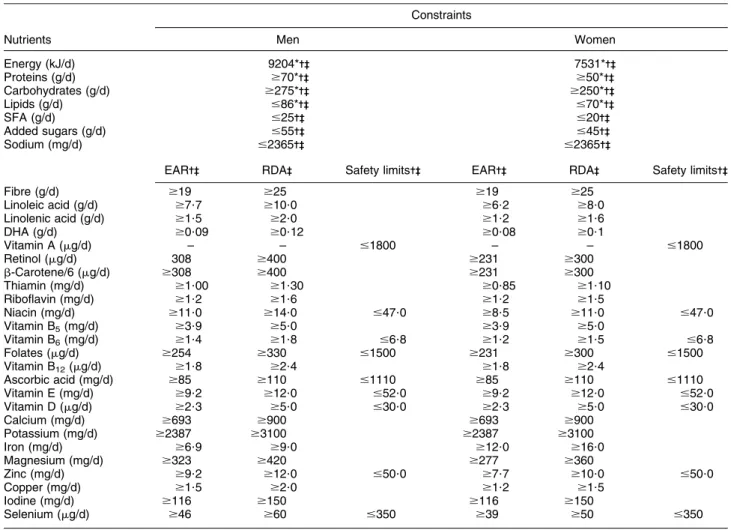
Table 1 shows three levels of progressively more stringent nutritional constraints. Level A ensured that the food plans were consistent with guidelines for macronutrients. Level B ensured that the food plans were consistent with guidelines for macronutrients and with the French esti-mated average requirements for twenty-five additional nutrients(27). Level C ensured that the food plans were consistent with the macronutrient guidelines and with the recommended dietary allowances (RDA) for each of the twenty-five nutrients. Levels B and C introduced additional limits on the consumption of saturated fats,
added sugars and sodium, and set safe upper limits on the consumption of nine additional nutrients.
Consumption constraints
Table 2 shows seven levels of progressively more strin-gent consumption constraints, based on the observed distribution of food intakes in the referent INCA popu-lation, calculated for men and women separately. These constraints were progressively applied to the seven major food groups, twenty food subgroups and thirty-six food categories.
Level 1 imposed no constraints on food choice. A Level 2 constraint was that the amount of energy provided by each of the seven major food groups fit between the 5th and the 95th percentiles of intake for that food group by the reference population. Levels 3 and 4 cumulatively extended that constraint to the twenty food subgroups and to the thirty-six food categories, respectively. Level 5 placed the upper bound on consumption, such that the amount of food in the optimised food plan could not exceed the 95th percentile limit for that food in the
S
Public
Health
Nutrition
Table 1 Description of nutritional constraints introduced in linear programming models, separately for men and women Constraints
Nutrients Men Women
Energy (kJ/d) 9204*--- 7531*-- -Proteins (g/d) $70*--- $50*-- -Carbohydrates (g/d) $275*--- $250*-- -Lipids (g/d) #86*--- #70*-- -SFA (g/d) #25--- #20-- -Added sugars (g/d) #55--- #45-- -Sodium (mg/d) #2365--- #2365--
-EAR--- RDA-- Safety limits--- EAR--- RDA-- Safety limits--
-Fibre (g/d) $19 $25 $19 $25 Linoleic acid (g/d) $7?7 $10?0 $6?2 $8?0 Linolenic acid (g/d) $1?5 $2?0 $1?2 $1?6 DHA (g/d) $0?09 $0?12 $0?08 $0?1 Vitamin A (mg/d) – – #1800 – – #1800 Retinol (mg/d) 308 $400 $231 $300 b-Carotene/6 (mg/d) $308 $400 $231 $300 Thiamin (mg/d) $1?00 $1?30 $0?85 $1?10 Riboflavin (mg/d) $1?2 $1?6 $1?2 $1?5 Niacin (mg/d) $11?0 $14?0 #47?0 $8?5 $11?0 #47?0 Vitamin B5(mg/d) $3?9 $5?0 $3?9 $5?0 Vitamin B6(mg/d) $1?4 $1?8 #6?8 $1?2 $1?5 #6?8 Folates (mg/d) $254 $330 #1500 $231 $300 #1500 Vitamin B12(mg/d) $1?8 $2?4 $1?8 $2?4 Ascorbic acid (mg/d) $85 $110 #1110 $85 $110 #1110 Vitamin E (mg/d) $9?2 $12?0 #52?0 $9?2 $12?0 #52?0 Vitamin D (mg/d) $2?3 $5?0 #30?0 $2?3 $5?0 #30?0 Calcium (mg/d) $693 $900 $693 $900 Potassium (mg/d) $2387 $3100 $2387 $3100 Iron (mg/d) $6?9 $9?0 $12?0 $16?0 Magnesium (mg/d) $323 $420 $277 $360 Zinc (mg/d) $9?2 $12?0 #50?0 $7?7 $10?0 #50?0 Copper (mg/d) $1?5 $2?0 $1?2 $1?5 Iodine (mg/d) $116 $150 $116 $150 Selenium (mg/d) $46 $60 #350 $39 $50 #350
EAR, estimated average requirement; RDA, recommended dietary allowances. *Constraint included in level A (achievement of macronutrient recommendations).
-Constraint included in level B (achievement of macronutrient recommendations plus estimated average requirements). --Constraint included in level C (achievement of macronutrient recommendations plus recommended dietary allowance).
referent population. Level 6 introduced the additional constraint that foods consumed by only a small minority of the French population and therefore, by definition, not a part of mainstream eating habits, could not be a part of the optimised food plans. Accordingly, foods consumed by less than 2?5 % of the referent French population were removed. This led to the removal of 314 of the original 614 foods. Level 7 imposed the final and most stringent constraint that foods consumed by less than 5 % of the referent French population were removed from con-sideration by the optimisation model. That led to the removal of 429 of the 614 foods. All the constraints, cumulatively imposed at each higher level, ensured that the resulting computer-optimised food plan would clo-sely resemble the mainstream French diet, with progres-sively less tolerance for any deviation from the current patterns of consumption.
Results
Figure 1 shows, separately for women and men, that the progressive application of nutritional recommendations increased the lowest achievable food plan costs. Plans that met the more rigorous nutritional constraints did cost more. Although food plans fulfilling all the RDA requirements (level C diets) could be obtained for as little as 1?50 h/d, the low cost was achieved only if consumption constraints were ignored (consumption levels C1 to C3).
Entering the increasingly stringent consumption con-straints into the model led to dramatic changes in the resulting cost and variety of the optimised food plans. Not only did the food plans become more costly, but also the cost of a market basket of foods that was consistent with the mainstream French diet far outweighed the cost of
meeting the nutritional constraints alone. The cost of food plans meeting consumption level 7 constraints (C7) was several times that of plans that tolerated more substantial deviations from current consumption patterns. The low-est achievable cost of level C7 food plans was 3?40 h/d for men and 3?20 h/d for women, almost ten times the amount calculated for the lowest cost level A1.
Furthermore, as indicated in Fig. 1, there was an interaction between nutritional and consumption con-straints. As long as the model imposed no consumption constraints or tolerated a high degree of deviation, the difference in cost between the less nutritious and more nutritious food plans did not exceed 100 %. Once the stringent consumption constraints were imposed and the diet resembled more what people actually eat, the cost of healthier diets more than doubled, relative to less healthy ones.
The variety of foods in the market basket was also affected by the two sets of constraints (Fig. 1). The number
S
Public
Health
Nutrition
Table 2 Seven levels of consumption constraints introduced* into the linear programming models
Levels Added consumption constraints
1 None
2 The energy contributed by each food group was limited to between the 5th and 95th percentiles of the population distribution
3 The energy contributed by each food subgroup was limited to between the 5th and 95th percentiles of the population distribution
4 The energy contributed by each food family was limited to between the 5th and 95th percentiles of the population distribution
5 The amount of each food does not exceed the 95th percentile of quantities consumed by adults (men or women) who consumed the food
6 Exclusion of foods consumed by less than 2?5 % of the population (i.e. 326 foods among 614)
7 Exclusion of foods consumed by less than 5 % of the population (i.e. 409 foods among 614)
*For a given level i of consumption constraints (with i varying from 1 to 7), the constraints included in the level i21 are retained, and the constraint specific to level i is added.
0 1 2 3 4 Cost, euros/d 3 10 12 6 15 17 10 21 18 22 27 35 31 41 48 24 34 38 22 28 35 1 2 3 4 5 6 7 n Consumption constraints (a) 0 1 2 3 4 Cost, euros/d 3 11 13 6 14 15 11 21 17 22 29 33 31 37 52 24 35 51 22 30 37 1 2 3 4 5 6 7 n Consumption constraints (b)
Fig. 1 Minimal cost of twenty-one modelled diets fulfilling increasing levels of nutritional constraints ( , A; , B; , C) and consumption constraints (1, 2, y 7). The number of foods selected for each diet at each set of constraints is indicated as well. Data are presented separately for men (a) and women (b)
of foods always increased from A to C, at each level of consumption constraints so that the higher-quality food plans were always associated with greater variety. For each level of nutritional constraint, the imposition of consump-tion constraints led to a greater variety of foods until level 5 with a drop observed at levels 6 and 7. It was then that the foods consumed by less than 2?5 % and 5 % of the total population were excluded, respectively. In most lowest-cost food plans, whole grains, lean meats, seafood, whole fruit and salad greens were missing altogether.
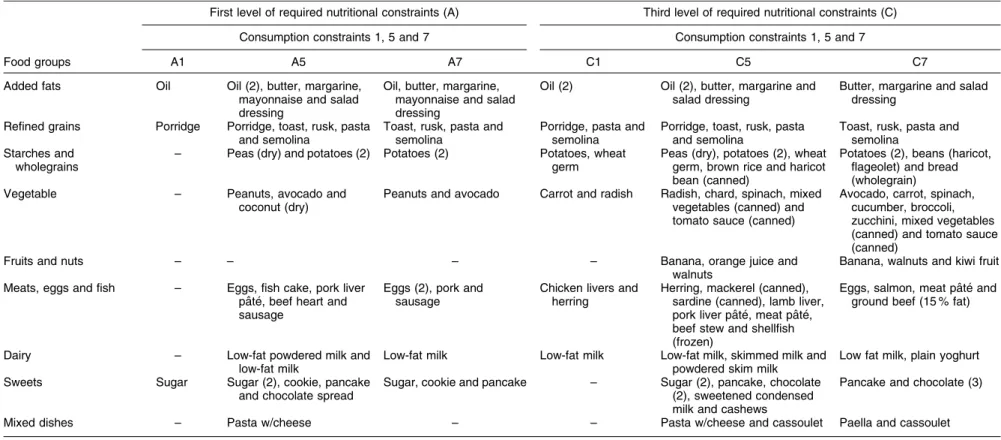
Table 3 shows the market baskets for women at dif-ferent levels of nutrition and consumption constraints. In general, food plans that deviated most from the usual eating habits consisted of a small number of foods, pro-vided in large amounts. Typically, those plans were based on grains, cereals, vegetable oils and sweets. Thus, the minimal cost level A1 plan for women consisted of only three foods: porridge, sugar and vegetable oil (Table 3). The minimal cost level C1 plan consisted of twelve foods (porridge, pasta, semolina, mashed potatoes, wheat germ, carrots, radishes, chicken livers, grilled herring, low-fat milk and vegetable oil). In other plans, nutritional adequacy was assured through large quantities of in-expensive carrots and low-fat milk, as well as organ meats (liver and brains) and herring.
Discussion
Diet optimisation programmes are mathematical tools that are used to create healthful food plans at an affordable cost(13,28,29). In the United States, such programmes have been used to set the official estimates of the lowest cost of a nutritious diet. For example, the official USDA food plans are generated by an optimisation programme that selects a diet that closely resembles the observed con-sumption patterns of the low-income population, while simultaneously meeting cost targets as well as nutrition and other constraints(15,16). The lowest-cost USDA Thrifty Food Plan, most recently updated in 2007, is then used to set the benefit levels for the Supplemental Nutrition Assistance Program, previously known as food stamps. In 2007, the TFP cost per week was estimated at US $32?20 for women and $35?80 for men(30).
Mathematical models, faced with multiple constraints, do not always achieve a perfect fit. The new TFP market baskets are no exception: the USDA documentation acknowledges that they did not meet the vitamin E and potassium recommendations for some age–gender groups and did not meet the sodium recommendation for many age–gender groups(16). To do so, the low-cost market baskets would have had to deviate very sub-stantially from the typical consumption patterns (in the case of vitamin E and potassium) or would have required changes in food manufacturing practices (in the case of sodium)(16). According to the USDA documentation, it
was practically impossible to develop the low-cost TFP market baskets that met the sodium recommendation.
While nutrition and cost constraints of optimisation models have received most research attention, consump-tion constraints have not. In the TFP, the lower bound for consumption was set close to zero for most good groups, whereas the upper bound varied by food category, depending on average consumption(16). Generally, the upper bounds were three to ten times average consumption. This was carried out, in part, to accom-modate policy goals. For example, although the popula-tion average consumppopula-tion for whole grains was near zero, the 2005 Dietary Guidelines for Americans specified that half of all grain consumption should be from wholegrains. As a result, the TFP had to tolerate high deviance from the usual eating patterns. According to the USDA documentation, the TFP basket for the family of four contained more vegetables (137 %), milk products (125 %), fruit (115 %) and grains (16 %) and less fats, oils and sweets (283 %) than the observed consumption patterns of the referent group.
The present study set out to determine the cost of market baskets that were not only nutritious but also consistent with mainstream French diet. The present innovation was to let consumption constraints vary over a wide domain (seven levels), coming closer each time to the average French population diet. The upper bounds were not permitted a tenfold increase from average consumption; instead the upper bound was the 95th percentile limit for the population intakes. These limits were progressively applied to food groups, food sub-groups and food families for a much tighter fit between the optimised food plan and the typical French diet. At the strictest level, foods consumed by less than 5 % of the population were excluded from the model.
Systematic reduction of the distance between current consumption and the optimised food plans led to higher monetary costs. What is more, those higher costs far exceeded those of a more nutritious diet. Nutritious market baskets that corresponded to the population eat-ing habits cost several times more than market baskets that provided nutrition but ignored cultural requirements and social norms. It turns out that maintaining cultural norms was just as, if not more, expensive than improving the nutritional quality of the diet. The question arises whether other lowest-cost market baskets achieve their cost targets by ignoring or tolerating large differences from social norms.
Some similarities and differences with the official USDA food plans must be noted. Similar to the USDA food plans(31), the study was based on retail food prices and not expenditures. Unlike the TFP, the objective function minimised diet cost instead of minimising the difference between the modelled diet and existing food habits. Unlike the TFP, the present model used only nutrient-based con-straints and did not employ MyPyramid food category
S
Public
Health
S
Public Health Nutrition
Table 3 Market baskets for food plans at different levels of nutritional and consumption constraints in women
First level of required nutritional constraints (A) Third level of required nutritional constraints (C)
Consumption constraints 1, 5 and 7 Consumption constraints 1, 5 and 7
Food groups A1 A5 A7 C1 C5 C7
Added fats Oil Oil (2), butter, margarine,
mayonnaise and salad dressing
Oil, butter, margarine, mayonnaise and salad dressing
Oil (2) Oil (2), butter, margarine and salad dressing
Butter, margarine and salad dressing
Refined grains Porridge Porridge, toast, rusk, pasta and semolina
Toast, rusk, pasta and semolina
Porridge, pasta and semolina
Porridge, toast, rusk, pasta and semolina
Toast, rusk, pasta and semolina
Starches and wholegrains
– Peas (dry) and potatoes (2) Potatoes (2) Potatoes, wheat
germ
Peas (dry), potatoes (2), wheat germ, brown rice and haricot bean (canned)
Potatoes (2), beans (haricot, flageolet) and bread (wholegrain)
Vegetable – Peanuts, avocado and
coconut (dry)
Peanuts and avocado Carrot and radish Radish, chard, spinach, mixed vegetables (canned) and tomato sauce (canned)
Avocado, carrot, spinach, cucumber, broccoli, zucchini, mixed vegetables (canned) and tomato sauce (canned)
Fruits and nuts – – – – Banana, orange juice and
walnuts
Banana, walnuts and kiwi fruit Meats, eggs and fish – Eggs, fish cake, pork liver
paˆte´, beef heart and sausage
Eggs (2), pork and sausage
Chicken livers and herring
Herring, mackerel (canned), sardine (canned), lamb liver, pork liver paˆte´, meat paˆte´, beef stew and shellfish (frozen)
Eggs, salmon, meat paˆte´ and ground beef (15 % fat)
Dairy – Low-fat powdered milk and
low-fat milk
Low-fat milk Low-fat milk Low-fat milk, skimmed milk and
powdered skim milk
Low fat milk, plain yoghurt
Sweets Sugar Sugar (2), cookie, pancake
and chocolate spread
Sugar, cookie and pancake – Sugar (2), pancake, chocolate (2), sweetened condensed milk and cashews
Pancake and chocolate (3)
Mixed dishes – Pasta w/cheese – – Pasta w/cheese and cassoulet Paella and cassoulet
Number of foods in the same subcategory (e.g. potatoes) is indicated in parentheses.
6 M Maillot et al .
standards. Unlike the TFP’s use of fifty-eight food cate-gories, the present market basket was based on .600 individual foods. In reality, each participant in the INCA survey consumed ,50 different foods per week(17). Tai-loring the food plan to the eating habits of each individual is an alternative and more sophisticated approach(32)that could yield different results. In the present study, con-sumption constraints were introduced and progressively reinforced, whereas in the TFP, consumption constraints were fixed and it was the cost constraint that was intro-duced at different levels of severity.
The present data shed new light on the argument whether nutritious diets cost more than less nutritious ones. Food choices are a part of social identity, and the ability to adhere to a socially acceptable diet is one of the necessities of life(33). All too often, the low cost of powdered milk, ground pork, organ meats, beans, lentils, carrots and cabbage is cited as proof that low-income groups have full access to inexpensive yet nourishing foods. Persistent failures by low-income households to construct staple diets based around such foods have been explained in the past by a lack of motivation(34,35), lack of nutrition knowledge(36), lack of education or time or simply bad lifestyle choices by the poor(10). The present data suggest that the low cost of such diets is achievable only by tolerating a departure from social norms.
Studies on dietary change ought to take such norms into account. For example, intervention studies have persistently claimed that more healthful diets need not cost more and might even cost less(37–40). On the other hand, observational studies of populations have associated freely chosen healthful diets with higher energy-adjusted diet costs(41–48). It would be good to see whether the low-cost healthy diets that are introduced by researchers into schools and work-places are sustainable in the long term.
Other factors, not covered in the present study, may involve time poverty and food preference. Studies have noted that many of the USDA recipes were time con-suming when cooked from scratch, a situation remedied in the 2006 TFP that included more convenience foods(16). Interestingly, the premise underlying the official USDA food plans is that all foods are purchased at stores and cooked and prepared at home. Arguably, using lowest-cost food plans to calculate food assistance for the poor does not take into account time constraints and the need (or right) to eat away from home, consistent with broader societal trends.
Conclusion
Food budgets of the poor are often insufficient to assure a balanced diet(49–51). Even with efficient purchasing stra-tegies(52–55), the food budget may not suffice for a diet that is both nutritious and socially acceptable(56). Although some nutritious foods are inexpensive,
con-forming to societal norms also has a price. Calculations of the minimum cost of a nutritious diet need to take social and cultural factors into account.
Acknowledgements
The present study was carried out with the financial support of the French National Research Agency under the projects ANR-07-PNRA-018, ALIMINFO and ANR-05-PNRA, 012, POLNUTRITION and with support from USDA CSREES Grant 2004-35215-14441 and NIH grant R01 DK076608. There were no conflicts of interest. M.M. and N.D. conceived the study, conducted data and modelling analyses, interpreted the results and partici-pated in the writing of the report. A.D. participartici-pated in the conception and design of the study, interpreted the results and contributed substantially to writing the report. The authors declare no conflict of interest.
References
1. Smith A (1776) An Inquiry Into The Nature and Causes Of The Wealth of Nations, book V, Chapter II. London: printed for W Strahan and T Cadell in The Strand.
2. Darmon N & Drewnowski A (2008) Does social class predict diet quality? Am J Clin Nutr 87, 1107–1117. 3. Mackenbach JP, Stirbu I, Roskam AJ et al. (2008)
Socio-economic inequalities in health in 22 European countries. N Engl J Med 358, 2468–2481.
4. Drewnowski A & Specter SE (2004) Poverty and obesity: the role of energy density and energy costs. Am J Clin Nutr 79, 6–16.
5. Maillot M, Darmon N, Darmon M et al. (2007) Nutrient-dense food groups have high energy costs: an econometric approach to nutrient profiling. J Nutr 137, 1815–1820. 6. Reicks M, Randall JL & Haynes BJ (1994) Factors affecting
consumption of fruits and vegetables by low-income families. J Am Diet Assoc 94, 1309–1311.
7. Cox DN, Anderson AS, McKellar S et al. (1996) Vegetables and fruits: barriers and opportunities for greater consump-tion. Nutr Food Sci 5, 44–47.
8. Center for Nutrition Policy and Promotion (2008) American food: Still the best deal in the world. http://www.cnpp. usda.gov/Publications/FoodPlans/MiscPubs/AmericanFood-01-30-08.pdf
9. Center for Nutrition Policy and Promotion (2000) Recipes and tips for healthy thrifty meals. http://www.cnpp.usda. gov/Publications/FoodPlans/MiscPubs/FoodPlansRecipe Book.pdf
10. Parker-Pope T (2007) A high price for healthy food (Weblog with reader comments). The New York Times (5 December). http://www.nytimes.com/
11. Darmon N, Darmon M, Maillot M et al. (2005) A nutrient density standard for vegetables and fruits: nutrients per calorie and nutrients per unit cost. J Am Diet Assoc 105, 1881–1887. 12. Maillot M, Ferguson EL, Drewnowski A et al. (2008)
Nutrient profiling can help identify foods of good nutri-tional quality for their price: a validation study with linear programming. J Nutr 138, 1107–1113.
13. Stigler GJ (1945) The cost of subsistence. J Farm Econ 27, 303–314.
14. Smith VE (1959) Linear programming models for the determination of palatable human diets. J Farm Econ 31, 272–283.
S
Public
Health
15. Staff at the Center for Nutrition Policy and Promotion. Lino M (2001) The Thrifty Food Plan, 1999: revisions of the market baskets. Fam Econ Nutr Rev 13, 50–63.
16. Carlson A, Lino M & Fungwe T (2007) The Low-Cost, Moderate-Cost, and Liberal Food Plans (CNPP-20). Washington, DC: US Department of Agriculture, Center for Nutrition Policy and Promotion.
17. Volatier J-L (editor) (2000) Enqueˆte INCA (Individuelle et Nationale sur les Consommations Alimentaires). AFSSA, Agence Franc¸aise de Se´curite´ Sanitaire des Aliments. Paris: Lavoisier (in French).
18. Le Moullec N, Deheeger M, Preziosi P et al. (1996) Validation du manuel photographique utilise´ pour l’enqueˆte alimentaire de l’e´tude SU.VI.MAX. Cah Nutr Die´t 31, 158–164.
19. Black AE (2000) Critical evaluation of energy intake using the Goldberg cut-off for energy intake:basal metabolic rate. A practical guide to its calculation, use and limitations. Int J Obes Relat Metab Disord 24, 1119–1130.
20. Favier J, Ireland-Ripert J, Toque C et al. (1995) CIQUAL. Re´pertoire Ge´ne´ral des Aliments. Table de Composition. Paris: Lavoisier, Tec&Doc.
21. Ouvrage collectif (2006) Table de composition des aliments SU.VI.MAX. Paris: INSERM/Economica Editions.
22. Lamand M, Tressol J, Ireland-Ripert J et al. (1996) CIQUAL. Re´pertoire Ge´ne´ral des Aliments. Tome 4. Table de Composition Mine´rale. Paris: Lavoisier, Tec&Doc. 23. Souci SW, Fachmann W & Kraut H (2000) Food
Composi-tion and NutriComposi-tion Tables, 6th revised ed. Stuttgart: CRC Press/Medpharm Scientific Publishers.
24. Food Standards Agency (2002) McCance and Widdowson’s The Composition of Foods, sixth summary ed. Cambridge: Royal Society of Chemistry.
25. US Department of Agriculture, Agricultural Research Service (2006) USDA National Nutrient Database for Standard Reference. http://www.nal.usda.gov/fnic/foodcomp/search/ 26. Briend A, Darmon N, Ferguson E et al. (2003) Linear
programming: a mathematical tool for analyzing and optimizing children’s diets during the complementary feeding period. J Pediatr Gastroenterol Nutr 36, 12–22. 27. Martin A (editor) (2001) Apports Nutritionnels Conseille´s
Pour la Population Franc¸aise. Paris: Lavoisier.
28. Foytik J (1981) Very low-cost nutritious diet plans designed by linear programming. J Nutr Educ 13, 63–66.
29. Darmon N, Ferguson EL & Briend A (2006) Impact of a cost constraint on nutritionally adequate food choices for French women: an analysis by linear programming. J Nutr Educ Behav 38, 82–90.
30. Center for Nutrition Policy and Promotion (2007) Official USDA food plans: cost of food at home at four levels, US average, June 2007. http://www.cnpp.usda.gov/Publications/ FoodPlans/2007/CostofFoodJun07.pdf
31. Bowman SA (1997) A methodology to price food con-sumed: development of a food price database. Fam Econ Nutr Rev 10, apendix 1–10.
32. Maillot M, Vieux F, Amiot MJ et al. (2009) Individual diet modeling translates nutrient recommendations into realistic and individual-specific food choices. Am J Clin Nutr (Epublication ahead of print version).
33. Chilton M & Rose D (2009) A rights-based approach to food insecurity in the United States. Am J Public Health 99, 1203–1211.
34. Dibsdall LA, Lambert N, Bobbin RF et al. (2003) Low-income consumers’ attitudes and behaviour towards access, availability and motivation to eat fruit and vegetables. Public Health Nutr 6, 159–168.
35. Henry H, Reimer K, Smith C et al. (2006) Associations of decisional balance, processes of change, and self-efficacy with stages of change for increased fruit and vegetable
intake among low-income, African-American mothers. J Am Diet Assoc 106, 841–849.
36. Variyam JN, Blaylock J & Smallwood DM (1996) Modelling nutrition knowledge, attitudes, and diet–disease aware-ness: the case of dietary fibre. Stat Med 15, 23–35. 37. Raynor HA, Kilanowski CK, Esterlis I et al. (2002) A
cost-analysis of adopting a healthful diet in a family-based obesity treatment program. J Am Diet Assoc 102, 645–656. 38. Burney J & Haughton B (2002) EFNEP: a nutrition education program that demonstrates cost-benefit. J Am Diet Assoc 102, 39–45.
39. Mitchell DC, Shannon BM, McKenzie J et al. (2000) Lower fat diets for children did not increase food costs. J Nutr Educ 32, 100–103.
40. Ottelin AM, Lindstrom J, Peltonen M et al. (2007) Costs of a self-selected, health-promoting diet among the participants of the Finnish Diabetes Prevention Study. Diabetes Care 30, 1275–1277.
41. Cade J, Upmeier H, Calvert C et al. (1999) Costs of a healthy diet: analysis from the UK Women’s Cohort Study. Public Health Nutr 2, 505–512.
42. Darmon N, Briend A & Drewnowski A (2004) Energy-dense diets are associated with lower diet costs: a community study of French adults. Publ Health Nutr 7, 21–27.
43. Andrieu E, Darmon N & Drewnowski A (2006) Low-cost diets: more energy, fewer nutrients. Eur J Clin Nutr 60, 434–436. 44. Maillot M, Darmon N, Vieux F et al. (2007) Low energy
density and high nutritional quality are each associated with higher diet costs in French adults. Am J Clin Nutr 86, 690–696.
45. Schroder H, Marrugat J & Covas MI (2006) High monetary costs of dietary patterns associated with lower body mass index: a population-based study. Int J Obes (Lond) 30, 1574–1579.
46. Lopez CN, Martinez-Gonzalez MA, Alonso A et al. (2009) Cost of compliance with daily recommended values of micronutrients among a cohort of Spanish university graduates: the SUN [Seguimiento Universidad de Navarra] Study. Public Health Nutr 12, 2092–2096.
47. Monsivais P & Drewnowski A (2009) Lower-energy-density diets are associated with higher monetary costs per kilocalorie and are consumed by women of higher socioeconomic status. J Am Diet Assoc 109, 814–822. 48. Townsend MS, Aaron GJ, Monsivais P et al. (2009)
Less-energy-dense diets of low-income women in California are associated with higher energy-adjusted diet costs. Am J Clin Nutr 89, 1220–1226.
49. Vozoris N, Davis B & Tarasuk V (2002) The affordability of a nutritious diet for households on welfare in Toronto. Can J Public Health 93, 36–40.
50. Morris JN, Donkin AJ, Wonderling D et al. (2000) A minimum income for healthy living. J Epidemiol Commun Health 54, 885–889.
51. Nelson M, Dick K & Holmes B (2002) Food budget standards and dietary adequacy in low-income families. Proc Nutr Soc 61, 569–577.
52. McLaughlin C, Tarasuk V & Kreiger N (2003) An examination of at-home food preparation activity among low-income, food-insecure women. J Am Diet Assoc 103, 1506–1512. 53. Crotty PA, Rutishauser IH & Cahill M (1992) Food in
low-income families. Aust J Public Health 16, 168–174. 54. Hersey J, Anliker J, Miller C et al. (2001) Food shopping
practices are associated with dietary quality in low-income households. J Nutr Educ Behav 33, S016–S025.
55. Grant DK & Maxwell S (1999) Food coping strategies: a century on from Rowntree. Nutr Health 13, 45–60. 56. Stewart H & Blisard N (2006) The thrifty food plan and
low-income households in the United States: what food groups are being neglegted? Food Policy 31, 469–482.