A Computational and Experimental Study of the Underwater Implosion of Single and Multiple Metallic Spherical Shells
by
ENS Emma Grace Ferris
B.S., Naval Architecture U.S. Naval Academy (2015) Submitted to the Department of Mechanical Engineering in partial fulfillment of the requirements for the degree of
Master of Science in Mechanical Engineering FQ TECHNOLOGYMS INSTITUTE
at the
JUN 2
12017
MASSACHUSETTS INSTITUTE OF TECHNOLOGY
June 2017 LIBRARIES
ENS Emma Grace Ferris, MMXVII. All rights reserved.
ARCHIVES
The author hereby grants to MIT and The Charles Stark Draper Laboratory, Inc.permission to reproduce and to distribute publicly paper and electronic copies of this thesis document in whole or in part in any medium now known or hereafter created.
A uthor ...
Department of Mechanical Engineering May 12, 2017
Certified by ... .M. . . .. . . . .
.)1 Michael J. Ricard
Laboratory Technical Staff, Charles Stark Draper Laboratory, Inc. Thesis Supervisor Certified by... ... . ... .. . .... .
LC Jonathan Page Associate Professor of the Practice, Naval Construction and Engineering Thesis Supervisor
A ccepted by ... ... ... Professor Rohay Abeyaratne Professor of Mechanical Engineering Chairman, Committee on Graduate Students
A Computational and Experimental Study of the Underwater Implosion of Single and Multiple Metallic Spherical Shells
by
ENS Emma Grace Ferris
B.S., Naval Architecture U.S. Naval Academy (2015) Submitted to the Department of Mechanical Engineering in partial fulfillment of the requirements for the degree of
Master of Science in Mechanical Engineering at the
MASSACHUSETTS INSTITUTE OF TECHNOLOGY June 2017
@ ENS Emma Grace Ferris, MMXVII. All rights reserved.
MS INSTITUTE FQTECHNOLOGY
JUN 2
12017
LIBRARIES
ARCHIVES
The author hereby grants to MIT and The Charles Stark Draper Laboratory, Inc. permission to reproduce and to distribute publicly paper and electronic copies of this thesis
document in whole or in part in any medium now known or hereafter created.
A uthor ...
C ertified by ...
Signature redacted
Department of Mechanical Engineering May 12, 2017
Signature redacted
IN. Michael J. Ricard Laboratory Technical Staff, Charles Stark Draper Laboratory, Inc.,1;7/ Thesis Supervisor
Certified by... *......
Sianature redacted
LCLd/Jonathan Page Associate Professor of the Practice, Naval Construction and Engineering Thesis Supervisor
Accepted by ...
Signature redacted
Professor Roha* Abeyaratne Professor of Mechanical Engineering ...THIS PAGE INTENTIONALLY LEFT BLANK
A Computational and Experimental Study of the Underwater
Implosion of Single and Multiple Metallic Spherical Shells
by
ENS Emma Grace Ferris
Submitted to the Department of Mechanical Engineering on May 12, 2017, in partial fulfillment of the
requirements for the degree of
Master of Science in Mechanical Engineering
Abstract
Analysis of the implosion of pressure vessels in a deep-water environment is an important research area for the ocean engineering community. The majority of previous implosion re-search focused on the implosion of metallic cylinders, while the implosion behavior of volumes of different geometries and materials is less well researched. The behavior of pressure pulses resulting from the implosion of multiple pressure vessels is also less well researched. This thesis addresses these questions by investigating the implosion behavior of single and multi-ple spherical shells. Over the course of this research, I designed and predicted the collapse depth of metallic spherical volumes using shell buckling theory, then used a computational tool to model several implosion scenarios of both single and multiple sphere configurations. I then conducted implosion tests of single and multiple spherical shell configurations. The results from the initial computational models were compared with results of experimental tests and used to develop updated computational models that more accurately represented the true geometry of the test articles. Based on the analysis of the results of initial com-putational models and the experimental results, and the correlation between the updated computational models and experimental results, I identified ways to more accurately model scenarios involving implosions of spherical shells. In addition, I analyzed the behavior of a sympathetic implosion event involving two spherical shells and compared the result of the sympathetic implosion event to that of a single equivalent volume. This thesis concludes with guidance for future modeling and experimental testing efforts.
Thesis Supervisor: Dr. Michael J. Ricard
Title: Laboratory Technical Staff, Charles Stark Draper Laboratory, Inc.
Thesis Supervisor: LCDR Jonathan Page
THIS PAGE INTENTIONALLY LEFT BLANK
Acknowledgments
I would like to begin by thanking my family, friends, and classmates for their support during
the past two years at MIT.
This thesis was prepared at The Charles Stark Draper Laboratory, Inc. Numerous people and groups (including the Draper Metrology Lab and two talented high school interns) lent their expertise to my project. I would especially like to thank my advisor, Dr. Michael Ri-card, for his guidance and support throughout this endeavor, for his outstanding mentorship, and for encouraging me to engage in several enriching STEM outreach opportunities.
Next, I would like to thank Stephen Turner, Joe Ambrico, and Emily Guzas from the Naval Undersea Warfare Center Newport, who spent many hours teaching me how to use the DYSMAS computational software and sharing their invaluable research experience with me.
Experimental testing would not have been possible without the support of the Penn State Deep Ocean Test Facility, NUWC Survivability Lab, CM Spinning, and MIT Central Machine shop. I would especially like to thank the staff at DOTF for supporting implosion testing, especially Chris Baumler and Grant Maxwell who worked long hours on nights and weekends to fit my experimental testing into the facility schedule.
Lastly, I would like to thank my academic advisors CDR Weston Gray and LCDR Jonathan Page for their guidance in my academic work at MIT, and CDR Andrew Gish at the US Naval Academy for his implosion expertise.
The views expressed in this thesis are those of the author and do not reflect the official policy or position of Draper Laboratory, the United States Navy, Department of Defense, or the U.S. Government.
Contents
1 Introduction 15
1.1 Overview . . . . 15
1.2 Previous Research . . . . 16
1.3 Thesis Motivation . . . . 19
2 Analytical and Computational Modeling 21 2.1 Objectives . . . . 21
2.2 Shell Buckling Analysis . . . . 22
2.2.1 Theory . . . . 22 2.2.2 Results . . . . 25 2.3 Computational Analysis . . . . 26 2.3.1 Overview . . . . 26 2.3.2 Software Selection . . . . 26 2.3.3 Fluid-Only Models . . . . 29
2.3.4 Fully Coupled Fluid-Structure Computational Models . . . . 31
3 Experimental Testing 45 3.1 Objectives . . . . 45
3.2 Experimental Test Plan . . . . 45
3.3 3.4 3.5
3.2.2 Development of Test Plan . . . 3.2.3 Test Facility and Setup. . . . . Single-Sphere Implosion Tests . . . . . Sympathetic Implosion Test . . . . Results. . . . .
4 Analysis
4.1 O bjectives . . . . 4.2 Comparison to Initial Modeling Efforts . . . . 4.2.1 Overview . . . . 4.2.2 Differences in Collapse Pressure . . . . 4.2.3 Differences in Peak Overpressure . . . . 4.2.4 Differences in Time Duration of Collapse . . . . 4.3 Introduction of Imperfections to Computational Model
4.3.1 M ethod . . . . 4.3.2 Results. . . . . 5 Conclusions 8 . . . . 4 7 . . . . 4 8 . . . . 5 4 . . . . 5 7 .. . . . . 6 3 71 . . . . 71 . . . . 72 . . . . 72 . . . . 72 . . . . 74 . . . . 75 . . . . 76 . . . . 76 . . . . 81 99
List of Figures
2.1 Basic DYSMAS Coupled Code Architecture, as shown in DYSMAS User Manual 28
2.2 Results from initial GEMINI simulations of underwater bubble collapse . .. 30
2.3 5 inch single sphere model at t=0 . . . . 34
2.4 5 inch single sphere model at t=0.001 . . . . 34
2.5 5-inch single sphere model at t=0.0017 . . . . 35
2.6 Computational model configuration of two 4" spheres at t=0 . . . . 36
2.7 Computational model configuration of three 3.5" spheres at t=0 . . . . 36
2.8 Two 4" spherical shells at t=0.0015, collapsing symmetrically and simultane-ously about the ZY plane . . . . 37
2.9 Three 3.5" spherical shells at t=0.002, collapsing simultaneously about the ZY plane . . . . 38
2.10 Pressure time history of single 3.5" sphere implosion simulation . . . . 39
2.11 Pressure time history of single 4" sphere implosion simulation . . . . 40
2.12 Pressure time history of single 5" sphere implosion simulation . . . . 41
2.13 Pressure time history of two-sphere implosion simulation (4" spheres) . . . . 42
2.14 Pressure time history of three-sphere implosion simulation (3.5" spheres) . . 43
3.1 Interior view of weld zone of spherical test article . . . . 47
3.2 Detailed view of deviation near weld zone . . . . 47
3.4 Test Apparatus loaded on tank sled . . . . 50
3.5 Close-up view of sphere held in place on test apparatus by plastic disc . . . . 51
3.6 Free-field (top) and flush-mount (bottom) sensors were attached to the PVC test apparatus as shown here. . . . . 52
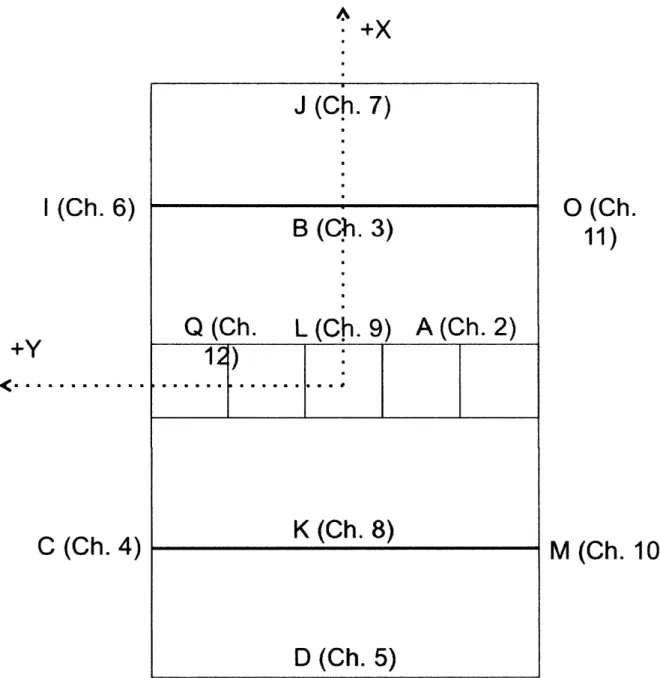
3.7 Sensor location on test apparatus as viewed from above . . . . 53
3.8 3.5" Diameter Sphere 3F after implosion . . . . 56
3.9 Sensor placement for two-sphere tests. . . . . 58
3.10 Sensor placement for three-sphere tests. . . . . 58
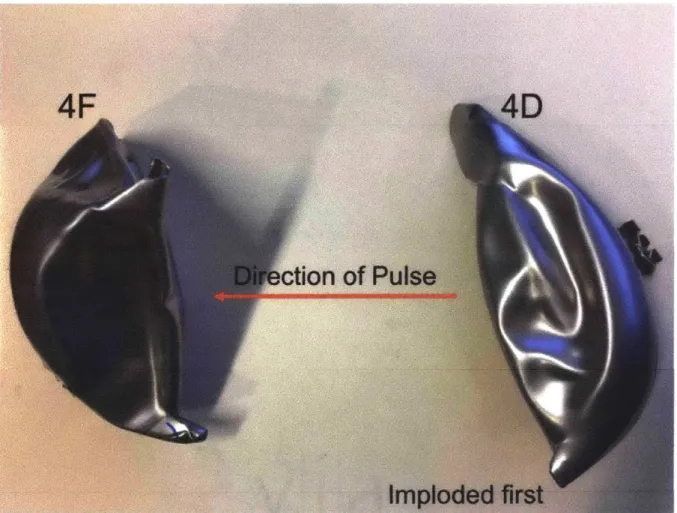
3.11 Suspected behavior of 4" spheres in test with observed sympathetic implosion, oriented as they were during the implosion test . . . . 61
3.12 Interior view of Sphere 4F . . . . 62
3.13 Top view of Sphere 4F . . . . 62
3.14 Predicted collapse pressure from computational tool compared to observed collapse pressures . . . . 64
3.15 Maximum pressure-time history recordings from each 3.5" single sphere im-plosion test . . . . 65
3.16 Maximum pressure-time history recordings from each 4" single sphere implo-sion test . . . . 66
3.17 Maximum pressure-time history recordings from each 5" single sphere implo-sion test . . . . ...67
3.18 Pressure-time history data from observed sympathetic implosion of spheres 4D,4F... ... 69
4.1 Diagram of spherical coordinate system used for sphere mapping program [4] 77 4.2 Decision process executed by the MATLAB code written to map coordinates of as-built spherical shells onto updated computational model input deck . . 78
4.3 Comparison of Stress-Strain curves . . . . 81
4.4 Comparison of collapse pressure predictions from original and updated models with experimental results . . . . 83
4.5 3.5" updated DYSMAS model at t=0.008 sec. . . . . 85
4.6 Sphere 3B after implosion . . . . 85
4.7 4" updated DYSMAS model at t=0.0015 sec. . . . . 86
4.8 Sphere 4B after implosion . . . . 86
4.9 5" updated DYSMAS model at t=0.00115 sec. . . . . 87
4.10 Sphere 5B after implosion . . . . 87
4.11 Sphere 3B (3.5" diameter) implosion compared to original and updated sim-ulation results . . . . 88
4.12 Sphere 4B (4" diameter) implosion compared to original and updated DYS-M A S results . . . . 89
4.13 Sphere 5B (5" diameter) implosion compared to original and updated model results . . . . 90
4.14 Impulse from Sphere 3B compared to original and updated model results . 91 4.15 Impulse from Sphere 4B compared to original and updated model results . 92 4.16 Impulse from Sphere 5B compared to original and updated model results . 93 4.17 Pressure pulse comparison between sympathetic implosion event and 5" single sphere implosion events . . . . 95
4.18 Impulse-time comparison between sympathetic implosion event and 5" single sphere implosion events . . . . 97
4.19 Impulse-time comparison between sympathetic implosion event and 4" single sphere implosion events . . . . 98
THIS PAGE INTENTIONALLY LEFT BLANK
List of Tables
2.1 Sample calculations of critical collapse pressure using several analytical methods 25 2.2 Table of design specifications for spherical shell test articles . . . . 25 2.3 Results from computational models compared to analytical predictions . . . 33
3.1 Table of original experimental test plan . . . . 48
3.2 Sensor location relative to origin of test apparatus . . . . 54
4.1 Discrepancies in collapse pressure between experimental results and values
predicted by original models . . . . 73
4.2 Maximum and average imperfections in fabricated spheres, as determined by Draper Metrology Lab measurements . . . . 74 4.3 Discrepancies in peak overpressure between experimental results and values
predicted by original models . . . . 74
4.4 Discrepancies in collapse pressure between experimental results and values predicted by original computational models . . . . 76
4.5 Material properties of steel batches used for fabrication of test articles . . . . 79
4.6 Discrepancies in collapse pressure between experimental results and values predicted by updated models . . . . 82
4.7 Discrepancies in peak overpressure between experimental results and values predicted by updated models . . . . 84
4.8 Discrepancies in collapse pressure between experimental results and values predicted by original models . . . . 84
Chapter 1
Introduction
1.1
Overview
Underwater vehicles use a variety of equipment which could collapse if subjected to hy-drostatic or hydrodynamic events that exceed their capabilities. This event is called an implosion. Any pressure vessel in the deep ocean environment that could potentially im-plode must be properly designed, evaluated, and located so that the likelihood of implosion is reduced. One must understand single and multiple implosion events and the resulting hydrodynamic pressure profiles in order to determine the correct design parameters for indi-vidual implodable volumes and to determine the correct arrangement of multiple implodables volumes.
An implodable volume is a structural shell surrounded by a fluid at a pressure higher than that of the interior space, which is typically filled with gas [12]. If the structure is too weak to withstand the external pressure, or if it experiences a dynamic force, it is liable to collapse, resulting in an implosion. The fluid immediately surrounding the object experiences a period of low pressure as the fluid rushes in to fill the relatively low-pressure gas bubble [12] [17]. The volume of gas compresses and then expands again and pushes the fluid outward, and the
surrounding fluid experiences a period of much higher pressure. The repeated compression and expansion of the gas bubble generates pressure waves that could subject nearby objects to a dynamic load. The first wave front of the pressure wave profile caused by this repeated expansion and compression, or peak overpressure, is greater than the ambient pressure. The magnitude of the peak overpressure diminishes as the wave propagates outwards and the distance r from the object increases at a rate of 1/r2 in the near-field and at a rate of 1/r
in the far-field [5][10].
Pressure vessels designed to the same specifications may still exhibit variability in their collapse pressures, often due to imperfections that occur during the manufacturing process, which cause structural instabilities. The implosion behavior of spherical pressure vessels is particularly difficult to predict because the structural stability of a spherical shell is de-pendent on perfect symmetry and sensitive to imperfections. Therefore, engineers should consider several factors when designing pressure vessels: the hydrostatic and dynamic pres-sure loads the vessel can withstand, the likelihood the object will implode, and the fluid response that would result from an implosion event. This thesis aims to address several of these considerations; namely, the effect of imperfections on the predicted collapse pressure of spherical shells, and the ability to predict the resulting fliid response due to the implosion of single and multiple spherical shells.
1.2
Previous Research
Previous implosion research focused on understanding the mechanisms of structural failure, predicting the buckling load of pressure vessels, determining the pressure wave profile re-sulting from underwater implosions, investigating the behavior of sympathetic implosions, and quantifying the energy of underwater implosions. Much of the research on underwater implosions focused on metallic cylindrical shells and has led to a greater understanding of
the structural failure that occurs during the implosion of a cylindrical pressure vessel and the resulting fluid response. Gupta used Digital Image Correlation (DIC) techniques to observe the behavior of a metallic cylindrical shell as it imploded. By determining the velocity of the walls of the cylinder as it collapsed, he determined the velocity of the fluid surrounding the cylinder, and therefore captured the deformation history of the object as well as the fluid response [16]. Turner's investigation of the implosion of thin-walled metallic cylinders used experimental tests and a computational model to describe the buckle propagation and pressure pulse formation due to the collapse of the structure. Their research showed that the time at which the peak pressure occurs coincides with the time of wall-to-wall contact; the pressure pulse then decreases as the buckle propagates outwards towards the ends of the
cylinder [17].
Early studies of metallic spherical shells by Vanzant observed several phenomena that could account for observed differences in expected and actual implosion behavior [5]. The aluminum spheres tested showed a large amount of variability in collapse pressure and col-lapsed asymmetrically, which caused a directional implosion. A directional response means the implosion pulse could be of particularly large magnitude in one direction; however, the direction of collapse is difficult to predict unless existing imperfections are known, and even then may not be fully predictive [5][2]. Upon collapse, Vanzant observed the implosion caused the formation of many small gas bubbles instead of one gas large bubble. Turner's study of the implosion of glass spheres indicated that the failure time history is an important factor for determining the magnitude of the pressure pulse resulting from spherical implo-sions [2]. Additionally, an acoustical study of the implosion of glass spheres noted that for pressure vessels made from a brittle material such as glass, a greater percentage of the po-tential energy is transmitted as a pressure wave than is seen for metallic pressure vessels [14]. These studies did not, however, investigate the failure of spherical shells fabricated from a material that exhibits plastic deformation, which would cause a different response from the
surrounding fluid.
Quantifying the effect of the implosion of multiple pressure vessels caused by sympathetic implosion presents another challenge. Sympathetic implosion occurs when the implosion of a single pressure vessel triggers the implosion of nearby pressure vessels. One example of damage caused by such an event is the sympathetic implosion event at the Super-Kamiokande facility in 2001. The implosion of a single gas-filled glass tube caused a chain reaction, which ultimately led to the failure of 7,000 of the 11,000 photo-multiplier tubes. Further research on sympathetic implosion aims to prevent catastrophic incidents such as this from happening again, as this event also carried a price tag - each photomultiplier tube was valued at $3,000 [6]. Sympathetic implosion events have also been observed in a research environment. Gupta found during tests of aluminum cylindrical shells that the implosion of a weaker implodable volume inside a confining environment could trigger the implosion of a stronger pressure vessel [13]. During these experiments, Gupta also observed a significant "water hammer" effect, indicating that multiple implosions may be more problematic than a single implosion event [13].
Several studies focused on analyzing the amount of potential energy converted to kinetic energy in the form of pressure waves during an implosion in order to predict the damage potential of the implosion event. The available potential energy of an implodable volume is proportional to the hydrostatic pressure at which it is located and the internal volume of gas. Most of the available potential energy is lost in the deformation of the structure. Gish conducted an analysis on the plastic energy dissipation due to membrane stress and the bending of a structure as it failed during an implosion in order to quantify the amount of energy lost due to deformation of the structure in the event of an implosion. He found that approximately 15% of the available energy prior to implosion is realized in the implosion pressure pulse [7]. An energy balance analysis conducted by Chamberlain, Guzas, and Ambrico found that the collapsing structure absorbs approximately 92% of available potential
energy, while 3% went to compressing the internal gas, and 5% was propagated as a pressure pulse. To confirm these findings, the authors also conducted an analysis of previous implosion test results and found that the structure absorbed between 80-93% of the available potential energy, while only 1-6% was radiated as a pressure pulse. They concluded that for ductile material, the majority of energy goes into deforming the structure [8] [7]. Theoretically, based on analysis of the available potential energy, the implosion pulse of a single sphere should be equal to the implosion pulse of two spheres of a total volume equal to that of the single sphere. However, simulations of the implosions of multiple adjacent cylinders have shown that the resulting pressure pulse from multiple implosions may not be the same as the implosion of a single equivalent volume. Therefore, further research on the effect of multiple implosions is important in order to determine the best way to predict the result of multiple implosions.
1.3
Thesis Motivation
Previous research conducted by Gupta and Turner that correlated experimental results to computational models and investigated sympathetic implosions focused on cylindrical pres-sure vessels. Vanzant and Turner's investigations of metallic and glass spheres, respectively, did not utilize computational methods or investigate sympathetic implosion events. This research aims to apply lessons learned from studies of cylindrical pressure vessels to metallic spherical pressure vessels.
In this thesis I approach the topic of underwater implosion from an analytical, compu-tational, and experimental perspective. In Chapter 2, I first compare different methods of predicting the collapse pressure using the theory of shell buckling, and then use shell buck-ling formulas to predict the collapse pressure of the metallic spherical shells to be used for computational models and experimental tests. For the section on computational modeling,
I describe the software selection process and the methods used to simulate the underwater implosion of spherical shells. I then present the results of fluid-structure models that sim-ulate several different sizes and configurations of implosions of spherical shells. In Chapter 3, I describe the experimental tests of single and multiple metallic spherical shells imploded in a pressure tank. In Chapter 4 I compare the results of experimental tests with the re-sults of initial computational models. I then discuss methods of improving the models to better account for the imperfections present in the test articles, and compare the results of updated computational models to experimental results. Additionally, I discuss the results of an observed sympathetic implosion event and compare the results of this test to the results of 'comparable single-sphere implosion tests. Finally, chapter 5 presents the ways in which modeling methods could be improved in order to more accurately simulate an implosion event, and provide guidance for future experimental testing of sympathetic implosions.
Chapter 2
Analytical and Computational
Modeling
2.1
Objectives
The goal of this chapter is to describe the analytical and computational methods used to predict the implosion of a spherical shell. I begin by outlining several different analytical methods used to approximate the collapse pressure of a spherical shell using the theory of shell buckling, and approximate the peak overpressure resulting from an implosion using a fluid-only computational model. Then, I describe how these methods influenced the design of the spherical test articles used for computational modeling, and later, for experimental testing. The section on computational modeling describes the methods and software used to predict the collapse and resulting fluid response from an implosion, and compares the results of computational models to the solutions of shell buckling equations.
While the two methods are presented separately in this chapter, it is important to note that I pursued the shell buckling analysis and fluid-only computational models concurrently. This is because the shell buckling analysis allows for initial structural predictions, while
fluid-only computational analysis allows for initial fluid response predictions. The combined results of these two analyses led to the design parameters for the test articles analyzed in the fully structured computational analysis and in the experimental tests.
2.2
Shell Buckling Analysis
2.2.1
Theory
One can predict the collapse pressure for a spherical shell using shell buckling theory. Clas-sical shell buckling theory assumes a perfect spherical shell and therefore over-predicts the collapse pressure, PFR
[91.
Several empirical formulas have been developed to more accurately predict collapse pressure. The original theoretical investigation of the buckling behavior of thin spherical shells culmiantes in the Zoelly-Van der Neut formula, derived from the theory of small deflections and the solution of linear differential equations [9]. The resulting formula for the critical buckling pressure, PCR, is based on the elastic modulus, E, of the material of the pressure vessel, ratio of radius to thickness, m = R/t, and Poisson's Ratio, v, and is shown by Equation (2.1).2E
PCR= 2 (21
Equation (2.2) shows the Zoelly-Van der Neut formula simplified for a typical Poisson's
ratio of v = 0.3:
E
PCR,Z = 1.21- (2.2)
Subsequent experimental tests at the California Institute of Technology that investigated the true buckling pressure of thin spherical shells introduced a correction factor to provide the lower limit of the elastic buckling limit. The results of the experimental work showed that
spherical shells could experience buckling at pressures as low as 25% of the critical pressure predicted by the Zoelly-Van der Neut formula. This Zoelly-Van der Neut formula had been derived by assuming that buckling theory for flat plates could be applied to spherical shells; however, it did not take into account curvature or manufacturing imperfections that could have accounted for the lower critical buckling pressure. The formula resulting from this work, for a Poisson's ratio of v = 0.3, is shown in Equation (2.3).
E
PCR,C = 0.37 - (2.3)
While both the Zoelly-Van der Neut and Cal Tech formulas are derived from elastic shell theory, Krenzke [9] concluded through experimental tests that even more precise predictions can be obtained by including plasticity and the values of secant and tangent elastic mod-ulus. Additionally, Krenzke noted that several factors should be considered in the "real" environment when considering the buckling behavior of spherical shells:
1. Local and/or overall out-of-roundness
2. Thickness variation
3. Residual stresses
4. Penetration and edge boundaries
Krenzke found that the buckling formula predicted by CalTech tended to be overly con-servative, and determined another formula for collapse pressure, shown in Equation (2.4).
PCR,K 0.84 2 (2.4)
Existing literature supports the analysis of failure modes of spherical shells. Khakina investigated the buckling load of thin spherical shells and showed that a finite element
tool could be used for computational analysis of shell buckling. Khakina also found that initial failure was highly sensitive to imperfections and should be accounted for in order to obtain more accurate failure predictions [11]. This supports Krenzke's observation that imperfections including out of roundness and thickness variation have a large impact on the final collapse pressure. With this in mind, it is apparent that computational models of spherical shells without any imperfections may not be able to accurately predict the failure load for the spherical shells used in experimental testing for this research. For this reason, the computational models will be revisited at the conclusion of experimental testing in order to determine if the addition of imperfections provides a better prediction of actual collapse pressure.
Further analysis of the experiments conducted for this thesis research, addressed in Chap-ter 4, focuses on the first two considerations presented by Krenzke. I used shell buckling equations shown by Equation (2.2), Equation (2.3), Equation (2.4), and the formula devel-oped by Vanzant [5], as shown by Equation (2.5), to design the spherical shells used in the implosion experiments by solving for shell thickness given a prescribed radius and collapse pressure.
PCRV = 0.75E( )2 (2.5)
The sample calculations shown in Table 2.1 are for a spherical shell made out of stainless steel with a radius of 1.75" and wall thickness of 0.018". I ultimately chose to design the spherical test articles based on the collapse pressure predicted by Vanzant [5], because its basis was most aligned with my objectives.
Sample Calculations for Collapse Pressure
Quantity Description Value Units
E Elastic Modulus 9.43 Msi
v Poisson's Ratio 0.3 N/A
R radius 1.75 in
t thickness 0.018 in
m radius/thickness ratio (R/T) 97.2 in/in
PCR,Z Zoelly-Van Der Neut Critical Pressure 1207 psi
PCR,K Krenzke Critical Pressure 838 psi PCR,C CalTech Critical Pressure 369 psi
PCR,V Vanzant Critical Pressure 748 psi
Table 2.1: Sample calculations of critical collapse pressure using several analytical methods
2.2.2
Results
In order to determine the parameters for computational analysis and for the test articles to be used in experimental tests, I conducted a parametric analysis of spherical shells of diameters ranging from 3" to 6" at increments of 1/2" with the goal of choosing three different sphere sizes. I considered using both aluminum and stainless steel as materials. For different diameters and materials, I changed the thickness in order to obtain an average collapse pressure of about 1000 psi based on the formula for shell buckling developed by Vanzant [5]. The last requirement was that the small sphere have an internal volume of approximately 1/3 that of the largest volume, and that the medium sphere have an internal volume of approximately 1/2 that of the largest volume in order to accommodate tests of multiple implodable volumes. Complete design specifications are detailed in Table 2.2.
Test Article Specifications ________
Sphere Diameter Wall Thi s Arn) Predicted Collapse Internal Volume
(in) Pressure (psi) (cm3)
3.5 0.018 750 22.5
4 0.024 1018 33.5
5 0.030 1018 65.5
Table 2.2: Table of design specifications for spherical shell test articles I
2.3
Computational Analysis
2.3.1
Overview
Computational analysis of underwater implosion allows for a more cost effective method of predicting implosion behavior because it does not require the time and expense of tests conducted at sea or in pressure tanks. I chose to model the implosion of spherical shells using a computational tool in order to allow for comparison to experimental results, and to determine if computational tools are able to model the implosion behavior of pressure vessels. Based on the comparison of the experimental results and computational results, I assessed the accuracy of using computational models to simulate the implosion of spherical shells. Additionally, I created computational simulations of two and three sphere configurations in order to determine if the computational tool could model a sympathetic implosion event, and therefore investigate the fluid response due to a sympathetic implosion.
In this section I will describe the process of software selection and the theory behind the software used for analysis. I conducted this computational analysis in two parts: first, I looked only at the fluid response resulting from the collapse of gas bubbles in high-pressure water; then I ran simulations of fluid-structure models of underwater implosions of spherical shells in the same configurations as the test articles that were to be tested experimentally.
2.3.2 Software Selection
It was important that the chosen computational tool be able to model both the structural behavior of the imploding pressure vessel and the resulting fluid response. For this reason, it was necessary to use a computational tool that was capable of coupling finite element analysis of the structure as well as a computational fluid dynamics solver for the surrounding fluid. Ultimately, I selected the fluid-structure solver Dynamic System Mechanics Advanced
Simulation (DYSMAS). While tools such as SolidWorks and COMSOL can execute both
structural and fluid analysis, they were both found unsuitable for the purpose of modeling implosions for several reasons. SolidWorks has a finite element analysis functionality, but its ability to analyze fluid behavior is mostly limited to simulations of fluid flow through or around a structure. I initially considered COMSOL for use as a modeling tool due to its ability to incorporate structures built in SolidWorks. However, while COMSOL is capable of modeling complex hydrodynamics, COMSOL did not prove adequate for modeling a dynamic fluid response resulting from a structural failure.
The overall theory behind finite element analysis (FEA) involves breaking up a structure into a framework of smaller manageable chunks. The formulas governing the structure's behavior are matched to each individual piece of structure, but each element is also dependent on the behavior of the element adjacent to it. Computational Fluid Dynamics (CFD) is similar to FEA, but is for a fluid grid instead of a structure. Because FEA and CFD involve solving for many small fluid or structure elements simultaneously at many small time steps, instead of for an entire structure or fluid volume only at initial and end states, the computational load of these calculations is very high. Therefore, computational tools that utilize FEA and CFD are often run on parallel computing systems that allow for multiple processors to operate in parallel to carry out calculations.
The DYSMAS computational analysis tool models the fluid as an Eulerian mesh using the fluid solver "Gemini" and the body as a Lagrangian mesh using the structural solver "ParaDyn". The Eulerian method observes a specific area in space and the fluid parcels travel through that area over time. The Lagrangian method of analysis observes the location of a specific piece of structure over time. In DYSMAS, the surface of the structural body is made up of a grid of user-specified nodal coordinates that in turn define structural elements. The user can define these elements as fluid-loaded or "wetted". Both the fluid and structural codes run at the same time, with information from both the fluid and structural mesh being exchanged at time steps determined by the user. The node locations and velocities from the
structural solver are sent to the fluid solver, which returns the forces acting on the node due to the fluid. DYSMAS calculates the nodal force based on the contributions from applied loads specified by the user, contact interactions from the fluid or from contact with other parts of the structure, and internal deformations of the structure [1]. The DYSMAS overall code architecture is shown in Figure 2.1.
DYSMAS Coupled CodeAhiur
I-Figure 2.1: Basic DYSMAS Coupled Code Architecture, as shown in DYSMAS User Manual
One advantage of using DYSMAS was that since fully-coupled DYSMAS simulations are run on a high performance computing network, high fidelity models involving very small fluid and structural element sizes and over very small time steps could be run in a matter of hours. Applications run on a single processor would not be able to accommodate that level of detail in an efficient time frame. Another reason DYSMAS was selected was because
- -- - I I ' "L -MW
DYSMAS had previously been used for underwater implosion and explosion research. Turner
and Ambrico observed high correlation between DYSMAS computational model results and experimental data from implosion tests of aluminum cylindrical shells [17].
2.3.3
Fluid-Only Models
Overview
The pressure response caused by the collapse of a spherical bubble is greater than that caused by the collapse of an imploding structure of equivalent volume due to the amount of energy required for the deformation of the structure, as stated previously. Therefore, in
order to begin my investigation into computational modeling of the implosion event, I began with simple fluid-only models of spherical bubbles of 3", 6", and 9" diameters, as the peak overpressure from these simulations would be much greater than the peak overpressure from the collapse of an implodable volume of the same size. Although the fluid-only models over-predict peak pressure, I used the results of the models to determine what size of implodable volume had the potential to cause peak overpressures that would be too high for the pressure facility that would be used during the experimental tests.
Lord Rayleigh first described the growth and collapse of a gas bubble in a fluid in 1917, and in 1949 Plesset applied his work to the problem of bubble cavitation, resulting in the generalized Rayleigh-Plesset equation for bubble dynamics. The equation relates the pressure inside the bubble boundary, Pb, and the exterior pressure p,,, the density PL and viscosity
-IL of the surrounding liquid (assumed to be constant), the surface tension S, and the radius
of the bubble R [3], as shown by Equation (2.6).
Pb(t) -PA t PoW= R dR+ 3-( 0 0(t) Rd2R 3(d R)d)2 2 + 4y 43LdR +2SR+ 2S(2.6)
PL dt2 2 dt R dt pLR
a momentary large pressure, observed as the peak overpressure. The time-varying component of pressure pa, which relates the density of the fluid, the changing volume of the bubble over
time iff, and the distance from the cavitation center R, can be given by Equation (2.7).
Pa P d2(27)
4"rR dt2
The magnitude of the collapse can be measured by the acoustic impulse I, which is defined as the area under the pressure pulse vs. time plot, as shown in Equation (2.8).
I = *f2Padt (2.8)
ti Simulation Inputs and Results
GEMINI Bubble Collapse Results
Bubble Diameter
3" 6" 9"
Distance from
igi n Peak Pressure (ksi)
2R 7.74 8.43 8.01
4R 3.09 2.997 2.99
1OOR 0.109 0.41 0.851
Collapse Depth: 1000 m
Figure 2.2: Results from initial GEMINI simulations of underwater bubble collapse
The fluid solver Gemini uses a rectangular mesh that can be run in 1, 2, or 3 dimensions. To increase simplicity in Gemini bubble collapse models, the 1-Dimensional case was used with spherical coordinates. The user specifies "body" coordinates in order to separate the different fluids used in the simulation [1]. The parameters for the initial fluid models included a gas bubble of a specific size comprised of air at atmospheric pressure surrounded by water at a pressure of 1000 psi. Based on the results of the bubble collapse simulations, the initial
constraint on sphere size was that the spheres be 6" or less in diameter. Constraining the sphere design to this size or smaller reduced the effect of the pressure waves reflected from the pressure tank walls, and ensured that the peak overpressure was within the limitations of the pressure tank. Based on the results shown in Figure 2.2, I determined that the test article size should be between 3" and 6", and used these values to bound the parametric analysis of the structural collapse of different sized spherical shells conducted in Section 2.2.
2.3.4 Fully Coupled Fluid-Structure Computational Models
Overview
As stated in the chapter overview, fully coupled fluid-structure computational models created in DYSMAS involve both a structure built of many small elements, and a corresponding fluid grid. The Gemini fluid-only bubble collapse simulations and the results of the shell buckling analysis determined the dimensions of the spherical shells run as fully coupled fluid-structure simulations.
Simulation Inputs
Fully coupled fluid-structure simulations are the final product of several preparatory steps, the first of which involves building the spherical shell structure in a pre-processing tool. The pre- and post-processor included in the DYSMAS software package, DYSMAS/P, allows the user to construct structural elements for use in the final simulation. The user specifies the type of structure and element size. In the case of the spherical shell, I specified a spherical shell with a certain number of elements along each axis. The group of elements making up the spherical structure are defined as "shell" elements with a specific thickness and as "interface" elements, meaning they will correspond to a fluid element on one or both sides. In this case, the shell elements interact with a water fluid element on the outer side, and an
air fluid element on the inner side. When these steps are complete, the user prompts the pre-processor to generate the input text files required for use in the fully-coupled simulation. The "input deck," or collection of files generated by the pre-processor, is comprised of text files specifying the number and location of nodes, the number and type of shell elements, the number of interface elements, the material properties of the shell, the loads applied to each element, and the definition of the load curve to be applied to the shell. The fluid grid input deck is created separately.
The first pre-load simulation runs in a "debug" queue on two processors to make sure there are no errors in the input decks. In this run, the user pressurizes the fluid according to a specified rate. As the surrounding fluid is pressurized, the structural elements eventually collapse upon reaching the object's buckling pressure. The simulation is set to run for a user-defined time period and generates output files at user-defined time steps, which the user can later analyze using the processing tools included in DYSMAS/P. The post-processing tools allow the user to determine the time of structural collapse and therefore the collapse pressure based on the rate of pressurization of the fluid. The next pre-load run is identical to the first, except that it is set to stop at the time just before the structure collapsed. The final result of this second pre-load run is a file that defines the displacement, velocity, acceleration, and resulting stresses on each of the shell elements just before collapse. The final fully-coupled run utilizes this file to create the fluid grid: in this case, air fills the structure, while water surrounds the structure as defined by the output file. The user defines the pressure in the fluid grid as the exact collapse pressure determined from the pre-load runs in order to save computational time.
Results
Analysis of the results showed the spheres collapsing along the equator and generating peak pressure waves with magnitudes less than those generated from the fluid-only model. The simulated collapse pressures, shown in Table 2.3, are close to the values predicted by shell buckling equations.
DYSMAS Simulation Results
Predicted Col- Model Col- Model Max Model Min
Scenario lapse Pressure lapse Pressure Peak Over- Peak
Over-(psi) (psi) pressure (psi) pressure (psi)
3.5" Single 750 898 2070 1211
4" Single 1018 1060 2515 1511
5" Single 1018 1054 3252 1738
4" Double 1018 767 1987 1089
3.5" Triple 750 642 3098 1006
Table 2.3: Results from computational models compared to analytical predictions
Figure 2.3, Figure 2.4, and Figure 2.5 show the collapse progress of a single 5" sphere throughout the course of an implosion simulation. Figure 2.3 shows the sphere at the be-ginning of the simulation, while Figure 2.4 and Figure 2.5 show the collapse mode and the final collapse shape. It is important to note that because the simulation does not take into account any imperfection in the shell, the sphere collapses symmetrically about the XZ plane. The simulation collapses along this plane because of the way the model was built in the pre-processing tool. Spherical shell elements are constructed by first defining a 1/8, 1/4, or 1/2 segment to be built, then reflecting that segment across a user-defined plane. In this case, I built a half sphere and then reflected those nodes and elements across the XZ plane. Additionally, because the DYSMAS/P builds quadrilateral elements, the elements for a spherical shell are not all the same size. The elements about the equator are larger and more similar to their adjacent elements than those elements at the poles, which would contribute to differences in geometric stability at the equator and the poles.
DOME+W
OBUDDfE+L
IOMM-Figure 2.3: 5 inch single sphere model at t=0
Figure 2.4: 5 inch single sphere model at t=0.001
R-Aw VAdy SASME4M AM j4E4M ,-IMw4w 39USE- ffl 12MSE M 27436E43 22A7E4M I 6997E M IIME M 5 79MM 33WE M W. 3 3W4E.DI Q Nft 4% W..: S.4534EM a M& 117
Result an1 Ve.octy
I2.290E-34
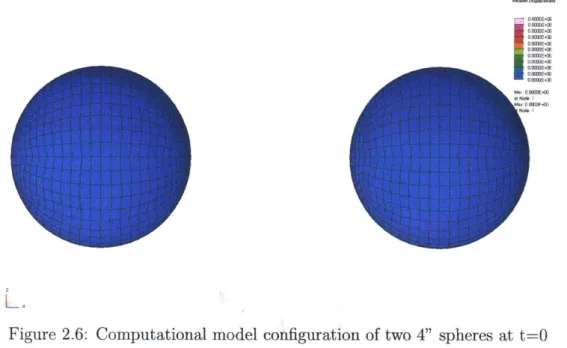
I BIA1E-k4 1.3777E +04 I154EI03 9.4118 2B 0 7.2294E+43 5.047OE+03 2.4E+0 Mi:68213E-02 Max 22ME+(4 Node 257Figure 2.6 and Figure 2.7 show the configuration of the two and three-sphere simulations as modeled in DYSMAS:
R.EUDE CX
kNaN
Figure 2.6: Computational model configuration of two 4" spheres at t=O
OOOODE 00 MODOOE100 OOOOUE-" 0 MOGEw DOOME4CO a OMDE4110 0 OODUE '00 O.ODME -M DOOODE-00 O.OMOE400 0 MOOE M MU, GIBM" w W& I M.. OOM-W .1 ftd. I L.
Figure 2.8 and Figure 2.9 show that simulations of the two and three sphere tests did not show sympathetic implosion. Because the two and three sphere configurations used identical spheres, the structures collapsed at exactly the same time. One sphere did not trigger the
collapse of the adjacent sphere.
Resultant Velocoly 6i47E+M1 5991E+13 51454E 03 i4613E 03 6.10l47E.01 WM. 6.1047E401 .5.5Mode 574
Figure 2.8: Two 4" spherical shells at t=0.0015, collapsing symmetrically and simultaneously about the ZY plane
Although it may appear from Figure 2.9 that the right-most sphere is initiating the collapse of the center and left spheres, all three spheres begin collapsing at the same time. The reason for the appeared directionality of the collapse is likely due to the way in which the simulation was constructed. In the preprocessing software, the center sphere was constructed first; then the built nodes and elements were reflected across a specified plane, then reflected again across the ZY plane to construct the third sphere. The result is that the initiation location of the collapse of the far right sphere appears to mirror that of the center and left spheres.
Resultanr Velocity 7 64oE-a 5 8033E 403 48619EoO3 3.9325E+03 2 7OE403 1.1262E.03 W.: 1.9075E+02 at Node 2214 t Max 9.6450EoO at Node 394
Figure 2.9: Three 3.5" spherical shells at t=0.002, collapsing simultaneously about the ZY plane
When setting up the simulation, I specified "sensor" locations in the fluid grid at the same locations as they would be located during experimental tests. This included a total of 11 sensors in the near-field (r < 2R) and far-field regions. During the fully-coupled run,
DYSMAS saved the pressure time history at these locations in the fluid. After running the simulation, the time-history viewer included in the DYSMAS/P post-processing package illustrated the pressure time history of the implosion pulse as recorded at the specified locations. It is apparent from the pressure time history results of 3.5", 4", and 5" single sphere implosion simulations (Figure 2.10, Figure 2.11, and Figure 2.12, respectively) that the peak overpressure diminishes as distance from the implosion event increases. The results also illustrate the time lag between the pressure pulse reaching the near-field sensors to those located farther away.
Figure 2.10: Pressure
1.5 2
Tie
time history of single 3.5" sphere implosion
s2-5
simulation
3 x
1-less pronounced peaks and more noise than their single-sphere counterparts, which is likely caused by the interfering pressure waves emanating from the multiple implosion events. The peak overpressure resulting from the two and three sphere tests were both less than the peak overpressure resulting from the single 5" implosion of equivalent volume (3252 psi), as
2SOOF
2000-
1500[-Left Side Bac Left Side Frmnt
Flush Mount Back
New Fidd 2
New FIdd 4
Flush Mount Front
- Top Back
Top Front
Right Side Back Right Side Front
i
100
2600 2400 2200 2000 1800 CL 16O 1400-12001 1000 Left - Left -- -Flus Nea Nea Top~ - -Righ Righ -ao-Side Back Side Front h Mount Back r FAd 2 Fid 4 h Mount Front Back Front it Side Back t Side Front soo 0 Ob 1 15 2 2b 3 3,5 4 Time x 104
Figure 2.11: Pressure time history of single 4" sphere implosion simulation
illustrated by the fact that neither plot shows a peak pressure that reaches the top horizontal line, which represents the peak overpressure caused by the single implosion of a 5" sphere. The simulated implosion of two 4" spheres resulted in an implosion that was less than the peak overpressure caused by both the 5" single sphere and the 4" single sphere (2515 psi). t
3500 r 3000,2500 -2000 15001 1000 500 I 2 3 ime 4 6 6
x1i0-Figure 2.12: Pressure time history of single 5" sphere implosion simulation
The simulated implosion of three 3.5" spheres caused a peak overpressure that was greater than that of a single 3.5" sphere (2070 psi), as illustrated by the peak overpressure exceeding the bottom horizontal line representing the peak overpressure caused by the collapse of a single 3.5" sphere. However, the simulated implosions of two and three sphere configurations
I
I
Left Side Back Left Side Front Flush Mount Be* New Fild 2
Now Field 4
Fhish Mount Front Top Back
- Top Front
Right Side Back
Right Side Front
occurred at lower collapse pressures than all of the single sphere tests, which indicates that if these implosions of multiple volumes had occurred at a higher collapse pressure, a higher peak overpressure would have been recorded as well. These results indicate that implosions of multiple spheres will likely result in higher peak overpressure values, but may not be equivalent to the implosion of a single pressure vessel of equivalent volume.
3600 r 300O1-, 2000 CL - Ldt Side Back - Near Field I Ldt Side Frot Rush Mount Back Near Field 3
Flush Mount Front
3p Bdi
)p Front Ight Side Back
ear Field 5 WK Side FRat 1500 -1000 G00[ -f-t -M S0.5 Is1 2 2.6 FThe x 103
3000 2500 2M0 A. I. 1500 1000 500 0S 1s 2.5 Tirne 3 x 10⁻³
Figure 2.14: Pressure time history of three-sphere implosion simulation (3.5" spheres)
Left Side Back
- Left Side Front
- Near Field 2
Near Field 4
Rush Mount Back
- ush Mount Font
- Top Back
- Top Front
- Right Side Back
- Right Side Front
THIS PAGE INTENTIONALLY LEFT BLANK
Chapter 3
Experimental Testing
3.1
Objectives
I conducted experimental testing of several different sizes and configurations of single and
multiple metal spheres in order to compare the results of the computational implosion mod-els to actual implosion events, and to gain a better understanding of how to modify the computational models to better simulate spherical implosions. In this section, I will describe how I developed and executed the experimental test plan and then present the results.
3.2
Experimental Test Plan
3.2.1
Design of Test Articles
The results of the shell buckling analysis and fluid simulations detailed in the previous chapter determined the majority of the constraints for the test articles. As stated previously in Section 2.2.2, I chose three sphere sizes such that the sum of the internal volume of three of the smallest spheres had an equivalent internal volume of a single large sphere, and approximately equal to the sum of the internal volume of two of the medium spheres, as
described in Table 2.2. The diameter of the spheres had to be large enough so that the thickness required for the spheres to collapse at the prescribed collapse pressure could be economically manufactured within reasonable tolerances. I designed the spheres to have a thickness such that the predicted buckling pressure would be about 1000 psi according to
the formula developed by Vanzant [5].
I chose 304-series stainless steel as the material for the spherical shells since it is readily available and manufactured in sheets thin enough for this application, and because it is more ductile and less likely to break into multiple pieces like more brittle alloys such as aluminum. Craft Metal Spinning in Chicago, Illinois manufactured the spun hemispherical shells. The Draper Metrology Lab used a FaroArm measuring machine to measure the inner and outer surfaces of the hemispheres, and I compared the measurements gathered to CAD drawings of a perfect hemisphere of the desired diameter and thickness. Deliverables from the data included point-cloud data of the surface measurements from the Faro Arm, the standard deviation of the hemisphere's inner and outer surface compared to the perfect CAD models, and the average out-of-roundness about the circumference of the hemisphere. I also used the point cloud data collected to determine the average thickness and standard deviation from the DYSMAS model. Based on the out-of-roundness data, I matched each hemisphere with another hemisphere with a similar degree of out-of-roundness and geometry around the equator.
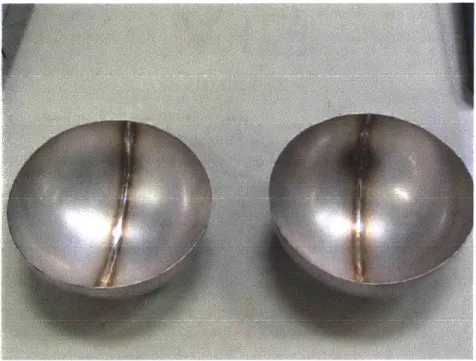
After the articles were measured, the MIT Central Machine Shop welded the hemispheres together. The welders marked each hemisphere along the X-axis for reference. The machine shop also welded one spare sphere together; then the Draper Metrology Lab cut the spare sphere in half and measured the weld zone in order to allow for analysis of imperfections at the weld zone. A detailed view of the hemispherical shells and an interior view of the weld zone is shown in Figure 3.1, while Figure 3.2 shows a detailed view of the weld cross section.
Figure 3. 1: Interior view of weld zone of spherical test article
Figure 3.2: Detailed view of deviation near weld zone
3.2.2
Development of Test Plan
I developed the test plan to include single-sphere tests of each size sphere in order to allow for comparison of the multi-sphere tests to both the single sphere tests of the smaller spheres and to the results of the single large sphere tests. For example, this test plan allowed test results from the implosion of two 4" spheres to be compared to tests of a single 4" sphere implosion, and the results of a single 5" sphere implosion. This aspect of the test plan allowed me to compare the implosion of multiple spheres to single-sphere implosion events of equivalent total volume. The test plan which describes the size and quantity of the spheres
used in each test and the number of tests to be run at each configuration is detailed in Table 3.1.
Test Matrix
Test Test Sphere Total Internal Number Separation
Number Type Diameter Volume (in') of Tests Distance
____ ____ (in) la single 3.5 22.5 3 N/A lb single 4 33.5 3 N/A 1c single 5 65.5 3 N/A 2 multiple 4 67.3 2 2R (4") 3 multiple 3.5 67.0 3 2R (3.5")
Table 3.1: Table of original experimental test plan
3.2.3 Test Facility and Setup
The tests were conducted in the B-Tank at the Penn State Applied Research Lab Deep Ocean Test Facility (DOTF) in Annapolis, Maryland. The properties of the tank are detailed in Figure 3.3.
TANK DESIGNATION A B H GUNSHELLS
enter Tan Horizontal Vertical
Inside diameter o ft 4 ft 30 in t8 in 9 in
Inside length 27 ft 12 ft 6 ft 6 ft 2 ft
Static pressure 12,000 7,000 10,000 20,000
(maximu Salt or Fresh Salt or Fresh Fresh Water Fresh Water Salt or Fresh
Water Water Water
Bet i/]R 1,500,000 None Temp. Control Temp. Control
Figure 3.3: DOTF Tank Characteristics
The A and B tanks at DOTF are horizontal tanks, meaning they must be drained com-pletely before and after each test. The items that are to be tested are loaded onto a horizontal
sled that slides into and out of the tank. Once the items to be tested are secured onto the loading sled, the tank operator seals, fills, and pressurizes the tank. This experimental test plan required a test apparatus that would fit within the pressure tank, be secured onto the loading sled, and could accommodate single-sphere implosion tests as well as two- and three-sphere implosion tests. I constructed the test apparatus out of 1" and 1/2" diameter PVC pipe. I chose to construct the test apparatus out of PVC due to its density and low level of interference with pressure waves. The test apparatus included holes that allowed the structure to flood when the pressure tank was filled and therefore caused the structure to be neutrally buoyant. I secured the test apparatus to the tank loading plate using nylon webbing, as shown in Figure 3.4.