HAL Id: hal-00738310
https://hal.archives-ouvertes.fr/hal-00738310
Submitted on 15 Dec 2015
HAL is a multi-disciplinary open access
archive for the deposit and dissemination of
sci-entific research documents, whether they are
pub-lished or not. The documents may come from
teaching and research institutions in France or
abroad, or from public or private research centers.
L’archive ouverte pluridisciplinaire HAL, est
destinée au dépôt et à la diffusion de documents
scientifiques de niveau recherche, publiés ou non,
émanant des établissements d’enseignement et de
recherche français ou étrangers, des laboratoires
publics ou privés.
southern mid-latitude station during the Antarctic
spring 2009: a multi-instrument study
E. A. Wolfram, J. Salvador, F. Orte, R. d’Elia, Sophie Godin-Beekmann,
Jayanarayanan Kuttippurath, Andrea Pazmino, Florence Goutail, C. Casiccia,
F. Zamorano, et al.
To cite this version:
E. A. Wolfram, J. Salvador, F. Orte, R. d’Elia, Sophie Godin-Beekmann, et al.. The unusual
per-sistence of an ozone hole over a southern mid-latitude station during the Antarctic spring 2009: a
multi-instrument study. Annales Geophysicae, European Geosciences Union, 2012, 30 (10),
pp.1435-1449. �10.5194/angeo-30-1435-2012�. �hal-00738310�
www.ann-geophys.net/30/1435/2012/ doi:10.5194/angeo-30-1435-2012
© Author(s) 2012. CC Attribution 3.0 License.
Annales
Geophysicae
The unusual persistence of an ozone hole over a southern
mid-latitude station during the Antarctic spring 2009: a
multi-instrument study
E. A. Wolfram1, J. Salvador1, F. Orte1, R. D’Elia1, S. Godin-Beekmann2, J. Kuttippurath2, A. Pazmi ˜no2, F. Goutail2, C. Casiccia3, F. Zamorano3, N. Paes Leme4, and E. J. Quel1
1Centro de Investigaciones en L´aseres y Aplicaciones, CEILAP-UNIDEF (MINDEF-CONICET), UMI-IFAECI-CNRS-3351, UMI3351, Villa Martelli, Argentina
2Laboratoire Atmosph`ere, Milieux, Observations Spatiales (LATMOS), Institut Pierre Simon Laplace, Universit´e Pierre et Marie Curie, Universit´e Versailles St-Quentin-en-Yvelines, Centre National de la Recherche Scientifique, Paris, France 3Laboratorio de Ciencias Atmosf´ericas, Universidad de Magallanes, PuntaArenas, Chile
4Instituto Nacional de Pesquisas Espaciais, Brazil
Correspondence to: E. A. Wolfram (ewolfram@gmail.com)
Received: 6 February 2012 – Revised: 22 July 2012 – Accepted: 31 August 2012 – Published: 2 October 2012
Abstract. Record-low ozone column densities (with a
min-imum of 212 DU) persisted over three weeks at the R´ıo Gallegos NDACC (Network for the Detection of Atmo-spheric Composition Change) station (51.5◦S, 69.3◦W) in November 2009. Total ozone remained two standard devi-ations below the climatological mean for five consecutive days during this period. The statistical analysis of 30 years of satellite data from the Multi Sensor Reanalysis (MSR) database for R´ıo Gallegos revealed that such a long-lasting low-ozone episode is a rare occurrence. The event is ex-amined using height-resolved ozone lidar measurements at R´ıo Gallegos, and observations from satellite and ground-based instruments. The computed relative difference between the measured total ozone and the climatological monthly mean shows reductions varying between 10 and 30 % with an average decrease of 25 %. The mean absolute differ-ence of total ozone column with respect to climatological monthly mean ozone column is around 75 DU. Extreme val-ues of the UV index (UVI) were measured at the ground for this period, with the daily maximum UVI of around 13 on 15 and 28 November. The high-resolution MIMOSA-CHIM (Mod´elisation Isentrope du transport M´eso-´echelle de l’Ozone Stratosph´erique par Advection) model was used to interpret the ozone depletion event. An ozone decrease of about 2 ppmv was observed in mid-November at the 550 K isentropic level (∼22 km). The position of R´ıo Gallegos
rel-ative to the polar vortex was classified using equivalent lat-itude maps. During the second week of November, the vor-tex was over the station at all isentropic levels, but after 20 November and until the end of the month, only the 10 lower levels in the stratosphere were affected by vortex overpasses with ozone poor air masses. A rapid recovery of the ozone column density was observed later, due to an ozone rich fila-ment moving over R´ıo Gallegos between 18 and 24 km in the first two weeks of December 2009.
Keywords. Atmospheric composition and structure (Middle
atmosphere – composition and chemistry)
1 Introduction
The Antarctic ozone hole is one of the most important per-turbations that human activities have provoked in our atmo-sphere (WMO Report, 2007). The ozone hole started to de-velop each spring in the southern polar region in the early 1980s. Most recent studies point out that the detection of a statistically significant decrease in its area will not occur be-fore about 2020 (Newman et al., 2006).
In the course of the past twenty years, this phenomenon has varied in size and minimum total ozone value. During spring, stratospheric dynamical processes cause changes in the size and shape of the polar vortex and sometimes it
elongates towards lower latitudes. The daily movement of the vortex combined with this particular shape induces over-passes of the ozone hole over the continental part of South America. In these situations large inhabitant cities like Punta Arenas (119 496 inhabitants), R´ıo Gallegos (79 144 inhabi-tants), and Ushuaia (56 825 inhabitants) are under the influ-ence of the ozone hole or near its border, causing an increase of solar UV radiation at these locations (Pazmi˜no et al., 2005; Wolfram et al., 2008).
Recent studies have shown that while the first stage in ozone recovery (ozone stabilization at global scale) has been reached in the first decade of the 21st century (Newman et al., 2004; Yang et al., 2005), the second stage of recovery (sta-tistically significant upward trend after removal of all other known influences such as solar cycle and volcanic aerosols) will not be detected until about 2020, due to the slow de-crease in the concentration of ozone depletion substances (ODS) in the polar stratosphere (Newman et al., 2006). How-ever, there is a great deal of uncertainty linked to climate change and its impact on the ozone hole, depending on the evolution of the stability of the Antarctic polar vortex. De-spite the fact climate change is expected to accelerate the ozone recovery and the disappearance of the ozone hole (WMO, 2011), most climate models predict an increase in the dynamical activity in the Southern Hemisphere due to the increase in the “forcing” of planetary waves generated in the troposphere (Austin et al., 2010), which will affect the sta-bility of the Antarctic polar vortex and lead to excursions of poor ozone air masses over populated regions of the South-ern Hemisphere and more specifically the southSouth-ern part of South America during the springtime (Eyring et al., 2010). The study of the effect of such excursions on surface UV ra-diation in present conditions is thus of interest in this context. The analysis of historical ground-based total ozone ob-servations in October show that the depletion started in the late 1970s in the Antarctic region, reached a maximum in the early 1990s, and stabilised afterwards due to saturation (WMO, 2007, and references therein). There is no indica-tion of ozone recovery yet (second stage). At southern mid-latitudes, a focus region in this paper, a reduction of 20–50 % is observed for a few days in October–November at R´ıo Gal-legos site (Kuttippurath et al., 2010b).
Using measurements from ground stations and from satel-lites instruments, a recent study found that the ozone hole was centered just off the southern tip of Argentina and Chile for three weeks in November 2009, in contrast with its usual climatogical position centered over Antarctica. Analysis of 30 years of assimilated total O3column and UV index mea-surements shows that this 20-day event was unique in the history of the ozone hole for these latitudes (de Laat et al., 2010).
The objective of this paper is to make a multi-instrument study of this unique event by the use of different ground-based instruments operating at the CEILAP R´ıo Gallegos site (hereafter CEILAP-RG), focusing on ozone profiles
mea-sured by the NDACC (Network for the Detection of Atmo-spheric Composition Change) ozone differential absorption lidar (DIAL). The impact of the ozone hole passing over R´ıo Gallegos during this extreme event is quantified by the comparison of lidar ozone profiles measured during Novem-ber 2009 in the CEILAP-RG site and climatological ozone profiles. Complementary measurements of total ozone col-umn by different ground- and satellite-based instruments and solar UV index are also reported in this paper for a better analysis of this unique event. The high-resolution chemistry-transport MIMOSA-CHIM model is used to quantify the ozone depletion.
This paper is organized as follows: First, the CEILAP-RG site instrument capabilities are presented followed by a de-scription of the method used in this paper to detect vortex occurrence over R´ıo Gallegos at four isentropic levels. In Sect. 4, the total ozone and ozone profiles temporal evolution at R´ıo Gallegos are shown and compared with climatological ozone profile and model calculation. Complementary mea-surements of surface UV irradiances are included in order to evaluate the impact of this event on UV radiation reach-ing the ground. Finally, a discussion of this extreme event is given.
2 CEILAP-RG site description: instrument capabilities
The CEILAP-RG site is part of the Lidar Division of CEILAP in South Patagonia. Since June 2005, a shelter with several lidar instruments developed in collaboration with LATMOS (CNRS) was deployed in this Patagonian city, 2600 km from Buenos Aires. During 2005 and 2007, with the financial support of JICA (Japan International Co-operation Agency), the SOLAR Campaign was held (www. division-lidar.com.ar) (Wolfram et al., 2006). The principal objective of this campaign was to study the ozone layer when the polar vortex overpassed the continental part of Argentina, in South America.
After the SOLAR campaign, different projects were devel-oped with financial support of JICA in partnership with re-searchers from France, Japan and Chile. The main objectives of these projects are the measurement of various atmospheric parameters and stratospheric ozone profiles using lidar re-mote sensing techniques. R´ıo Gallegos is located at southern subpolar latitudes, making it a very interesting place to ob-serve the perturbations that the ozone hole induces on mid-latitude ozone vertical distribution. The only ground-based lidar experiments carried on in southern Latin America to ob-serve the ozone profile are made in the CEILAP-RG station. The activity of this site permits monitoring of the evolution of ozone vertical distribution in the 12–45 km altitude range during the year. Beyond satellite profiles, ozone sondes are launched in Punta Arenas (Chile) and Ushuaia (Argentina).
In addition to lidar measurements, other available instru-ments at the CEILAP-RG site are used for a thorough study
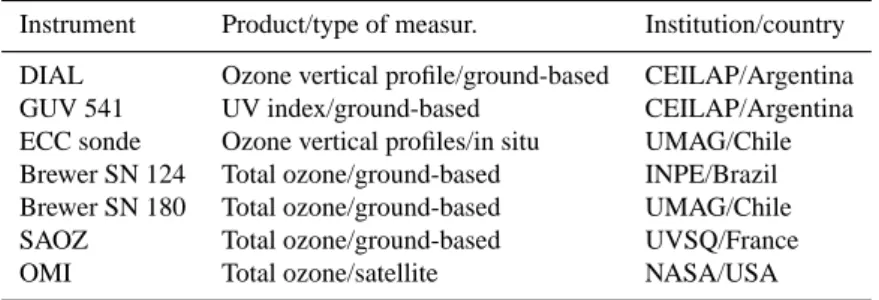
Table 1. List of instruments considered in this study.
Instrument Product/type of measur. Institution/country DIAL Ozone vertical profile/ground-based CEILAP/Argentina GUV 541 UV index/ground-based CEILAP/Argentina ECC sonde Ozone vertical profiles/in situ UMAG/Chile Brewer SN 124 Total ozone/ground-based INPE/Brazil Brewer SN 180 Total ozone/ground-based UMAG/Chile SAOZ Total ozone/ground-based UVSQ/France OMI Total ozone/satellite NASA/USA
of the unusual event investigated in this paper. Table 1 shows the list of observations used to diagnose the atmospheric phe-nomenon.
2.1 Differential Absorption Lidar (DIAL)
The instrument developed at the CEILAP laboratory is an im-proved version of the previous one (Pazmi˜no, et al., 2001). The new setup was developed in collaboration with LAT-MOS, and the optical receiving system is similar to that developed for other lidar systems, such as the instrument at Observatoire de Haute-Provence, France (OHP) (Godin-Beekmann et al., 2003). The DIAL technique requires two emitted wavelengths that in this instrument are generated by two emitter lasers: an excimer (XeCl) laser emitting at 308 nm with 30 Hz repetition rate, and maximum energy per pulse of 300 mJ is used for the wavelength absorbed by ozone. The reference wavelength corresponds to the third harmonic of a Nd-YAG laser emission, at 355 nm, 30 Hz rep-etition rate and 130 mJ maximum energy.
The optical receiver of the DIAL instrument that collects the backscattered photons is made up of four Newtonian (f/2) telescopes. Each of them has a 50 cm diameter with parabolic aluminized surfaces of 48 cm diameter. This produces a total reception area of ∼7238 cm2. At the focus of each telescope, an optical fiber of 0.94 mm effective diameter, 0.22±0.02 nu-merical aperture, and 0.27 db km−1attenuation (at 308 nm) is placed. The other end of the fiber is positioned at the focus of a quartz lens placed inside a spectrometer used for the sepa-ration of the received wavelengths. A mechanical chopper is positioned at the entrance of the spectrometer. It has a rotat-ing frequency of 300 Hz (18 000 rpm), and its role is to block the strong lidar signals originated from the lower part of the atmosphere. The full description of the DIAL instrument and the intercomparison with independent ozone measurements can be found in Wolfram et al. (2008).
The ozone number density is computed from the differ-ence of the slopes of the signals originated from Rayleigh scattering of the emitted laser beams. Since lidar signal cov-ers a very large dynamical range, they have to be attenuated for the measurements in the lower stratosphere. The final ozone profile measurement corresponds thus to a composite
profile computed from the “low” and “high” energy Rayleigh signals which are detected simultaneously.
A typical experiment lasts 3–4 h, leading to a horizon-tal spatial resolution of 100–200 km. The vertical resolution ranges from 0.7 km at 14 km to 4 km at 35 km, with a cor-responding total uncertainty varying from 3 to 15 % in the same altitude range. This instrument contributes to NDACC and is one of only five instruments of this type in the Southern Hemisphere. The standard number of experiments per year is around 40 with a seasonal distribution that has a maximum rate during austral spring, coincident with the development of the ozone hole.
2.2 Ground-based passive sensors
2.2.1 System d’Analyse par Observation: SAOZ
The zenith sky SAOZ UV-VIS spectrometer (Pommereau and Goutail, 1988) belonging to LATMOS operates at 300– 650 nm, looking at sunlight scattered from the zenith sky dur-ing twilight. Ozone is measured at high solar zenith angles (SZA) between 86◦ and 91◦ every morning and evening in the Chappuis band (450–650 nm). Various inter-comparison exercises concluded that the measurements from different SAOZ instruments are consistent within ±3 % (Roscoe et al., 1999; Vaughan et al., 1997). The SAOZ spectrometer at CEILAP-RG site was installed in March 2008, and it mea-sures ozone and nitrous dioxide columns twice a day, at sun-rise and sunset. This instrument is also part of NDACC net-work. The SAOZ data used in this paper are the consolidated data Version 2 (V2) (Hendrick et al., 2011).
2.2.2 GUV radiometer
Real-time UV and ozone data are derived from measure-ments of multi-channel moderate-bandwidth GUV filter ra-diometers, designed and manufactured by Biospherical In-struments Inc. The inIn-struments provide measurements in five approximately 10-nm-wide UV bands centered at 305, 313, 320, 340, and 380 nm. The angular response of the radiome-ter’s collector has virtually no azimuth dependence, and its cosine error is smaller than ±3 % (±7.5 %) for zenith angles less than 65◦(82◦). The instrument and its data have been
described in several publications (Dahlback, 1996; Booth et al., 1994; Fuenzalida et al., 1998). This instrument in-tegrates the Solar Monitoring Network Argentina (Orce et al., 1998), and since June 2005 it was installed at CEILAP-RG. The multi-channel moderate-bandwidth GUV-541 has proven to be an acceptable solution for this type of monitor-ing. It is a good alternative to UV spectroradiometers, which are very expensive and maintenance intensive, and broad-band radiometers that provide limited information because they cannot distinguish between changes in UV radiation caused by variation in cloud cover and changes caused by variation in ozone amount.
2.2.3 Brewer spectrophotometer
Brewer spectraphotometers are ones of more sophisticated instruments to take measurements of total ozone column in an automatic way. Its measurements also make use of dif-ferential absorption in the UV region (Brewer, 1973) for the determination of total ozone, similar to that of the Dobson, but sensitivity of the Brewer instrument is better. An empir-ical relation between simultaneous direct sun and zenith sky has to be established if zenith observations are to be taken. Calibration of the instrument is essential. The Brewer in-stalled in CEILAP-RG site is a Mark IV single monocroma-tor (SN 124), and it was installed in November 2008. It be-longs to INPE/Brazil. A second Brewer instrument was taken into consideration in this study from Laboratorio de Ozono y RUV of Magallanes University, Punta Arenas, Chile. It is a Mark III double monocromator (SN 180).
2.3 Satellite measurement
The satellite measurements considered in this work are the total ozone column from Ozone Measurement Instrument (OMI) and the Multi Sensor Reanalysis (MSR) data. The OMI sensor on the Aura satellite is a successor to the To-tal Ozone Mapping Spectrometer (TOMS), and it began to operate in 2004 (Levelt et al., 2006). The measurements of this instrument are made by an UV-VIS spectrometer in nadir view. It measures solar light scattered photons by the atmo-sphere with a spatial resolution at nadir of 13 × 24 km. The overpass data, spatial averages within 100 km, are retrieved using the TOMS v8 algorithm. The uncertainty of the ozone column is 2–5 % for SZA < 84.
In addition, we use daily total O3 columns obtained from the Multi Sensor Reanalysis (MSR) project, which produced a 30-year total O3 column assimilation dataset for 1979–2008. These data are based on a total of eleven satellite instruments measuring total O3 columns – includ-ing SCIAMACHY – that were operatinclud-ing durinclud-ing various periods within these 30 years (van der A et al., 2010). The daily and monthly climatological values of total ozone and UV index for R´ıo Gallegos were calculated with the online sources dataset summarized as daily MSR total
ozone columns at 12:00 UTC, http://www.temis.nl/protocols/ o3field/o3field msr.php; daily MSR maximum UVI data, http://www.temis.nl/uvradiation/MSR/uvief.php. The period 1979–2008 was chosen for the climatology. From 1989 on-wards the large O3 holes occurred, and O3 depletion was more or less constant (WMO, 2007).
2.4 Ozone sonde measurement
The Laboratory of Monitoring of Ozone and UVR (LabO3RUV) of the University of Magallanes (UMAG) at Punta Arenas, Chile (53◦S, 70.9◦W) have been perform-ing regular ozone soundperform-ings from September 2009. Sound-ings have been carried out twice a month and daily during the activity of the Antarctic Ozone Hole over Punta Are-nas. A Lockheed Martin LMG6 ground system unit, LMS6 meteorological radiosonde and electrochemical concentra-tion cell (ECC) ozonesondes from EN-SCI Corporaconcentra-tion have been used. A 1 % solution of KI was used. The ozone sensor of the ECC ozonesonde is an iodine/iodide redox concen-tration cell composed of two platinum electrodes immersed in neutral buffered iodide solutions of different concentra-tion in the anode and cathode chambers. An electric current is generated when air containing ozone is pumped into the cathode. Both ECC and LMS6 are carried aloft on balloons from the ground to the burst altitude of the ballon, normally near 28–30 km. Between LabO3RUV-UMAG and CEILAP an agreement exists to compare ozone profiles obtained with DIAL and ECC in the Patagonia under the UVO3Patagonia (Argentina–Chile) project carried on between 2007–2011.
3 Classification method: equivalent latitude
The position of R´ıo Gallegos with respect to the vortex is evaluated in the 2-D quasi-conservative coordinate sys-tem (equivalent latitude/potential sys-temperature) described by McIntyre and Palmer (1984). This methodology was previ-ously used for the evaluation of ozone loss rates in spring at the Antarctic station of Dumont d’Urville (Godin et al., 2001) and in the studies of impact of polar vortex on ozone and ultraviolet B radiation in south Argentina (Pazmi˜no et al., 2005). In our study, this methodology permits us to find the occurrence of polar ozone depleted air masses over the measurement site. The meteorological data from the Euro-pean Center for Median Range Weather Forecasts (ECMWF) analyses (2.5◦×2.5◦) are used to compute the equivalent
lat-itude (EL) and potential temperature. The EL is a modified potential vorticity (PV) variable defined as the latitude en-closing the same area as the corresponding PV contour. In this new coordinate system, the pole corresponds to the po-sition of maximum PV. Following the evolution of PV as a function of EL, three regions can be distinguished: inside the vortex, characterized by high PV values; the vortex edge, corresponding to the high PV gradient area; and outside the
vortex, with small PV values. The vortex edge is very weakly mixed due to high PV gradient. In contrast, the PV gradient is low inside the vortex (i.e. vortex core) and outside the vor-tex, and therefore they are strongly mixed regions (Lee et al., 2001).
The position of the vortex limit and its boundaries are cal-culated every day from the middle of September to Decem-ber covering the study period in 2009, using the method of Nash et al. (1996). In this methodology the vortex limit cor-responds to the EL where the gradient of PV weighted by the wind module is maximum. The local extreme of the sec-ond derivative correspsec-onds to the inner and outer boundaries. Finally, to smooth the variability that is produced by the cal-culation, the limit and borders of the vortex are smoothed temporally with a moving average of five days.
The polar vortex starts to develop at the beginning of the winter in the upper stratosphere, and it usually persists un-til late November to late December depending on the alti-tude. The vortex makes a dynamical barrier that results in a strong temperature gradient between polar and mid-latitudes regions. It grows in size and develops downward. With the return of sunlight, the vortex is deformed by the increasing planetary wave activity, which produces changes in the shape and position of it. It starts to break earlier in the upper strato-sphere until the final stratospheric warming. These deforma-tions are important to take into account because they occur in late November and early December when the solar eleva-tion is large. The combinaeleva-tion of polar air masses with low ozone concentration and high solar elevations may result in high UV levels.
The ozone loss by the passive method is computed by subtracting passive ozone (ozone calculated without inter-active chemistry) from lidar ozone measured (Kuttippurath et al., 2010a). This approach separates the contribution due to transport and photochemical loss in total ozone evolu-tion during the winter. The tracer calculaevolu-tions are performed by chemical transport models (CTMs) in which photochem-istry is deactivated to represent the dynamical evolution of the ozone during the winter. The Mod`ele Isentrope du
trans-port M´eso`echelle de l’Ozone Stratosph´erique par Advection
(MIMOSA) was used to capture and quantify the filamen-tary structures passing over Europe in winter and spring to assess the importance of such structures in the irreversible transport of polar air into mid-latitudes. It was originally developed at LATMOS and a full description of MIMOSA is given by Hauchecorne et al. (2002). The potential vor-ticity (PV) is advected isentropically with a 1-h elemen-tary time step and re-interpolated onto a regular longitude– latitude fine grid. Sensitivity studies of this CTM model have shown that uncertainties in advection lead to fine structure position errors not exceeding 200 km (Hauchecorne et al., 2002). The MIMOSA-CHIM is the chemistry extended ver-sion of the model, and combines the PV advection scheme and the chemistry scheme of the model REPROBUS
(Reac-Fig. 1. 2009 daily evolution of total ozone column at R´ıo Gallegos
measured with Brewer 124 spectrophotometer (blue open circles), SAOZ spectrometer (black open diamonds), and OMI satellite mea-surements (red line). The SAOZ data corresponds to mean sunrise and sunset values. Total ozone column at Punta Arenas measured with Brewer SN 180 is shown as a dashed black line. Data span from the middle of September to the end of December. Climato-logical MSR monthly mean total ozone column for R´ıo Gallegos site (1978–2008) (black solid line) ±1 SD (dashed gray lines) and
±2 SD (dotted gray line) are also shown.
tive Processes Ruling the Ozone Budget in the Stratosphere) (Lef`evre et al., 1994; Tripathi et al., 2006).
4 Results
4.1 Total ozone measurements
In this section we analyze the time evolution of total ozone column for the 2009 spring season, paying special atten-tion to November. Since the discovery of the ozone hole in Antarctica, the southern parts of South America have usu-ally been affected by frequent overpasses of the polar vortex. The vortex stretches and becomes more elliptic frequently while it rotates over the Antarctic continent with an aver-age period of about 20 days. Figure 1 shows the daily evo-lution of the total ozone column for R´ıo Gallegos site mea-sured by satellite and ground-based instruments described in Sect. 2. The climatological mean from the MSR time series is also represented in this figure together with the 1st and 2nd standard deviations (SDs). The time period reported in this figure spans from September to December 2009. Note that at the end of September and beginning of October (day of year: 263–283), the edge of the Antarctic vortex passed over the R´ıo Gallegos region twice, which resulted in small O3
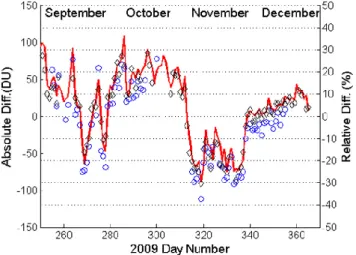
Fig. 2. Differences (absolutes and relatives) of 2009 daily total
ozone column with respect to climatological total ozone column for R´ıo Gallegos. Differences with respect to Brewer MkIV spectrom-eter (blue circles) and SAOZ spectromspectrom-eter (black open diamonds), and OMI satellite measurements (red line) with respect to climato-logical monthly mean. The SAOZ data corresponds to mean sun-rise and sunset values. Data span from the middle of September to the end of December. Absolute differences are calculated as instru-ments (inst) less climatology (clim) (left axis), and relative differ-ences are calculated as (inst−clim)/clim × 100 (right axis).
columns and enhanced UVI values. The total ozone columns corresponding to these days are around 250 DU, but these events are inside the two standard deviations (SDs) of the climatological mean and will not be considered in this study. We focused on November (day number 305 to 334), when remarkably low total ozone columns were registered by the different instruments involved in this study. This extreme event was beyond two standard deviation of the 30-year November climatological mean. The large decrease in ozone columns (and corresponding high UVI shown in Sect. 5) around 15 November 2009 are easily identified. The mean absolute difference of total ozone column with respect to climatological monthly mean ozone column is 62.2 DU for this 20-day period and 32.9 DU for the complete month of November (Fig. 2, left vertical axes). The minimum ozone column of this extreme event occurred on 15 November (day number 319) with 212 DU measured by Brewer (SN 124), 226 DU measured by SAOZ and 234 DU observed by OMI. The relative differences between instrument measurements (inst) and climatological monthly mean (clim) total ozone were calculated as 100 × (inst−clim)/clim. The relative dif-ferences range around −10 to −30 %, with a mean reduction of 25 % (Fig. 2, right vertical axes). The total ozone column satellite map on November 15 showed the ozone hole elon-gated elliptically over the southern part of South America, covering the position of the R´ıo Gallegos site.
These low total ozone column values are not unusual for this latitude, as revealed by the MSR data, but the unusual
Table 2. Statistical analysis of MSR database overpasses at R´ıo
Gal-legos.
Occurrence number of Frequency of consecutive days occurrence (%)
1 59.5
2 26.9
3 10.2
4 or more 3.3
situation is the prolonged persistence of low total ozone columns over this site due to the vortex overpasses during 20 consecutive days in November. De Laat et al. (2010) showed from the analysis for MSR that a 20-day period with total ozone columns outside the 95 % confidence interval and UVI values larger than 10 for up to 18 days never occurred for the period 1979–2008 at any longitude for the latitudes dur-ing the latter two decades between 52◦S and 56◦S during November.
To show how unusual this event was at R´ıo Gallegos, we made a statistical analysis of 30-year MSR data for the CEILAP-RG site. In this study we considered that one day with total ozone column below two standard deviations (SDs) of the daily climatological mean as a day with statistical ozone depletion. The second criterion for the statistical anal-ysis was to compute the number of statistical ozone depletion events occurring in a consecutive way. The analysis reveals that days with total ozone column below 2 SDs of the cli-matological daily mean are distributed as follows: Around 60 % of cases correspond to events of only one day, with the day after the event showing a quick increase in the total ozone column out of the threshold of 2 SDs below the clima-tological mean. In second place of occurrence there are the events with two consecutive days of lower ozone with 27 % of occurrences. 10 % of events correspond to three consecu-tive days below 2 SDs of the climatological mean, and only 3 % of the cases of total ozone column below 2 SDs of clima-tological daily mean correspond to four or more consecutive days (Table 2). The analysis of these extreme cases shows that this small percentage corresponds to the years 1994, 2002 and 2009. In 1994, an event of 5 consecutive days of extreme ozone depletion (beyond 2 SD) occurred in Octo-ber and not in NovemOcto-ber as the case in study here, while in 2002, the sudden stratospheric warming split the vortex in two parts (Feng et al., 2005; Roscoe et al., 2005) and ozone poor filaments moved into the mid-latitudes and produced six days with low ozone over R´ıo Gallegos. The event of Novem-ber 2009 studied in this paper was unique in the history of the ozone hole in the mid-latitudes as the total ozone was below 2 Sds of the climatological mean during 5 consecutive days in November, as analyzed from the 30-year data at R´ıo Gal-legos.
Table 3. Lidar measurements considered in this study.
Measurement Date Day Start time Stop time Integration time number dd/mm/yyyy number (UTC) (UTC) (Hs)
1 01/11/2009 305 0:50 03:50 03:00 2 05/11/2009 309 02:15 04:45 02:30 3 09/11/2009 313 02:05 04:52 02:47 4 13/11/2009 317 05:05 08:00 02:55 5 14/11/2009 318 02:00 07:08 05:08 6 23/11/2009 327 01:15 06:23 05:08 7 24/11/2009 328 02:45 06:57 04:12 8 08/12/2009 342 03:35 06:48 03:13 9 13/12/2009 347 02:34 07:06 04:32
4.2 Lidar ozone profiles
Height-resolved ozone measurements over R´ıo Gallegos were measured with a differential absorption lidar (DIAL) instrument. A total of nine lidar profiles were selected for this study, in which seven of them were observed in Novem-ber. Table 3 summarizes the details of each experiment con-sidered in the present work. Commonly, the lidar measure-ments carried out in November 2009 have a duration that ranges from 3–5 h. Longer experiments are not possible at the CEILAP-RG site due to cloud cover and night duration. The cloud cover is very high in Patagonia region and has a seasonal cycle that maximizes in summer. This situation to-gether with the length of nights makes it difficult to perform lidar measurements in CEILAP-RG at this time of the year.
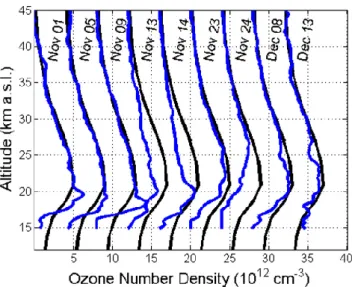
The ozone number densities as a function of altitude for selected days are shown in Fig. 3. The dynamic range cov-ered for the measurements is 14.5 to 45 km. To quantify the reduction and change in the shape of the ozone vertical pro-file, the November ozone climatology profile (Fortuin and Kelder, 1998) is included in Fig. 3 for the latitude band 45◦– 55◦S. The climatology in mixing ratios was made from sev-eral satellite and ozonesonde observations during the 1980– 1991 period and is available for 17 latitudinal bands from
−80 to 80 degrees spacing at 17 pressure levels between 100 and 1 hPa. These climatological profiles are converted to number density profiles using the CIRA temperature data for the respective latitude and altitude levels (COSPAR, 2006).
We observe three different deviations from the climato-logical profile: The first three profiles (1, 5 and 9 November) show an increase in the ozone number density below 20 km height; the second two lidar profiles (13 and 14 November) show the loss in ozone at all altitudes, the measurement on 13 November in particular. By the end of the month, the re-duction is visible below 26 km. The two lidar profiles of De-cember have been included to show the recovery to near nor-mal ozone profiles after the pass of this extreme event. How-ever, the lidar profiles in December show a small perturbation around 25 km, due to the vortex dilution process.
Fig. 3. Lidar ozone profiles measured in R´ıo Gallegos sites (blue
lines) from 1 November to 13 December 2009. The details of li-dar experiments are listed in Table 2. For comparison of vertical ozone profile shape change, the November climatological Fortuin and Kelder ozone profile is included (black lines). The profiles have been offset successively by 4 × 1012cm−3.
With the aim to show the variability of ozone concentra-tion over R´ıo Gallegos in this time period, we made a time-height 2-D cross section of ozone number density profiles (Fig. 4, left side). To show the impact of polar vortex over-pass in R´ıo Gallegos during this extreme event, we calcu-late the anomaly profile defined as subtraction of each single profile from the November climatological mean (Fig. 4, right panel). We can observe the impact of ozone hole overpass on 13 and 14 November profiles, where the reduction in ozone is observed at the full range covered by the lidar measure-ment. The absolute differences shows a maximum of about 3 × 10¹²molecules cm−3 around 25 km. It should be men-tioned that some of the patterns seen in Fig. 4 can be caused by the software used to perform these graphics and its inter-polation scheme.
Fig. 4. 2-D time–altitude cross section of lidar ozone number density for the CEILAP-RG site (left panel). 2-D time–altitude cross section
of number density anomaly (lidar–climatological profile) (right panel). Vertical red bars indicate the lidar measurements.
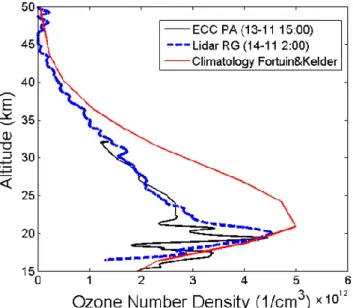
Fig. 5. Intercomparison of lidar ozone profile on 14 November 2009
(start time 02:00 UTC) measured at R´ıo Gallegos (blue dashed line) and ECC ozonesonde launched on 13 November (15:00 UTC) in Punta Arenas, Chile (black line). Fortuin and Kelder climatological profile for 45◦–55◦latitude south band is also plotted as a reference (red line).
In this paper, we include the ECC ozonesonde profile launched in Punta Arenas on 13 November (15:00 UTC) as additional information. Figure 5 shows the ECC profile taken on 13 November and lidar profile measured the night after that (14 November, 02:00 UTC). Both profiles show strong reduction with respect the Fortuin and Kelder climatology, mainly above 20 km. In general, the agreement between both types of measurements is good, showing the influence of po-lar vortex intrusion over southern South America, but the ver-tical resolution of lidar did not permit catching the laminate
shape of the ozone profile linked to the presence of the polar vortex.
4.3 Solar UV radiation measurement
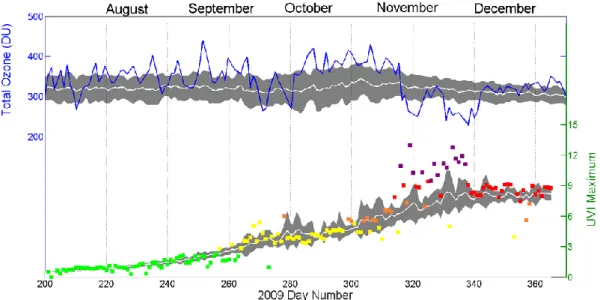
As it is well known, there is an anticorrelation between to-tal ozone content and solar UV crossing the atmosphere (Booth and Madronich, 1994). In addition to ozone, aerosols, cloud cover and solar position affect the solar UV levels that reach ground. In R´ıo Gallegos, the aerosol load is very low and does not affect the UV radiation. In the period studied here, the passage of ozone poor airmasses over R´ıo Gallegos caused elevated values of solar UV radiation at the ground. Figure 6 shows the total ozone column (upper panel) together with the maximum daily value of UV index (UVI) (lower panel). The plots span from August to the end of Decem-ber 2009 and clearly show the anticorrelation between ozone and UV during November extreme events. The climatolog-ical daily means of the UV index reported here were calcu-lated with the GUV database records from 2005 to 2008. The shaded area corresponds to ±1 SD of the daily mean.
The increasing trend in the daily mean UV level with time is due to increase in solar elevations. In addition, the daily maximum UVI is modulated by total ozone content and cloud cover. The maximum UVI (UVI = 13) was reached on 15 November 2009, but in the whole 20-day period studied here, high values of UV index were registered. Daily maxi-mum UVIs reported in Fig. 6 are classified in different colors according to the color code suggested by the World Health Organization (WHO, 2002) for the dissemination of the UVI to the public. Low UVI are plotted in green, moderate in yel-low, high in orange, very high in red and extreme UVI in violet. We note that maximum UVI for the 20-day period of November covered in this study reached extreme values.
The time evolution of UVI for selected days in November is presented in Fig. 7. The measurements were performed
Fig. 6. Temporal evolution of daily maximum UV index (UVI) at ground surface for CEILAP-RG site (colored squares, lower panel, right
axis). White line is the climatological daily mean of UVI (see text for explanation) and shadow area corresponds to ±1 SD. Temporal evolution of total ozone for R´ıo Gallegos site (blue line, upper panel) with the climatological daily mean of total ozone (white line, upper panel). Shadow area corresponds to ±1 SD.
Fig. 7. Time evolution of UV index at R´ıo Gallegos. The measurements were obtained with a GUV 541 for 14 November (a), 15
Novem-ber (b), 23 NovemNovem-ber (c) and 29 NovemNovem-ber (d) and are plotted as blue lines. NovemNovem-ber monthly mean of UVI is shown as a white line and the shadow grey area corresponds to ±1 SD. Modeled UVI for 15 and 29 November are shown as dotted black lines.
Fig. 8. Temporal evolution of equivalent latitude for the vortex limit positions (black line), inner and outer vortex edge (dashed lines), named
as “In Edge” an “Out Edge”, respectively, and the R´ıo Gallegos station (blue circles) at four isentropic levels (475, 550, 650 and 850 K). Red diamonds indicate the lidar measurements considered in this study.
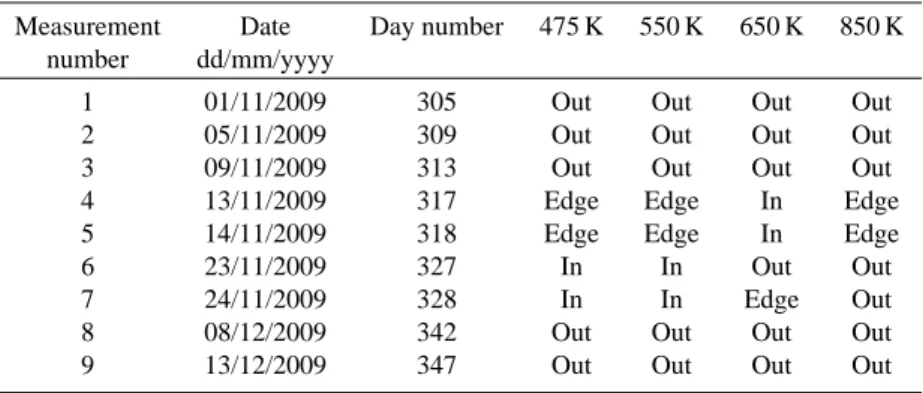
Table 4. Classification of lidar measurements with respect to vortex position at different isentropic levels.
Measurement Date Day number 475 K 550 K 650 K 850 K number dd/mm/yyyy
1 01/11/2009 305 Out Out Out Out 2 05/11/2009 309 Out Out Out Out 3 09/11/2009 313 Out Out Out Out 4 13/11/2009 317 Edge Edge In Edge 5 14/11/2009 318 Edge Edge In Edge 6 23/11/2009 327 In In Out Out 7 24/11/2009 328 In In Edge Out 8 08/12/2009 342 Out Out Out Out 9 13/12/2009 347 Out Out Out Out
with a GUV moderated narrow band radiometer at a rate of one measurement per minute. High impact of cloud cover is observed in the daily evolution of UVI, producing, in general, attenuation of the radiation as on 14 November (Fig. 7a).
On 15 November, total ozone column for R´ıo Galle-gos reaches 225 DU, and the absolute maximum in UVI (UVI = 13) was measured after local noon, contrary to what would be expected for clear skies. The clouds were block-ing the sun light at noon but reinforced the UV radiation
that reached the ground in the first hour of the afternoon. The UV increase in partially cloudy sky is a phenomenon that has been documented by several researchers (Estupi˜n´an et al., 1996; Crawford et al., 1999). Clouds with vertical development are the most effective in increasing UV radi-ation beyond the clear-sky limit. This enhancement occurs when the solar beam is unobstructed and additional radia-tion is scattered by clouds towards the ground. Estupi˜nan et al. (1996) found that these cumulus clouds can produce
localized increases of UV-B radiation of up to 27 % over timescales as long as one hour. Similar situations were found in the measurements analyzed here. Clear sky UV radiation levels were simulated with a TUV model V5.0 (Madronich, 1993) on 15 and 29 November, using as input parameters of the model the ozone total column corresponding to these days and monthly mean aerosol optical thickness from an AERONET sun photometer (AOT(500 nm) = 0.02). To vali-date the consistency of GUV measurements and results of the TUV model, measurements and model were compared for three almost cloud-free days in January and October 2009. The two quantities agreed to within 5–10 %, which is within their combined uncertainty. On 29 November, the ozone col-umn was a little higher compared to 15 November, but the UVI levels were still higher during this day, and also higher than the model UVI for clear sky conditions as a consequence of cloud border enhancement after local noon.
5 Discussion
The circulation of the polar winter stratosphere is dominated by a large cyclonic vortex centered near the winter pole. The changes in the shape or location of this polar vortex are mainly responsible for the change in the stratospheric circu-lation. The time evolution position of R´ıo Gallegos on equiv-alent latitude coordinate (hereafter RG-EqLat) shows that the station was outside the polar vortex at all isentropic levels considered in this study (475, 550, 650 and 850 K) during the first 10 days of November (Fig. 8). This is reflected in the three first lidar measurements analyzed here (1, 4 and 9 November), which indicate ozone concentrations above the climatological mean at low altitudes due to the isentropic transport of ozone rich air-masses from mid-latitude lower stratosphere (Figs. 3 and 4). On the contrary, the RG-EqLat on 13 and 14 November show that R´ıo Gallegos was located at the edge of the polar vortex in the lower stratosphere. In the upper levels of stratosphere (650 K and 850 K isentropic level), the station was inside the polar vortex, especially at 650 K isentropic level (aprox. 24 km) where the RG-EqLat was poleward the vortex position (see Table 4). This con-firms that the polar vortex passed over R´ıo Gallegos during the lidar measurements, and this is the reason for the ob-served ozone loss on 13 and 14 November (day number 317 and 318, respectively). The situation was different on 23 and 24 November (day number 327 and 328), during which the station was inside the vortex at isentropic levels 475 and 550 K and outside the vortex at 675 K. In the upper level (850 K), the station was fully outside during these two con-secutive days. This situation explains the observed shapes of lidar profiles on these days that show reduction with respect to the climatological profile only below 28 km (Fig. 3). On the other hand, the lidar measurements on 8 and 13 Decem-ber are similar to the climatological profiles as the observa-tions were performed outside the vortex. A rapid recovery of
the O3column density was observed later due to an O3rich filament moving over R´ıo Gallegos between 18 and 24 km, while simultaneously the O3 poor air moved away for the first two weeks of December 2009.
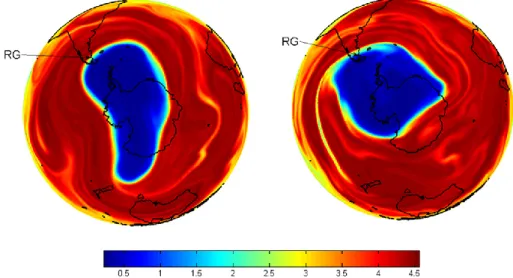
We have used the MIMOSA-CHIM CTM to evaluate the chemical ozone loss corresponding to the measurements per-formed at R´ıo Gallegos. For this purpose, the passive ozone tracer (ozone calculated without interactive chemistry) sim-ulated by MIMOSA-CHIM for lidar measurements for days in November is used. The chemical ozone loss is computed from the difference between the simulated tracer and the ozone mixing ratio evaluated from the lidar measurements. That is, the observed ozone loss in absolute units (ppmv) is estimated as lidar−tracer for each isentropic level. The ozone loss estimated on 13, 14 and 24 November shows high ozone depletion in the 350–675 K range of about −2 ppmv on aver-age (Fig. 9). This loss is due to halogen catalytic destruction cycles, which dominate chemical ozone loss processes within the polar vortex in the lower stratosphere during that pe-riod (Solomon, 1999). The model reproduces quite well the ozone behavior during the period, however the differences between model and lidar measurements do increase above the 650 K level. This may be because the model loses accu-racy at higher levels in the stratosphere, and the effect of the modeled ozone profiles were interpolated to R´ıo Gallegos. Figure 10 shows the model output of ozone concentration at the 500 K isenstropic level on 14 and 24 November 2009. The simulation confirms the fact that R´ıo Gallegos was in-side the polar vortex at this level during these days. The shape of the polar vortex appears more elongated on 14 November than 24 November, but on both days ozone poor air was over the R´ıo Gallegos site.
6 Conclusion
An extremely persistent ozone hole overpass was observed from ground-based instruments at R´ıo Gallegos in Novem-ber 2009. This was the first time that an extreme event of this duration was observed from the ground at a subpolar station with a lidar instrument. Record-low ozone (O3) col-umn densities (with a minimum of 212 DU) persisted over three weeks at the R´ıo Gallegos NDACC station in Novem-ber 2009. The statistical analysis of 30 years of satellite data from the Multi Sensor Reanalysis (MSR) database for R´ıo Gallegos revealed that such a long-lasting, low-ozone episode is a rare occurrence. This statistical analysis reveals that 3 % of events only correspond to 4 or more consecutive days with total ozone column below two standard deviations of the daily climatological mean.
This event was examined using height-resolved O3 lidar measurements over R´ıo Gallegos, and outputs of satellite and different ground-based instruments operational at the site. The computed relative difference between the measured total ozone and the climatological monthly mean shows
(a)
(b)
(c)
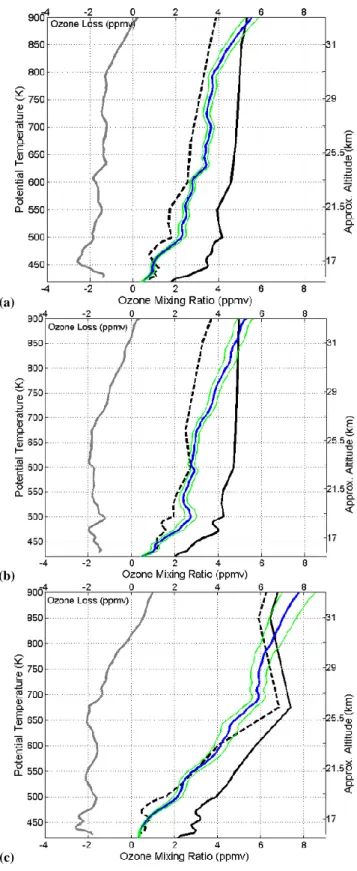
Fig. 9. Volume mixing ratio ozone profile measured by lidar
(solid blue line) ± lidar error (solid green line) and calculated by MIMOSA-CHIM (black dashed line). Passive ozone profile is plotted as a black solid line. Ozone loss is calculated as lidar-passive ozone (gray solid line). (a) corresponds to 13 November,
(b) 14 November, and (c) 23 November.
reductions varying between 10 and 30 % with an average de-crease of 25 %. The mean absolute difference of total ozone column with respect to climatological monthly mean ozone column was 62.2 DU for this 20-day period and 32.9 DU for the complete month of November. These ozone reductions cause higher levels of UV radiation at the ground. Extreme values of UV index were measured for this period of time, with daily maximum UVI of around 13 on 15 and 28 Novem-ber. The cloud cover present on these days produced a strong modulation of UV radiation at the ground, resulting not only in UV reduction but also in enhancement beyond the val-ues calculated for clear-skies with a radiative transfer model. This happens because cloud border reflections strengthen the UV radiation that reaches the radiometer at ground level. This shows how the combination of low ozone events and partially cloudy skies can result in dangerous events for hu-mans, and this reinforces the necessity of having continuous monitoring programs of this type of event for public alert of dangerous UVI.
The position of R´ıo Gallegos relative to the polar vor-tex was classified using a 2-D quasi-conservative coordi-nate system (equivalent latitude/potential temperature). The time evolution of R´ıo Gallegos position in equivalent lati-tude shows that the station was outside the polar vortex at all isentropic level considered in this study (475, 550, 650 and 850 K) during the first 10 days of November. Unlike this situation, the RG-EqLat on 13 and 14 November shows that R´ıo Gallegos was located on the edge of the polar vortex in the lower stratosphere and inside the vortex in the middle stratosphere (650 K and 850 K isentropic levels). The situ-ation that occurred on 23 and 24 November was different. Only the lower stratospheric levels at 475 K and 550 K were inside the polar vortex, while at 650K isentropic level the R´ıo Gallegos station was outside the vortex, near the outer edge. A rapid recovery of the ozone column density was observed later due to an ozone rich filament moving over R´ıo Gallegos between 18 and 24 km, while simultaneously the ozone poor air moved away for the first two weeks of December 2009.
Consistent with the reduction of ozone observed by SAOZ, Brewer and satellite instruments, the ozone loss estimated from the lidar ozone measurements using the MIMOSA-CHIM model CTM during 13, 14 and 23 November also show high depletion of ozone in 350–675 K of about 2 ppmv, on average. This implies that the vortex overpasses at R´ıo Gallegos in November 2009 were a unique event of great importance, as far as the ozone loss in the southern mid-latitudes is concerned.
Beyond the significance and importance that this type of event had, this paper also shows the observational instrumen-tal capabilities that the CEILAP-RG site has. This will be very relevant in the future for atmospheric studies, because the number of highly qualified ground-based stations with great diversity of instruments is very sparse is the Southern Hemisphere.
Fig. 10. Polar orthographic projection of ozone volume mixing ratio (in ppmv) at 500 K calculated by MIMOSA-CHIM. Left side corresponds
to 13 November and rigth side corresponds to 24 November at 12:00 UTC. R´ıo Gallegos position is indicated with the RG arrow.
Acknowledgements. The authors would like to thank JICA (Japan
International Cooperation Agency) for their financial support; the CNRS in France for their collaboration in facilitating the shelter and part of the electronic instruments; to TEMIS group for the MSR database; to Project ATAMANTAR/PROANTAR/CNPq and INCT-APA/MCTI that supports Brewer calibration and transport to Ar-gentina. Also thanks to the anonymous reviewers that have provided very useful comments, and have helped to improve the manuscript in a very substantial way.
Topical Editor C. Jacobi thanks O. Tripathi and one anonymous referee for their help in evaluating this paper.
The publication of this article is financed by CNRS-INSU.
References
Austin, J., Scinocca, J., Plummer, D., Oman, L., Waugh, D. Akiyoshi, H., Bekki, S., Braesicke, P., Butchart, N., Chipperfield, M., Cugnet, D., Dameris, M., Dhomse, S., Eyring, V., Frith, S., Garcia, R. R., Garny, H., Gettelman, A., Hardiman, S. C., Kin-nison, D., Lamarque, J. F., Mancini, E., Marchand, M., Michou, M., Morgenstern, O., Nakamura, T., Pawson, S., Pitari, G., Pyle, J., Rozanov, E., Shepherd, T. G., Shibata, K., Teyss`edre, H., Wil-son, R. J., and Yamashita, Y.: Decline and recovery of total col-umn ozone using a multimodel time series analysis, J. Geophys. Res., 115, D00M10, doi:10.1029/2010JD013857, 2010. Booth, C. R. and Madronich, S.: Radiation Amplification Factors:
Improved formulation accounts for large increases in ultraviolet radiation associated with Antarctic ozone depletion, Ultraviolet Radiation in Antarctica: Measurements and Biological Effects,
Antarctic Research Series, vol. 62, Amer. Geophys. Union, 39– 42, 1994.
Booth, C. R., Mestechkina, T., and Morrow, J. H.: Errors in the re-porting of solar spectral irradiance using moderate bandwidth ra-diometers: an experimental investigation, in: Ocean Optics XII, SPIE, 2258, 654–663, 1994.
Brewer, A. W.: A replacement for the dobson spectrophotometer?, Pure Appl. Geophys., 919, 106–108, 1973.
Committee on Space Research (COSPAR): The COSPAR Interna-tional Reference Atmosphere (CIRA-86), [Internet]. British At-mospheric Data Centre, available at: http://badc.nerc.ac.uk/data/ cira/, 2006.
Crawford, J., Davis, D., Chen, G., Shetter, R., M¨uller, M., Barrick, J., and Olson, J.: An assessment of cloud effects on photoly-sis rate coefficients: Comparison of experimental and theoretical values, J. Geophys. Res., 104, 5725–5734, 1999.
Dahlback, A.: Measurements of biologically effective UV doses, to-tal ozone abundances, and cloud effects with multichannel, mod-erate bandwidth filter instruments, Appl. Optics, 35, 6514–6521, 1996.
de Laat, A. T. J., van der A, R. J., Allaart, M. A. F., van Weele, M., Benitez, G. C., Casiccia, C., Paes Leme, N. M., Quel, E., Sal-vador, J., and Wolfram, E.: Extreme sunbathing: Three weeks of small total O3columns and high UV radiation over the southern tip of South America during the 2009 Antarctic O3hole season, Geophys. Res. Lett., 37, L14805, doi:10.1029/2010GL043699, 2010.
Estupi˜n´an, J. G., Raman, S., Crescenti, G. H., Streicher, J. J., and Barnard, W. F.: Effects of clouds and haze on UV-B radiation, J. Geophys. Res., 101, 16807–16816, 1996.
Eyring, V., Cionni, I., Bodeker, G. E., Charlton-Perez, A. J., Kinni-son, D. E., Scinocca, J. F., Waugh, D. W., Akiyoshi, H., Bekki, S., Chipperfield, M. P., Dameris, M., Dhomse, S., Frith, S. M., Garny, H., Gettelman, A., Kubin, A., Langematz, U., Mancini, E., Marchand, M., Nakamura, T., Oman, L. D., Pawson, S., Pitari, G., Plummer, D. A., Rozanov, E., Shepherd, T. G., Shibata, K., Tian, W., Braesicke, P., Hardiman, S. C., Lamarque, J. F.,
Mor-genstern, O., Pyle, J. A., Smale, D., and Yamashita, Y.: Multi-model assessment of stratospheric ozone return dates and ozone recovery in CCMVal-2 models, Atmos. Chem. Phys., 10, 9451– 9472, doi:10.5194/acp-10-9451-2010, 2010.
Feng, W., Chipperfield, M. P., Davies, S., Sen, B., Toon, G., Blavier, J. F., Webster, C. R., Volk, C. M., Ulanovsky, A., Ravegnani, F., von der Gathen, P., Jost, H., Richard, E. C., and Claude, H.: Three-dimensional model study of the Arctic ozone loss in 2002/2003 and comparison with 1999/2000 and 2003/2004, Atmos. Chem. Phys., 5, 139–152, doi:10.5194/acp-5-139-2005, 2005.
Fortuin, J. P. F. and Kelder, H.: An ozone climatology base on ozonesonde and satellite measurements, J. Geophys. Res., 103, 31709–31734, 1998.
Fuenzalida, H. A.: Global ultraviolet spectra derived directly from observations with multi-channel radiometers, Appl. Optics, 37, 7912–7919, 1998.
Global Solar UV Index: A Practical Guide World Health Or-ganisation (WHO), World Meteorological orOr-ganisation (WMO), United Nations Environment Program (UNEP), and Interna-tional Commission on Non-Ionising Radiation Protection (IC-NRP) (Geneva), 2002.
Godin, S., Bergeret, V., Bekki, S., David, C., and M´egie, G.: Study of the interannual ozone loss and the permeability of the Antarc-tic Polar Vortex from long-term aerosol and ozone lidar measure-ments in Dumont d’Urville (66.4◦S, 140◦E), J. Geophys. Res., 106, 1311–1330, 2001.
Godin-Beekmann, S., Porteneuve, J., and Garnier, A.: Systematic DIAL lidar monitoring of the stratospheric ozone vertical distri-bution at Observatoire de Haute-Provence (43.92◦N, 5.71◦E), J. Environ. Monit., 5, 57–67, 2003.
Hauchecorne, A., Godin, S., Marchand, M., Heese, B., and Souprayen, C.: Estimation of the Transport of Chemical Con-stituents from the Polar Vortex to Middle Latitudes in the Lower Stratosphere using the High-Resolution Advection Model MI-MOSA and Effective Diffusivity, J. Geophys. Res., 107, D20, doi:10.1029/2001JD000491, 2002.
Hendrick, F., Pommereau, J.-P., Goutail, F., Evans, R. D., Ionov, D., Pazmino, A., Kyr¨o, E., Held, G., Eriksen, P., Dorokhov, V., Gil, M., and Van Roozendael, M.: NDACC/SAOZ UV-visible total ozone measurements: improved retrieval and comparison with correlative ground-based and satellite observations, Atmos. Chem. Phys., 11, 5975–5995, doi:10.5194/acp-11-5975-2011, 2011.
Kuttippurath, J., Godin-Beekmann, S., Lef`evre, F., and Goutail, F.: Spatial, temporal, and vertical variability of polar stratospheric ozone loss in the Arctic winters 2004/2005–2009/2010, Atmos. Chem. Phys., 10, 9915–9930, doi:10.5194/acp-10-9915-2010, 2010a.
Kuttippurath, J., Goutail, F., Pommereau, J.-P., Lef`evre, F., Roscoe, H. K., Pazmi˜no, A., Feng, W., Chipperfield, M. P., and Godin-Beekmann, S.: Estimation of Antarctic ozone loss from ground-based total column measurements, Atmos. Chem. Phys., 10, 6569–6581, doi:10.5194/acp-10-6569-2010, 2010b.
Lee, A. M., Roscoe, H. K., Jones, A. E., Haynes, P. H., Shuckburgh, E. F., Morrey, M. W., and Pumphrey, H. C.: The impact of the mixing properties within the Antarctic stratospheric vortex on ozone loss in spring, J. Geophys. Res., 106, 3203–3211, 2001.
Lef`evre, F., Brasseur, G. P., Folkins, I., Smith, A. K., and Simon, P.: Chemistry of the 1991–1992 stratospheric winter: Three-dimensional model simulations, J. Geophys. Res., 99, 8183– 8195, 1994.
Levelt, P. F., van den Oord, G. H. J., Dobber, M. R., Mlkki, A., Visser, H., de Vries, J., Stammes, P., Lundell, J., and Saari, H.: The Ozone Monitoring Instrument, IEEE T. Geosci. Remote Sens., 44, 1093–1101, 2006.
Madronich, S.: UV radiation in the natural and perturbed atmo-sphere, in: Environmental Effects of UV (Ultraviolet) Radiation,, edited by: Tevini, M., Lewis Publisher, Baca Raton, pp. 17–69. TUV model, web page: http://www.acd.ucar.edu/TUV/, 1993. McIntyre, M. and Palmer, T.: The ‘surf zone’ in the stratosphere, J.
Atmos. Terr. Phys., 46, 825–849, 1984.
Nash, E. R., Newman, P. A., Rosenfield, J. E., and Schoeberl, M. E.: An objective determination of the polar vortex using Ertel’s potential vorticity, J. Geophys. Res., 101, 9471–9478, 1996. Newman, P. A., Kawa, S. R., and Nash, E. R.: On the size of
the Antarctic ozone hole, Geophys. Res. Lett., 31, L21104, doi:10.1029/2004GL020596, 2004.
Newman, P. A., Nash, E. R., Kawa, S. R., Montzka, S. A., and Schauffler, S. M.: When will the Antarctic ozone hole recover?, Geophys. Res. Lett., 33, L12814, doi:10.1029/2005GL025232, 2006.
Orce, V., Helbling, E., Paladini, A., Labraga, J., Sanroman, N., and Paladini, A. A.: Latitudinal Uvr-par Measurements in Argentina – Extent of the Ozone Hole (Vol 15, Pg 113, 1997), Global Planet. Change, 18, 75–75, 1998.
Pazmi˜no, P. A., Wolfram, E., Quel, E., Lavorato, M., Piacentini, R., Godin, S., Porteneuve, J., and M´egie, G.: Intercomparison Of Ozone Profiles Measurements By A Differential Absorption Lidar System And Satellites At Buenos Aires, Argentina, Pro-ceedings del SPIE, Vol. 4419, ISSN 0277-786X/ISBN 0-8194-4126-0, pp. 499–502, 2001.
Pazmi˜no, A., Godin-Beekmann, S., Ginzburg, M., Bekki, S., Hauchecorne, A., Piacentini, R., and Quel, E.: Impact of An-tartic polar vortex occurrences on total ozone and UVB ra-diation at southern Argentinean and Antarctic stations dur-ing 1997–2003 period, J. Geophys. Res., 110, D03103, doi:10.1029/2004JD005304, 2005.
Pommereau, J. P. and Goutail, F.: Stratospheric O3and NO2 obser-vations at the southern polar circle in summer and fall 1988, Geo-phys. Res. Lett., 15, 895–897, doi:10.1029/GL015i008p00895, 1988.
Roscoe, H. K., Johnston, P. V., Van Roozendael, M., Richter, A., Preston, K., Lambert, J. C., Hermans, C., de Cuyper, W., Dze-nius, S., Winterath, T., Burrows, J., Sarkissian, A., Goutail, F., Pommereau, J. P., d’Almeida, E., Hottier, J., Coureul, C., Ra-mond, D., Pundt, I., Bartlet, L. M., Kerr, J. E., Elokhov, A., Giovanelli, G., Ravegnani, F., Premudan, M., Kostadinov, M., Erle, F., Wagner, T., Pfeilsticker, K., Kenntner, M., Marquand, L. C., Gil, M., Puentedura, O., Arlander, W., Kastad-Hoiskar, B. A., Tellefsen, C. W., Heese, C. W., Jones, R. L., Aliwalle, S. R., and Freswater, R. A.: Slant column measurements of O3 and NO2during the NDSC intercomparison of zenith-sky UV-visible spectrometers in June 1996, J. Atmos. Chem., 32, 281– 314, 1999.
Roscoe, H. K., Shanklin, J. D., and Colwell, S. R.: Has the Antarc-tic Vortex Split before 2002?, J. Atmos. Sci., 62, 581–588,
doi:10.1175/JAS-3331.1, 2005.
Solomon, S.: Stratospheric ozone depletion: A review of concepts and history, Rev. Geophys., 37, 275–316, doi:10.1029/1999RG900008, 1999.
Tripathi, O. P., Godin-Beekmann, S., Lef`evre, F., Marchand, M., Pazmi˜no, A., Hauchecorne, A., Goutail, F., Schlager, H., Volk, C. M., Johnson, B., K¨onig-Langlo, G., Balestri, S., Stroh, F., Bui, T. P., Jost, H. J., Deshler, T., and von der Gathen, P.: High resolution simulation of recent Arctic and Antarctic stratospheric chemical ozone loss compared to observations, J. Atmos. Chem., 55, 205– 226, doi:10.1007/s10874-006-9028-8, 2006.
van der A, R. J., Allaart, M. A. F., and Eskes, H. J.: Multi sen-sor reanalysis of total ozone, Atmos. Chem. Phys. Discuss., 10, 11401–11448, doi:10.5194/acpd-10-11401-2010, 2010. Vaughan, G., Roscoe, H. K., Bartlett, L. M., O’Connor, F. M.,
Sarkissian, A., Van Roozendael, M., Lambert, J.-C., Simon, P. C., Karlsen, K., Kaastad Hoiskar, B. A., Fish, D. J., Jones, R. L., Freshwater, R., Pommereau, J.-P., Goutail, F., Andersen, S. B., Drew, D. G., Hughes, P. A., Moore, D., Mellqvist, J., Hegels, E., Klupfel, T., Erle, F., Pfeilsticker, K., and Platt, U.: An intercom-parison of ground-based UV- visible sensors of Ozone and NO2, J. Geophys. Res., 102, 1411–1422, 1997.
Wolfram, E. A., Salvador, J., Pallotta, J., D’Elia, R., Otero, L., Godin-Beeckmann, S., Nakane, H., and Quel, E.: Solar Cam-paign: First Results Of Ozone Profile Measurements At Rio Gal-legos, Argentina, in: Reviewed and Revised Papers Presented at the 23rd International Laser Radar Conference, edited by: Naga-sawa, C. and Sugimoto, N., ISBN 4-9902916-0-3, Part II, 365– 368, 2006.
Wolfram, E. A., Salvador, J., D’Elia, R., Casiccia, C., Paes Leme, N., Pazmi˜no, A., Porteneuve, J., Godin-Beekmann, S., Nakane, H., and Quel, E.: New differential absorption lidar for stratospheric ozone monitoring in Patagonia, South Argentina, J. Opt. A: Pure Appl. Opt., 10, 104021, doi:10.1088/1464-4258/10/10/104021, 2008.
World Meteorological Organization (WMO): Scientific assessment of ozone depletion: 2006, in Global Ozone: Past and Present, Global Ozone Res. Monit. Proj. Rep. 50, World Meteorol. Or-gan., Geneva, Switzerland, 2007.
World Meteorological Organization (WMO): Scientific Assessment of Ozone Depletion: 2010, Global Ozone Research and Monitor-ing Project-Report No. 52, 516 pp., Geneva, Switzerland, 2011. Yang, E.-S., Cunnold, D. M., Newchurch, M. J., and Salawitch, R.
J.: Change in ozone trends at southern high latitudes, Geophys. Res. Lett., 32, L12812, doi:10.1029/2004GL022296, 2005.