Development of an In-Flight-Deployable Micro-UAV
Tony S. Tao1 and R. John Hansman2Massachusetts Institute of Technology, Cambridge, MA, 02139
A micro-UAV system was developed to be deployed from a host aircraft at normal jet cruise conditions (between 25,000 and 35,000 feet altitude and Mach 0.8) using the standard MJU-10/B countermeasure flare form factor. The system (measuring 49mm × 62mm × 180mm) fits in the flare canister in place of the chaff. The 220-gram battery-powered, pusher-propelled UAV has folding tandem wings with elevon control surfaces on the rear wing. A case protects the UAV during ejection. In freefall, the system is stabilized and decelerated with a drag streamer to approximately 40 m/s, when the case opens and the vehicle unfolds. The UAV was designed to maximize endurance while station-keeping in 30 m/s winds. Estimated level-flight endurance at 30,000 feet carrying a 10-gram payload is 45 minutes with greater endurance at lower altitudes. Up to 45 minutes of glide endurance can be achieved depending on deployment altitude. The small dimensions and low Reynolds number of the wings required manufacturing constraints to be considered in the airfoil design to prevent laminar separation which impacted controllability. Compact folding mechanisms were designed to enable wing folding. An elevon control mechanism was designed to engage automatically with the control surface when the rear wing unfold. Ejection shock, deployment, and flight tests were conducted to demonstrate the feasibility of the concept.
Nomenclature
D = drag
q = dynamic pressure CDA = drag area of body S = wing area
CL, Cl = 3D, 2D lift coefficient
CD, Cd = 3D, 2D drag coefficient
W = weight
e = span loading efficiency b = wing span
ηprop = propulsion system efficiency
E
̅ = specific energy t = time
f = weight fraction
Kt = coefficient relating size of tail to wing
I. Introduction
A deployable micro-UAV was designed for atmospheric sampling or surveillance missions. The UAV system was designed to provide maximum endurance while satisfying the following requirements:
1. Launch from a host aircraft from an MJU-10/B countermeasure flare cartridge. The flare canister allows for a system envelope of 49mm × 62mm × 180mm and is shown schematically in Figure 1. The flare cartridge ejects the system using a pyrotechnic charge which pushes the UAV system with an acceleration of 300 G.
1 PhD Candidate, MIT Aero Astro, 77 Massachusetts Ave 33-115, AIAA Student Member.
Figure 1: Schematic of available system envelope
2. Be capable of deploying from high altitude flights. 30,000 ft was assumed for the design. 3. Be capable of station-keeping in typical winds at altitude. 30m/s was assumed. [1] 4. Carry a small atmospheric sensing payload.
5. Carry an autopilot and communication system.
To develop the UAV system, the battery size was optimized based on a general tandem wing configuration which met the packaging constraints. A trade-off analysis was conducted to determine the wing and fuselage layout to maximize endurance. Prototypes were constructed and aerodynamic performance and handling qualities were evaluated through wind tunnel and flight tests. Airfoils were refined for low-Reynolds effects and manufacturability. Mechanisms were designed to enable the wings to fold and for the elevons on the deployed wings to be controlled. Full-system integration, shock, and deployment tests were conducted. A more extensive documentation of the system is may be found in [2].
II. Vehicle and Mission Overview
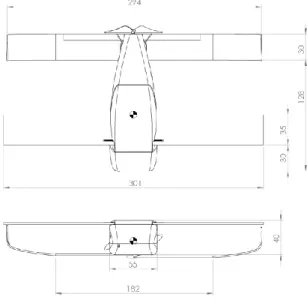
The UAV, as shown in Figure 2, has a tandem-wing, pusher-propeller configuration with elevon control surfaces on the rear wing. The top mounted front wings are hinged at the root near the leading edge, and the rear wings share a coaxial hinge. The front wing provides the majority of lift and behaves as the main wing while the lower rear wing behaves as a lightly-lifting tail. Two vertical fins on the tips of the rear wings provide passive lateral stability. The vehicle has a mass of 220 grams.
Figure 2: UAV external geometry (mm)
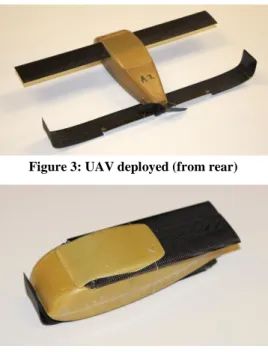
The tandem-wing was designed for positive static stability and packaging. The UAV’s center of gravity is designed to lie on the fuselage centerline at the trailing edge of the front wing. To achieve static stability, the fuselage was designed to place the heavier components forward. Figure 3 and Figure 4 show the UAV with wings deployed and folded, respectively.
Figure 3: UAV deployed (from rear)
Figure 4: UAV folded (from front)
Figure 5 shows the internal configuration of the UAV. The lithium-polymer battery pack (comprising 55% of the total vehicle weight) is positioned in the nose of the vehicle to keep the center of gravity forward for static stability. The payload is located in the nose of the vehicle on the right side. A larger payload may be carried at a reduction of battery size. The motor and elevon control servos are mounted on a central bulkhead structure in the lower-center section of the fuselage.
Above the motor and servos, a custom autopilot and communications board is mounted. This board was developed by MIT Lincoln Laboratory to meet the packaging constraints of the vehicle. An antenna is stored internally near the rear of the vehicle. The pusher-propeller is mounted at the tail and is driven by the motor through a shaft.
Figure 5: UAV internal layout
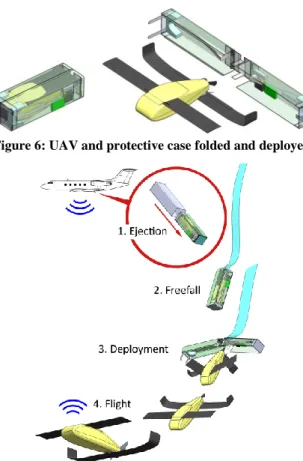
Figure 6 shows the UAV and protective case in both folded and deployed configurations. The deployment sequence is shown in Figure 7. The UAV is ejected tail-first in a protective case so that the battery pack does not load the rest of the structure during the 300-G launch.
Figure 6: UAV and protective case folded and deployed
Figure 7: UAV concept of operations
The protective case interfaces the UAV with the flare canister geometry, supports the ejection loads, and dampens the ejection impulse, permitting a lighter UAV structure. A streamer for aerodynamic deceleration is attached to the end of the case toward the vehicle tail. The streamer both slows the system during freefall and orients the system vehicle-nose-down. The protective case opens to allow the UAV to deploy in a nose down attitude where it is passively stable until the flight control system orients and activates.
After deployment the UAV will fly the programmed mission until the battery power reaches a minimum level when the UAV enters a glide profile and can continue sampling during the glide phase. The vehicle is equipped with a short range communications system which can download data in flight either to the host aircraft, other UAVs or to the ground.
The L/D of the UAV measured to be 8 or greater based on Reynolds-matched wind tunnel test at a cruise speed of 30 m/s. Flown at this cruise condition, the UAV is predicted to have an endurance of 45 minutes in level flight and 45 minutes of glide from 30,000 ft.
III. Power System Sizing
The UAV was designed for electric propulsion system as this system best matched the high altitude flight condition and packaging requirements. A lithium-polymer cell was selected for its high specific energy at a package size that permits longitudinal and lateral placement of cells to allow freedom of configuration in the limited
envelope [3].
The initial power system sizing was conducted to maximize the endurance given the limited physical envelope. Having an undersized battery would yield lower endurance due to the reduction of energy carried onboard. Having an oversized battery would also lower endurance as the wing loading and fuselage drag (due to the vehicle’s packaging constraints) increase with battery mass beyond the capacity provided by additional battery.
The steady-level endurance of the vehicle can be calculated by dividing the total battery energy by the propulsive power-required, as shown in Eq. (1).
tendurance= Ebatt
Pbatt (1)
The battery energy can be calculated using the product of the onboard battery weight and the energetic density of batteries, as shown in Eq. (2).
Ebatt= WbattE̅ (2)
The power required to fly the aircraft is calculated using Eq. (3), which shows battery power as related to the drag, flight speed, and propulsive efficiency.
Pbatt = 1
ηpropDV (3)
The drag of the UAV can be calculated using Eq. (4), which factors-in fuselage, wing, tail, and induced drags. D = q(CDA + SCdw+ StCdt) +
W2
qπeb2 (4)
To link the vehicle weight W to the weight of onboard components, weight fractions are used, defined in Eq. (5).
fsubsystem≡
Wsubsystem
Wentire UAV (5)
Using the above equations, Eq. (6) is derived.
tendurance= ⋯ ( V ηpropE̅( Cdw CL (1+Kt) fbatt + qCDA Wbatt+ Wpay qb2πef battfpay)) −1 (6) Using the above, Eq. (6) relates the UAV’s steady-level endurance to the aerodynamic performance of the wings and fuselage, propulsive performance and efficiencies, and weights of all components.
Airframe aerodynamics
- The airframe was assumed to be a tandem-wing configuration: Kt= 1
- Wingspan b = 300 mm - Airfoil Cl/Cd= 30
- Maximum S = 24,000 mm2 (assuming pivoting wings, twice the vertical projected area)
- Cruise CL= 0.5
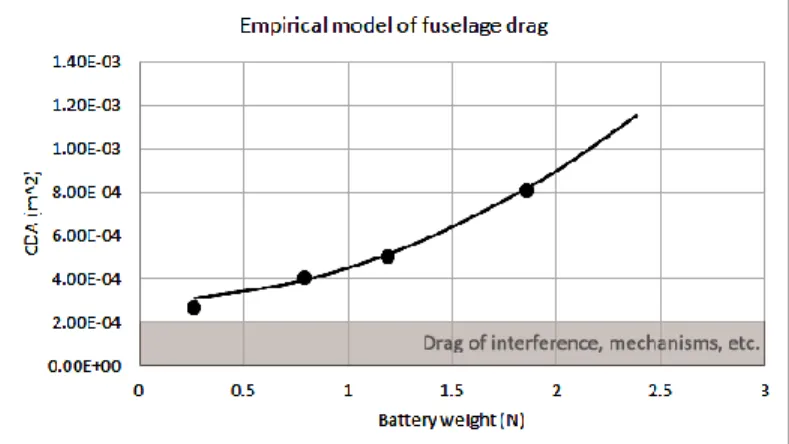
- The fuselage drag was modeled using an empirical fit to a set of fuselages that would accommodate different number of battery cells. Also accounted in this model was drag expected from the wing folding mechanisms and other extrusions.
Figure 8: Empirical model relating drag and battery size
Power system
- Cell voltage = 3.7 V - Cell capacity = 700-mAh
- Cell dimensions = 48mm × 30mm × 4.6mm.
- Energy density of the battery E = 52,800 J/N, as measured by a cold-temperature −20°C discharge test [1]. - Motor efficiency = 78% for a 3-series and 73% for a 2-series battery configuration [4].
- Efficiency of the electronic speed controller = 90% [5]. - Propeller efficiency = 70% [6].
Masses
- Mass of onboard electronics and payload = 20 grams - Mass of the power system = 25 grams.
- Mass of airframe = 80 grams. - Battery cell mass= 13.5 grams.
Flight environment
- ρ = 0.46kg/m3 (standard density at 30,000 ft).
- V ≥ 30 m/s to meet station-keeping requirement.
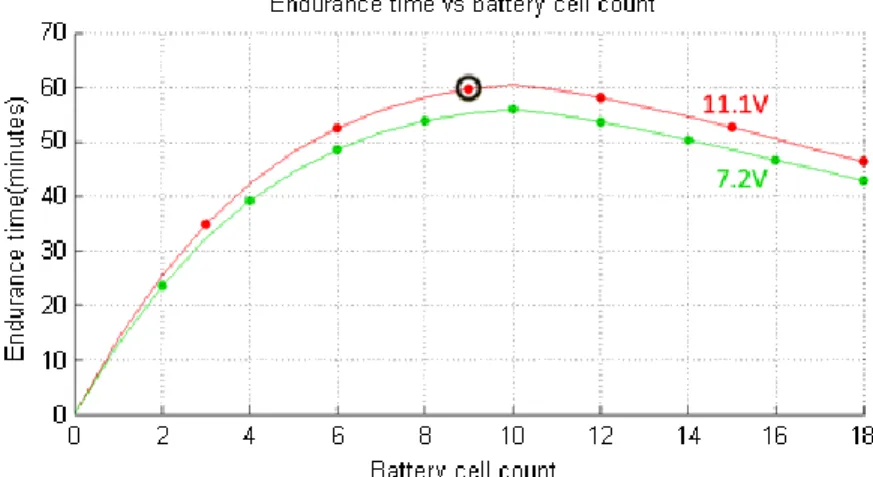
The results of the battery sizing study are shown in Figure 9 and indicate that a 9-cell (3-series, 3-parallel) battery configuration yielded the maximum endurance.
Figure 9: Battery sizing optimization
IV. Fuselage-Wing Layout Optimization
Because the wing and fuselage geometries are coupled through the position of the forward wing hinge, the aerodynamic efficiency is dependent on the hinge location. An analysis was conducted to determine the optimal location. As this hinge location is varied, the wingspan and fuselage profile must change simultaneously.
Figure 10: Wing swinging geometry
As Figure 10 shows, the front wings swing in a plane above the battery pack. To maintain lifting surface continuity, the pivot location of the wing must be inside the fuselage’s outer mold lines. The sum of the “hinge location” and “swung semispan” cannot exceed the total “nose to wingtip” distance. The result is that the thickness distribution of the fuselage determines the available wingspan.
A family of fuselage shapes was created that shift the thickness distributions fore and aft to allow the wing to swing over the battery pack for each hinge location. These fuselages and the wings compatible with them are shown in Figure 11.
Figure 11: Wing-fuselage geometry coupling
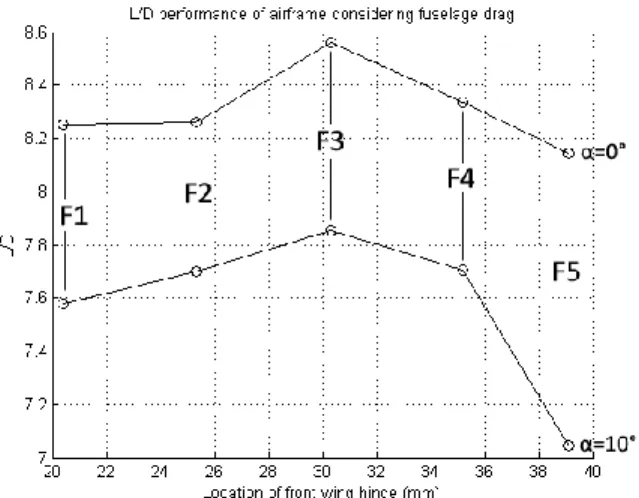
On the right side of Figure 11, the “Hinge position” line shows the farthest-forward hinge location each fuselage (F1 to F5) can have. The left side of the figure shows the wingspan achievable with each fuselage.
To determine the best airframe configuration, both wing and fuselage performance had be taken into account. Fuselage drag was determined by testing F1 through F5 models in a 1-ft by 1-ft wind tunnel. Wing viscous drag was predicted using XFOIL [7] and induced drag was computed using a vortex-lattice model solving for constant-lift. Adding the fuselage and wing drag results together, the performance of the entire airframe was determined. The trade study’s results are summarized in Figure 12.
Figure 12: Fuselage-coupled performance study results
The study showed that the maximum performance was achieved with fuselage F3, which placed the wing hinge approximately 30 mm (19% body length) from the nose.
The 9-cell battery pack was placed in the nose so that the UAV’s center of gravity would be as forward as possible. By placing the center of gravity forward, the forward wing area and span were maximized while maintaining positive static stability. This configuration yielded better aerodynamic performance as the forward hinge location allowed the wingspan of the front (more heavily-loaded) wing to be maximized, allowing induced drag to be minimized.
The general configuration of the battery pack is shown in Figure 9. One set of 3 cells is oriented vertically behind the payload. The remaining 6 cells are staggered to conform to the nose contour which moved the center of gravity forward and put the cells in direct contact with the fuselage shell which minimized the load paths during launch.
Figure 13: Staggered battery layout
V. Aerodynamic Tests and Refinement
To determine the performance of the design, a prototype was tested in the MIT Wright Brothers wind tunnel and compared against XFLR5 [8] predicted performance. The chord-Reynolds of the main wing during cruise conditions was 30,000.
The prototype was supported by a fork and wire that intersected the UAV center of mass. Using this mounting scheme, the vehicle was allowed to freely pivot about its center of mass. To control the pitch attitude, the elevons were controlled by remote-control. This scheme allowed the longitudinal static stability and trim behavior to be determined. Figure 14 below shows the UAV in its wind tunnel mount.
The L/D vs CL for two tunnel speeds compared against computer-predicted results are shown below in Figure
15.
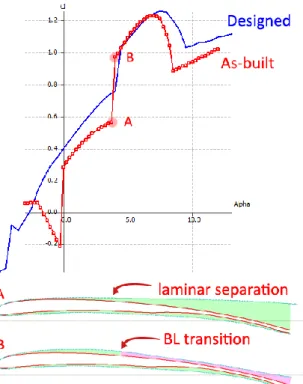
Figure 15: Wind tunnel test results for vehicle with initial airfoils
The wind tunnel test revealed a stability problem, as indicated by the lack of data points between CL= 0.3 and
CL= 0.5 in Figure 15. In this range, the aircraft was statically unstable. Starting from low lift coefficient, as the
elevator deflection was increased, the vehicle exhibited a sudden jump in angle of attack and lift coefficient. The vehicle exhibited elevator-𝐶𝐿 hysteresis which made a large segment of the CL range inaccessible.
It was hypothesized that the bi-modal pitch behavior was due to laminar separation effects caused by
inaccuracies in the construction of the front wing airfoil. The originally-designed airfoil nose radius was too small for the available end mills to accurately mill the mold, resulting in a blunting of the leading edge.
The constructed airfoil was scanned, digitized, and analyzed in XFOIL. The results in Figure 15 show a clear discontinuity in the lift-curve slope of the constructed airfoil between points A and B.
In the figure, points A and B call out to either side of the lift-curve discontinuity. At point A, the upper surface laminar boundary layer separates without reattachment. At point B, a laminar separation bubble forms, and the turbulent boundary layer reattaches at 45% chord.
A revised set of airfoils was developed to minimize the lift curve slope discontinuity while considering the manufacturing limitations of the small scale. The airfoils were designed such that a standard 1/32” ball mill would match the leading edge radius on the upper surface just downstream of the stagnation point as shown in Figure 16.
Figure 16: Original and manufacturing-modified airfoils
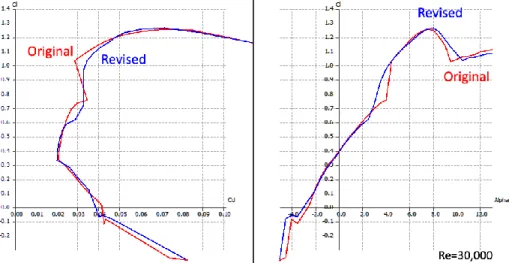
The airfoil was designed to trade some drag performance for linearity of the lift-curve. As the blue polar in Figure 17 shows, the revised airfoil has slightly more drag but is more gradual in its transition between the laminar and turbulent recovery portions of the CL curve.
Figure 17: Revised airfoil (TLR2) performance against original
Revised molds were machined and wings produced from these molds were mounted in a prototype vehicle and tested in the wind tunnel. The results from the revised airfoils are shown in Figure 18. There was much greater pitch controllability and a higher L/D over more of the CL range than the initial prototypes.
Figure 18: Wind tunnel test results for vehicle with revised airfoils compared against XFLR5 predictions
VI. Detailed Structural Design
The external fuselage fairing was constructed from Kevlar in a compressive mold to permit radio-transparency for the antenna. The fuselage was composed of three main components – two structural shell halves and a flexible fairing, as shown in Figure 19.
Figure 19: Fuselage shell details
To satisfy the folding requirements of the UAV, wing folding and control mechanisms were designed. The fuselage employed two hollow columns near the front which provided support for the front wing hinge pin which transferred the lift and bending moments from the front wing. The hollow pin also contained a bundle of spring steel wires, which act as torsion springs and actuate the wing’s rotation on deployment. The wing pin is bonded to a fillet on the carbon fiber wing, which distributes the bending moment. A schematic of the wing root and the pin is shown in Figure 20.
To stow the stabilizing fins and to operate in the narrow rear of the fuselage, the rear wing folding geometry was designed around a concentric hinge. The rear wings are spring loaded to push against each other to swing backwards when unconstrained. The mechanism is composed of a stack of components, arranged in three concentric layers. The two inner layers attach to the right and left wings, which are spring-loaded against each other to push the wings backwards. The outermost layer bears the loads of the wings to the fuselage shell. An exploded view of the rear wing mechanism is shown in Figure 21.
Figure 21: Rear wing mechanism design
The elevon control surfaces were designed to stow against the body and engage with a control linkage during deployment. To accomplish this, the elevon control surfaces were spring-loaded trailing-edge upwards by a torsion wire. This wire was bonded to the wing on one end and the control surface on the other.
When the UAV is stowed, the elevons are prevented from deflecting upwards by the elevon guideplate as shown in Figure 21. When the rear wing deploys, the elevons are aligned with the cutout of the guideplate and are then free to deflect upwards. The elevons are stopped in their upward motion by the control “fingers” driven by the servos in torsion, as shown in Figure 22.
Figure 22: Elevon control system
To actuate the elevon, a servo rotates a control finger, which wipes the contact point along the trailing edge and deflects the elevon. The top of Figure 22 shows an upward deflection, and the bottom shows a downward deflection. This system allows the control surfaces to fold away under the UAV, and upon wing deployment, the geometry automatically engages to enable control of the UAV. The servos are mounted to the central bulkhead assembly, as shown in Figure 23.
Figure 23: Rear wing assembled with control and deployment system
VII. Protective Case
The protective case shown in Figure 24 was designed to withstand the ejection loads, to protect the UAV from aerodynamic forces during freefall, and to open cleanly during deployment. Figure 25 shows the UAV folded inside the case.
Figure 24: Internals of protective case
Figure 25: Folded UAV package during launch
During ejection, the sidewalls of the case transfer the load (125 lbf in compression) around the UAV to burst the flare cartridge cap. A spring-loaded backplate attaches to the two sidewall assemblies.
The case contains protective foam which distributes the ejection load over the left and right edges of the nose area of the fuselage, which is able to resist deformation due to its 3-dimensional “eggshell” strength. The case has an independent control system which opens the case by pulling 2 servo-actuated pull-pins a fixed time after ejection is sensed through an onboard accelerometer.
The case was designed to enable a clean deployment by splitting symmetrically so that the UAV would not be tumbled during opening. The open concave face of the case presents a large drag body to the flow, which slows the case and pulls it away from the falling UAV.
VIII. Integration and Testing
A series of tests were conducted to demonstrate the feasibility of the UAV system. Hand-launched radio-controlled flight tests were conducted of both double-scale and actual-scale models at reduced wing loading to evaluate the vehicle’s stability and controllability. The vehicle was found to be laterally-stable, although roll input was required to counteract the torque from the propulsion system at high throttle settings. The vehicle was unstable in the spiral mode, but the mode was slow enough for the instability was manageable. Pitching the nose downwards for high-speed flight caused pitch oscillations, possibly due to a negative-stall of the front wing. The pitch response improved at slightly-positive attitudes.
At time of preliminary flight testing the miniature autopilot and data acquisition electronics were not available, resulting in limited onboard flight data. Based on external video observations of glide performance, an L/D of 5 to 7 was estimated. A photograph of the actual-scale UAV in flight is shown in Figure 26.
Figure 26: UAV prototype in flight
In order to evaluate the ability of the UAV to survive ejection loads, a shock test was conducted. A UAV in its protective case was ejected from a flare magazine using the MJU-10/B pyrotechnic charge. Figure 27 shows two frames from the high-speed footage taken from the test.
Figure 27: Ejection shock-test performed at MIT LL
The UAV used in the test was a structurally-functional, folding airframe with batteries, motor, servos, and mock-ups of the payload and autopilot boards. The protective case was fully-functional with a working opening mechanism.
After the ejection test, an in-lab deployment test was conducted and the UAV was disassembled to determine the effectiveness of the folding mechanisms and deployment sequence and survivability of internal structure. The
UAV and case were suspended by a wire and the case deployment mechanism was triggered remotely to release the UAV. Frames from a video recording of the deployment are shown in Figure 28.
Figure 28: Post-ejection deployment test
After the deployment test, the UAV was disassembled and showed no significant structural damage. All components were secure in their attachment locations and power and control systems were still connected and functional. Minor puncture damage was sustained by the nose of the body shell, resulting from a fastener used to secure the latch mechanism’s tab. In subsequent versions of the protective case, the fastener was replaced by bonding, which removed the danger of fuselage damage.
To demonstrate the deployment capabilities of the package in freefall, a drop-deployment test was conducted. In this test, a UAV folded in a case was suspended from a helium balloon by the drag streamer. Both the UAV and case were remotely-controlled. After release, the case was remotely opened once the system reached 90% terminal velocity, and the UAV was released. The UAV was piloted via remote-control to enter a landing pattern. A composite picture of the drop-deployment test is shown below in Figure 29.
In Figure 29 the black line traces the location of the UAV, and the white lines link the location of the UAV to the location of the case at the same moment in time. As the white lines show, after the case opens, the UAV accelerates downwards away from the case as designed.
IX. Conclusion
A novel micro-UAV system was developed capable of being deployed in-flight from a standard countermeasure flare cartridge. The UAV was designed to meet its mission requirements through power-system sizing and
configuration trade-space analysis. Initial control problem resulting from lift curve discontinuities identified the need for careful consideration of airfoil leading edge manufacturing limits at the small-scale and low-Reynolds numbers of the vehicle. Novel mechanisms and structures were designed to allow folding of the vehicle within the compact packaging constraints. The feasibility of the concept was demonstrated through flight tests, shock, and deployment tests of prototype vehicles.
X. Acknowledgements
This project was started as a part of an undergraduate senior capstone design class in the MIT department of Aeronautics and Astronautics. As such, members and faculty of the 2010-2011 class contributed to the success of the project. This work was supported by the MIT Lincoln Laboratory and the US Air Force under contract as part of the MIT Beaver Works collaboration.
XI. References
[1] MIT 16.82/16.885, "LOCUSTS - Low Cost UAV Sampling Test System Critical Design Review," Massachusetts Institute of Technology, Cambridge, MA, 2010.
[2] Tao, T., Design and development of a high-altitude, in-flight-deployable micro-UAV, Cambridge: MIT, 2012. [3] Ener1 Korea Inc., "Simplified Specification SPB463048," 24 February 2012. [Online]. [Accessed 11 May
2010].
[4] Dr Kiwi, "FlyBrushless.com, Neu - Proton 12-30-4000," 22 December 2010. [Online]. Available: http://www.flybrushless.com/motor/view/548. [Accessed 2 February 2011].
[5] matttay, "ESC Efficiency at Various Throttle Points, RCgroups.com," 9 March 2009. [Online]. Available: http://www.rcgroups.com/forums/attachment.php?attachmentid=2389256. [Accessed 22 May 2012]. [6] Grasmeyer, J; Keennon, M.; Matthew, T., "Development of the Black Widow Micro Air Vehicle," in 39th
AIAA Aerospace Sciences, Reno, Nevada, 2001.
[7] Drela, M., "XFOIL Subsonic Airfoil Development System," MIT, Cambridge, 2001.
[8] Deperrois, A., "XFLR5: Analysis of foils and wings operating at low Reynolds numbers," Andre Deperrois, GNU GPLv2, 2011.