HAL Id: hal-00302715
https://hal.archives-ouvertes.fr/hal-00302715
Submitted on 11 Apr 2007HAL is a multi-disciplinary open access
archive for the deposit and dissemination of sci-entific research documents, whether they are pub-lished or not. The documents may come from teaching and research institutions in France or abroad, or from public or private research centers.
L’archive ouverte pluridisciplinaire HAL, est destinée au dépôt et à la diffusion de documents scientifiques de niveau recherche, publiés ou non, émanant des établissements d’enseignement et de recherche français ou étrangers, des laboratoires publics ou privés.
Twenty-five years of continuous sulphur dioxide emission
reduction in Europe
V. Vestreng, G. Myhre, H. Fagerli, S. Reis, L. Tarrasón
To cite this version:
V. Vestreng, G. Myhre, H. Fagerli, S. Reis, L. Tarrasón. Twenty-five years of continuous sulphur dioxide emission reduction in Europe. Atmospheric Chemistry and Physics Discussions, European Geosciences Union, 2007, 7 (2), pp.5099-5143. �hal-00302715�
ACPD
7, 5099–5143, 2007 Twenty-five years of continuous sulphur dioxide emission reduction in Europe V. Vestreng Title Page Abstract Introduction Conclusions References Tables Figures ◭ ◮ ◭ ◮ Back CloseFull Screen / Esc
Printer-friendly Version Interactive Discussion
Atmos. Chem. Phys. Discuss., 7, 5099–5143, 2007 www.atmos-chem-phys-discuss.net/7/5099/2007/ © Author(s) 2007. This work is licensed
under a Creative Commons License.
Atmospheric Chemistry and Physics Discussions
Twenty-five years of continuous sulphur
dioxide emission reduction in Europe
V. Vestreng1, G. Myhre2, H. Fagerli1, S. Reis3, and L. Tarras ´on1
1
Air Pollution Section, Research Department, Norwegian Meteorological Institute, Oslo, Norway
2
Department of Geosciences, University of Oslo, Oslo, Norway
3
Atmospheric Sciences Section, Centre for Ecology & Hydrology, Edinburgh, Scotland Received: 9 February 2007 – Accepted: 29 March 2007 – Published: 11 April 2007 Correspondence to: V. Vestreng ([email protected])
ACPD
7, 5099–5143, 2007 Twenty-five years of continuous sulphur dioxide emission reduction in Europe V. Vestreng Title Page Abstract Introduction Conclusions References Tables Figures ◭ ◮ ◭ ◮ Back CloseFull Screen / Esc
Printer-friendly Version Interactive Discussion
Abstract
During the last twenty-five years European emission data have been compiled and reported under the Cooperative Programme for Monitoring and Evaluation of the Long-range Transmission of Air Pollutants in Europe (EMEP) as part of the work under the UNECE Convention on Long-range Transboundary Air Pollution (LRTAP). This paper
5
presents emission trends of SO2reported to EMEP and validated within the programme for the period 1980–2004. These European anthropogenic sulphur emissions have been steadily decreasing over the last twenty-five years, amounting from about 55 Tg SO2 in 1980 to 15 Tg SO2in 2004. The uncertainty in sulphur emission estimates for individual countries and years are documented to range between 3% and 25%. The
10
relative contribution of European emissions to global anthropogenic sulphur emissions has been halved during this period. Based on annual emission reports from European countries, three emission reduction regimes have been identified. The period 1980– 1989 is characterized by low annual emission reductions (below 5% reduction per year and 20% for the whole period) and is dominated by emission reductions in Western
15
Europe. The period 1990–1999 is characterised by high annual emission reductions (up to 11% reduction per year and 54% for the whole period), most pronounced in Cen-tral and Eastern Europe. The annual emission reductions in the period 2000–2004 are medium to low and reflect the unified Europe, with equally large reductions in both East and West. The sulphur emission reduction has been largest in the sector Combustion
20
in energy and transformation industries, but substantial decreases are also seen in the Non-industrial combustion plants together with the sectors Industrial Combustion and Industrial Production Processes. The majority of European countries have reduced their emissions by more than 60% between 1990 and 2004, and one quarter have al-ready achieved sulphur emission reductions higher than 80%. At European level, the
25
total sulphur target for 2010 set in the Gothenburg Protocol (16 Tg) has apparently al-ready been met by 2004. However, still half of the Parties to the Gothenburg Protocol have to reduce further their sulphur emissions in order to attain their individual country
ACPD
7, 5099–5143, 2007 Twenty-five years of continuous sulphur dioxide emission reduction in Europe V. Vestreng Title Page Abstract Introduction Conclusions References Tables Figures ◭ ◮ ◭ ◮ Back CloseFull Screen / Esc
Printer-friendly Version Interactive Discussion
total emission targets for 2010. It is also noteworthy that, contrasting the Gothenburg Protocol requirements, a growing number of countries have recently been reporting increasing sulphur emissions, while others report only minor further decreases. The emission trends presented here are supported by different studies of air concentrations and depositions carried out within and outside the framework of the LRTAP
Conven-5
tion.
1 Introduction
Much attention has been given to the abatement of sulphur dioxide (SO2) emissions since the 1970s, when the transboundary character of air pollutants was first robustly established and documented (e.g. OECD, 1977; Eliassen and Saltbones, 1983; Menz
10
and Seip, 2004; Grennfelt and Hov, 2005). In order to control these emissions, interna-tional co-operation was deemed indispensable and to that purpose, the United Nations Economic Commission for Europe (UNECE) Convention on Long-range Transbound-ary Air Pollution (LRTAP) was established in 1979. Today, the LRTAP Convention has fifty-one Parties, forty-seven of which are European. At present, there are three
inter-15
national Protocols from the LRTAP Convention in force to reduce sulphur dioxide emis-sions. While the first Protocol, the 1985 Sulphur Protocol, adopted a flat rate approach (reduction of national annual sulphur emissions by at least 30% between 1980 and 1993), the two succeeding Protocols, the 1994 Sulphur Protocol and the 1999 Multi-effect Protocol (Gothenburg Protocol), are Multi-effects based (UNECE, 2004). This means
20
that they aim at efficiently reducing sulphur emissions where environmental effects are most severe. In addition to the UN Protocols, several European Union (EU) Directives are regulating sulphur emissions, the most recent one being the 2001 National Emis-sion Ceilings (NEC) Directive, 2001/81/EC (EC, 2001), presently under reviEmis-sion. The NEC Directive establishes emission ceilings to be attained by 2010 for sulphur
diox-25
ide, nitrogen oxide, volatile organic compounds and ammonia for the 25 EU Member States. Targets for the Member States that joined the EU in 2003 are specified in the
ACPD
7, 5099–5143, 2007 Twenty-five years of continuous sulphur dioxide emission reduction in Europe V. Vestreng Title Page Abstract Introduction Conclusions References Tables Figures ◭ ◮ ◭ ◮ Back CloseFull Screen / Esc
Printer-friendly Version Interactive Discussion
Treaty of Accession (EU, 2003). In general, the sulphur emission targets for 2010 in the NEC Directive are more ambitious than those in the Gothenburg Protocol.
The main anthropogenic source of sulphur dioxide emissions is the sulphur content of fossil fuels released by combustion. In addition, some sulphur arises from petroleum refining, the smelting of sulphidic ores in the production of heavy metals, in the
pro-5
duction of sulphuric acid, paper and sulphur. Natural fluxes of sulphur originate from volcanoes, and biological and photochemical production in the oceans of volatile sul-phur gases, notably dimethyl sulphide (DMS). Comparably small amounts of sulsul-phur are also emitted from forest fires, soils and vegetation, sulphur springs and sea salt (Simpson et al., 1999).
10
Sulphur emissions influence the level of acidification of soils and freshwater ecosys-tems (e.g. Stoddard et al., 1999; Sch ¨opp et al., 2003), climate change (e.g. Haywood and Boucher, 2000; Ramanathan et al., 2001) and have impacts on human health (e.g. WHO, 2003, 2005, 2006). The acidification situation has been serious in large parts of northern Europe in the 1970s, mainly in the Fenno-Scandia region also due
15
to slow weathering of soil and bedrock. Significant exceedances of critical loads were observed over large parts of central Europe, southern parts of Scandinavia and North-Western Europe (L ¨ovblad et al., 2004). Emission and successive deposition of sulphur have caused material, soil and forest damage (e.g. Nellemann and Goul Thomsen, 2001; Akselsson et al., 2004) and surface water acidification. Decreased pH and
ac-20
companying increase of aluminium compounds is fatal to fresh water fish, and in many lakes e.g. in the southern part of Scandinavia the whole fish population was completely exterminated by 1986. (e.g. Henriksen et al., 1989; Rohde et al., 1995; Yakovlev, 2001; Gunn and Sandøy, 2003; Skjelkv ˚ale et al., 2003). A thorough review and assessment of air pollution trends and their effects was carried out with the occasion of the
Conven-25
tion’s 25 years anniversary in 2004 (Sliggers and Kakebeeke, 2004), complemented by studies from the EMEP programme (L ¨ovblad et al., 2004) and by the Working Group of Effects under the LRTAP Convention (WGE, 2004).
ACPD
7, 5099–5143, 2007 Twenty-five years of continuous sulphur dioxide emission reduction in Europe V. Vestreng Title Page Abstract Introduction Conclusions References Tables Figures ◭ ◮ ◭ ◮ Back CloseFull Screen / Esc
Printer-friendly Version Interactive Discussion
problem of sulphur compounds described above, the emphasis today tends to be more on the climate and human health impacts of the particulate phase of sulphur. The most severe effects in terms of overall health burden of air pollution are associated with the long-term exposure to particulate matter. A significant reduction in life expectancy of the average population by a year or more has been estimated if present levels are to
5
continue (WHO, 2006). In this context, the latest update of World Health Organization (WHO) Air Quality Guidelines (WHO, 2005) reflects the need to provide a larger degree of protection against SO2 emissions than preceding documents (WHO, 2003). Hence the limit values of 20 µgm−3 for 24 h average exposure and 500 µgm−3 for a 10-min
average are much more stringent than before. However, if SO2 emissions should be
10
reduced to levels which are certain to be associated with no effects, the levels would have yet to be much lower than in the current guidelines (WHO, 2005 and references therein).
SO2is an aerosol precursor and can be converted to sulphate aerosols. Both sul-phur dioxide and sulphate have life times of less than a week, hence the influence of
15
sulphur releases is mainly of regional character. Sulphate aerosols are shown to have a significant direct aerosol effect (Haywood and Boucher, 2000; Schulz et al., 2006) and are an important contributor to indirect aerosol effects (Haywood and Boucher, 2000; Ramanathan et al., 2001; Lohmann and Feichter, 2005). The direct and indirect aerosol effects due to sulphate lead to a negative radiative forcing and thus a cooling
20
effect on climate. Myhre et al. (2004) showed that emission changes of SO2 between
1985 and 1996 impact the geographical distribution of the radiative forcing of the direct aerosol effect substantially. Global anthropogenic sulphur emissions have been shown to increase rather steadily up to about 1980, but with a more uncertain trend after that (Boucher and Pham, 2002; Smith et al., 2004; Stern, 2006). The global trend is
un-25
certain over the last decades since it consists of large reduction over North America and Europe and a large increase over Asia. Several authors have studied the possible impact on sulphur deposition due to changes in regional climate (e.g. Mayerhofer et al., 2002; Langner et al., 2005; Sanderson et al., 2006). Changes in weather pattern,
ACPD
7, 5099–5143, 2007 Twenty-five years of continuous sulphur dioxide emission reduction in Europe V. Vestreng Title Page Abstract Introduction Conclusions References Tables Figures ◭ ◮ ◭ ◮ Back CloseFull Screen / Esc
Printer-friendly Version Interactive Discussion
temperature and precipitation has been found to both increase and to decrease acidi-fication, imposing changes of about ±5–6% in sulphur deposition patterns depending on location.
In order to trace the progress in controlling transboundary air pollution and its related effects, the founding Protocol under the LRTAP Convention in 1979 agreed on the
ex-5
change of information by countries on emission data and on transboundary fluxes. The compilation of both emission data and information on transboundary fluxes has been carried out under the Cooperative Programme for Monitoring and Evaluation of the Long-range Transmission of Air Pollutants in Europe, also named the EMEP pro-gramme. Every year since the start of the programme, EMEP has published the
offi-10
cially submitted information on emissions and transboundary fluxes, in recent years as well online on the EMEP website (http:www.emep.intandhttp://webdab.emep.int).
This paper presents the twenty five year trends for sulphur emissions in the EMEP area as estimated within the EMEP programme and documents the sulphur trend by country and sector in time and space. Special focus is given to the post 1990
develop-15
ment and the present 2004 emissions are compared with the ceilings for 2010 in the LRTAP 1999 Multi-effect Protocol (Gothenburg Protocol). Emissions included here are only anthropogenic national emissions. Natural sources of sulphur are not considered here and neither are sulphur emissions from international shipping and international aviation. Although emissions from international air and sea transport may prove to
20
contribute significantly to European air pollution assessments, these are beyond the scope of the present paper. This is the first time that the 25 years of sulphur dioxides emissions reported under EMEP are presented and analysed in peer reviewed litera-ture. In this paper, we first discuss quality aspects of EMEP emissions data and how we work towards a complete validation of the EMEP inventory through annual review
25
processes and by top-down assessments. The emission improvement program under EMEP has increased the transparency and confidence in official submission and is a main reason to support for the first time the publication of the EMEP trends. At the end of the paper, we discuss also the uncertainty ranges of the EMEP inventory and
ACPD
7, 5099–5143, 2007 Twenty-five years of continuous sulphur dioxide emission reduction in Europe V. Vestreng Title Page Abstract Introduction Conclusions References Tables Figures ◭ ◮ ◭ ◮ Back CloseFull Screen / Esc
Printer-friendly Version Interactive Discussion
how the EMEP trend compares with other independent estimates and the European emission contribution to global anthropogenic sulphur inventories.
2 Emission sources and methodology
The main source of emission data used under the LRTAP Convention is national official emission reports (http://webdab.emep.int/, 6th version). Every year,
emis-5
sion data per sector from Parties to the LRTAP Convention is compiled at national level and are reported through the EMEP programme. The national inventories are based on national statistics and country specific, technology dependant emission fac-tors. National experts are requested to estimate their national emissions according to the EMEP/CORINAIR Emission Inventory Guidebook (http://reports.eea.europa.eu/
10
EMEPCORINAIR4/en). If country specific methodologies are applied, these should be documented separately. In the past few years, the requirements for national emis-sion data have become more transparent and guidelines on reporting emisemis-sions have become available (UNECE, 2003). Also new routines and standards for validating emission data have recently been adopted (UNECE, 2005).
15
Whenever there is a lack of reported data, or the officially reported data fails to pass the quality control established in the annual review (UNECE, 2005) described in more below, the sector emissions are either gap-filled or replaced by independent estimates and by linear interpolation and extrapolation. The main source of information for the independent estimates is emission data from the RAINS (Regional Air Pollution
20
Information and Simulation) model (Amann, 2005a; 2005b). RAINS data currently the preferred choice, since the datasets have been thoroughly reviewed with national experts through the Clean Air For Europe (CAF ´E) programme and proved to be largely consistent and comparable with officially reported data. The methodology used to derive the RAINS emission estimates is well documented (http://www.iiasa.ac.at/rains/
25
cafe.html). If no data has been submitted under the LRTAP Convention, and RAINS data is not available, EDGAR emission data (http://www.mnp.nl/edgar/) has been used
ACPD
7, 5099–5143, 2007 Twenty-five years of continuous sulphur dioxide emission reduction in Europe V. Vestreng Title Page Abstract Introduction Conclusions References Tables Figures ◭ ◮ ◭ ◮ Back CloseFull Screen / Esc
Printer-friendly Version Interactive Discussion
instead, as this is to our knowledge the only readily available emission inventory which covers several years of SO2sector data information for all European countries. In some cases, when sector data for a particular year and a particular country is missing but data for other years are available from the country, interpolation of the values is used instead. Extrapolation of country trends is seldom required, and mostly used for the
5
latest year when a Party has failed to submit data in time.
For the scope of this study, the emission sector data is presented according to SNAP (Selected Nomenclature for Air Pollutants) source sectors as defined in the EMEP/CORINAIR Guidebook (http://reports.eea.europa.eu/EMEPCORINAIR4/
en). Sulphur emission trends prior to 1980 are taken according to Mylona (1996, 1997).
10
The source of projected emissions data for 2010 is the emissions ceilings as stated in the Gothenburg Protocol (UNECE, 2004) supplied with RAINS scenario data (Amann, 2005a, b).
3 Validation of the EMEP emission data
3.1 The review process
15
For the last three years, new routines to evaluate and improve the quality of emis-sion data officially reported under the Convention on LRTAP and the National Ceilings Directive (NEC) have been established under the EMEP programme in collaboration with the European Environmental Agency (EEA) and its European Topic Centre on Air Quality and Climate Change (ETC–ACC). The review is based on the key parameters
20
Transparency, Consistency, Comparability, Completeness and Accuracy as defined in the Emission Reporting Guidelines from UNECE (2003).
The estimation and validation of European emission data is first facilitated through the continuous development of the EMEP/CORINAIR Guidebook. The Emission Inven-tory Guidebook (http://reports.eea.europa.eu/EMEPCORINAIR4/en) assists the
na-25
ACPD
7, 5099–5143, 2007 Twenty-five years of continuous sulphur dioxide emission reduction in Europe V. Vestreng Title Page Abstract Introduction Conclusions References Tables Figures ◭ ◮ ◭ ◮ Back CloseFull Screen / Esc
Printer-friendly Version Interactive Discussion
available knowledge on methodology and choice of emission factors for all compo-nents and sectors required for reporting. Whenever updates of the Guidebook become available that may affect the estimation of a certain pollutant, the Parties are requested to recalculate the whole emission time series in order to secure methodologically con-sistent emission time series. The use of a common methodological framework also
5
aims to assure comparability between national emission inventories, and adds also to the transparency of the inventories.
The review of the national emission estimates is presently organised according to recent routines established in UNECE (2005). The review of emission data consists of three stages;
10
1. Stage I checks the timeliness and format of submissions;
2. Stage II evaluates key sources (IPCC, 2000) and establishes the completeness, consistency, comparability and transparency of reported data, and
3. Stage III involves an in-depth review by individual countries which aims at estab-lishing the actual accuracy of the emission estimates.
15
Annual Stage I and II emission data reviews are performed by a review team of experts. These reviews have been performed by EMEP since 2004 in collaboration with ETC– ACC and the UNECE secretariat, covering both data reported under the NEC Directive and under the Convention on LRTAP. Each Member State and Party is provided with a country specific review report three months after the data submission, summarizing
20
conclusions from the review and inducing a bilateral discussion for clarification with the individual country emission experts. Countries are encouraged to give explanations for or correct data within the next reporting round. Meanwhile, if an explanation is not found, a replacement of country data by independent estimates is undertaken. General conclusions from the review are subsequently documented in an annual joint review
25
report (Vestreng et al., 2006a). In addition, well organized reporting routines have proven to be crucial in the work of inventory improvement under EMEP. Thus, upfront
ACPD
7, 5099–5143, 2007 Twenty-five years of continuous sulphur dioxide emission reduction in Europe V. Vestreng Title Page Abstract Introduction Conclusions References Tables Figures ◭ ◮ ◭ ◮ Back CloseFull Screen / Esc
Printer-friendly Version Interactive Discussion
the annual submission of data, reporting instructions detailing the requirements as laid down in the Emission Reporting Guidelines (UNECE, 2003) together with template files for reporting are made available online. Further to that, an online QA/QC tool, REPDAB (Vestreng, 2003), checking the completeness and consistency of reported emission data has been developed and made available to countries for quality control
5
of data before submission.
Despite the short time since the initiation of the new emission data review routines, there has been considerable improvement in the quality of the reported emission esti-mates. The results from Stage I reviews indicate that from 2004 to 2006 the number of reports submitted within deadline has increased by 50%, thus improving the
timeli-10
ness of the inventory. It is also an achievement that emission data are now reported to EMEP in the agreed file structure and according to the agreed Nomenclature for Reporting (NFR) formats. Aggregated sectors are generally consistent with the more detailed categories reported. This is thought to be mainly due to the set up of the re-porting routines, the availability and use of REPDAB and the review team’s increased
15
focus on the importance of consistency for the review process. The improvements made unter Stage I review facilitate considerably the review tasks under Stage II be-low.
The transparency and the availability of additional information concerning the compi-lation of the national emission reports has dramatically increased thanks to the active
20
involvement of national experts in the review. The number of Informative Inventory Re-ports (IIR) with detailed information on the methodologies used to compile emissions and justification of changes with respect to the EMEP/CORINAIR Guidebook has in-creased threefold in the last three years. Also the number of bilateral consultations with national experts and the number of replies to the bilateral review reports has
consider-25
ably increased. This means that the transparency of emission data as defined in the Emission Reporting Guidelines (UNECE, 2003), has greatly improved over a relatively short time period.
method-ACPD
7, 5099–5143, 2007 Twenty-five years of continuous sulphur dioxide emission reduction in Europe V. Vestreng Title Page Abstract Introduction Conclusions References Tables Figures ◭ ◮ ◭ ◮ Back CloseFull Screen / Esc
Printer-friendly Version Interactive Discussion
ologies and reporting guidelines are assessed through five comparability tests in the Stage II review. The tests include recalculations, inventory comparisons (NEC or United Nations Framework Convention on Climate Change (UNFCCC) reported data versus LRTAP data comparisons), implied emission factor (IEF) and cross pollutant checks, as well as the basis for transport emission calculations (fuel used versus fuel
5
sold). Results which fall outside the empirical ranges of averages are tentatively de-fined as outliers by the review team of experts. The review team seeks to find explana-tions for defined outliers in the submitted IIRs, based on knowledge within the expert review team and through country replies to its review reports. The conclusion so far is that most countries follow the methodologies in the EMEP/CORINAIR Guidebook
10
although different tiers are used in different countries, implying that the quality and comparability of the inventories is not fully homogenous throughout the whole EMEP area.
The consistency and completeness of reported time series of emission data per sec-tor is crucial in trend studies of air pollution. As stated before, Parties are encouraged to
15
submit complete inventories and recalculate the whole time series of emissions when-ever new information becomes available. Howwhen-ever, sometimes only the latest year or data back to 1990 are recalculated by applying best available methodologies and emission factors. The review team analyses the consistency of the reports by testing the behaviour of the time series for each particular sector in each individual country.
20
Outliers are defined as dips and jumps in the time series depending on sector and pollutant and flagged for potential replacements necessary to be performed in order to guarantee consistency over time.
For SO2 about 30% of the reported sector data for each year has to be replaced by independent estimates and about 10% of the required emissions are not submitted.
25
This implies that officially reported and accepted sector emissions cover only 60% of the total sulphur trend time series from 1990 until present (Vestreng et al., 2006b). Completeness in the 1980s has not yet been quantified, but is known to be lower (e.g. Vestreng et al., 2005). The completeness of the time series varies also spatially across
ACPD
7, 5099–5143, 2007 Twenty-five years of continuous sulphur dioxide emission reduction in Europe V. Vestreng Title Page Abstract Introduction Conclusions References Tables Figures ◭ ◮ ◭ ◮ Back CloseFull Screen / Esc
Printer-friendly Version Interactive Discussion
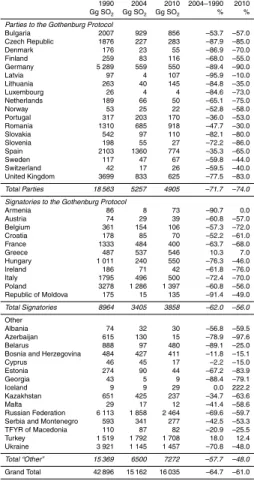
Europe, with a larger lack of officially reported data in Eastern Europe, Central Asia and Caucasus countries. This is indicated in Table 1 where countries are presented in four groups ranging on the level of completeness of the reported and reviewed times series of SO2 emission data. The first group is highlighted in grey and corresponds to the nineteen countries that have a complete and consistent official report of sulphur
5
emissions for all years since 1980. The second group of countries represents the countries where data has been reported for most of the sectors and years but with gaps that needed to be filled. These are a total of thirteen countries and are indicated with bold italics. The third group of countries have not reported any or only fragmentary official estimates and for these RAINS estimates, interpolation and extrapolation have
10
been used instead. These are Albania, Bosnia and Herzegovina, Luxembourg, the Russian Federation, Serbia and Montenegro, The Former Yugoslav Republic (TFYR) of Macedonia and Turkey, a total of seven countries indicated in Table 1 with stars behind the country names. The last group of countries are those that have not reported any or very little official estimates and for which RAINS data estimates are not available, so
15
that EDGAR data have been used instead. These are: Armenia, Azerbaijan, Georgia, Iceland and Kazakhstan, a total of five countries indicated in Table 1 in normal font.
It is worth noting that replacements are never used for compliance checking per-formed under the LRTAP, but merely to assist in atmospheric transport calculations and impact assessments. Feedback from the national experts themselves and from
20
the review team of experts indicate that the emission data improve through the review process, but so far it has been difficult to directly quantify the improvements, mainly because the Emission Reporting Guidelines (UNECE, 2003) does not give clear guid-ance regarding what criteria to review against, and in addition, some of the review tests have been altered or added from one year to the next. The review is done for
25
each reported pollutant, and for some pollutants like particulate matter and pesticides, the EMEP/CORINAIR Guidebook does not provide sufficient information. Conclusions on the review of reported persistent organic pollutants can be found for example in Breivik et al. (2006).
ACPD
7, 5099–5143, 2007 Twenty-five years of continuous sulphur dioxide emission reduction in Europe V. Vestreng Title Page Abstract Introduction Conclusions References Tables Figures ◭ ◮ ◭ ◮ Back CloseFull Screen / Esc
Printer-friendly Version Interactive Discussion
Additionally to the sector totals, spatially distributed emissions are necessary for modelling the dispersion of sulphur pollution. The completeness of official reports of spatially distributed sector data is lower than for the sector totals. Gridded sector data is requested in 5-yearly intervals from 1990 onwards, but only fourteen Parties to the LRTAP Convention have reported gridded sector data of any vintage in the 50×50 km2
5
EMEP grid by 2006 (http://www.emep.int/grid/). EMEP is then required to account for the spatial distribution of emissions from missing countries by deriving its own methods. The methodology for allocating SO2emissions is mainly dependent on the distribution of large point sources, but additional information is also necessary on vertical and temporal variation of emissions (Tarras ´on et al., 2004). Review of gridded sector data
10
is also performed under EMEP, but is at present not formalized to the same extent as for the emission totals and is out of the scope for this study.
3.2 Validation of European SO2emission trends using measurements and modelling In addition to the review of emission data mentioned above, top-down assessments that use both measurements and modelling of air concentrations and depositions are
15
of significant importance to increase the confidence in emission data. It is well known that the sulphur components can be transported over long distances, thus the validation of emission trends cannot be judged by comparing measurements in a region with local emissions. Moreover, the processes that determine the distribution between the different sulphur components (e.g. sulphur dioxide, sulphate and the amount of sulphur
20
deposited dry and wet) may change depending on the chemical composition of the atmosphere as well as meteorological conditions. For instance, the oxidation of sulphur dioxide to sulphate depends on the availability of oxidants, and in the late 1970s to early 1980’s when SO2 emissions peaked, the amount of oxidants was a limitation for the conversion of SO2to sulphate, especially in winter (Fagerli et al., 2003; Roelofs et
25
al., 1998). At present, larger proportions of SO2 are converted to sulphate. This has led to a smaller decrease in sulphate concentrations than in SO2emissions. Moreover, whilst SO2emissions have decreased dramatically, ammonia emissions have remained
ACPD
7, 5099–5143, 2007 Twenty-five years of continuous sulphur dioxide emission reduction in Europe V. Vestreng Title Page Abstract Introduction Conclusions References Tables Figures ◭ ◮ ◭ ◮ Back CloseFull Screen / Esc
Printer-friendly Version Interactive Discussion
at the same level (Vestreng et al., 2005, Bouwman, 1997). As a consequence the dry deposition of SO2has become more efficient over the years, as the surface acidity to a large extent governs the resistance to dry deposition (Fowler et al., 2001). Finally, year-to-year variations both in air concentrations and wet deposition are large, e.g. of the order of 20% for sulphate (van Loon et al., 2005), and thus long time series are
5
needed in order to detect trends in observations.
In order to use measurements to validate the emission trends, it is important to know in what direction and to what extent the trends derived from measurements could be expected to deviate from the emission trends. Furthermore, model simulations may indirectly be used to validate emission trends by comparing the model output to
10
measurements, providing that they incorporate the important processes. SO2and sul-phate background concentrations have been monitored in Europe at several sites since around 1980, for instance through the EMEP Programme. L ¨ovblad et al. (2004) as-sessed the trends in EMEP emissions and measured atmospheric concentrations and deposition of sulphur compounds in Europe from the end of the 1970s until 2000. For
15
SO2,they found national reductions in SO2 emissions and average reductions in SO2 concentrations at national sites to correspond well. Both measurements and emissions changed around 90% for countries like Germany, United Kingdom, Sweden, Austria, Finland and Denmark. For Czech Republic, Italy, Latvia, Lithuania and Switzerland dif-ferences between the reductions in the national EMEP SO2emission inventories and
20
the change in average SO2concentrations was in the order of 5%. A somewhat larger difference was found in Belarus and Slovakia (emission reductions of 80–85%, aver-age SO2concentration reductions of 60–65%), possibly due to the location of the sites. Measurement sites situated at high altitudes, near large sources in neighbouring coun-tries or downwind of large indigenous sources do not necessarily show the same trend
25
as the national emission. In general, however, agreement between national emission reductions and concentrations at sites in a country for the primary component SO2are better than for the secondary component, sulphate, that are transported over longer distances. For sulphate, the decrease was found to be less than for SO2 (typically
ACPD
7, 5099–5143, 2007 Twenty-five years of continuous sulphur dioxide emission reduction in Europe V. Vestreng Title Page Abstract Introduction Conclusions References Tables Figures ◭ ◮ ◭ ◮ Back CloseFull Screen / Esc
Printer-friendly Version Interactive Discussion
50–70%), consistent with the higher conversion rate to sulphate during this period as discussed above. The same pattern was found for oxidized sulphur in precipitation, probably because sulphate particles are the main contributor to oxidized sulphur in precipitation. In conclusion, the trend in the measurement data was found to support the reported trend in emissions.
5
Model simulations can also be used to validate emission changes indirectly through comparison with measurements, however, only a few studies aiming at comparing long term trends in measurements with modelled trends have been performed. Berglen et al. (2006) modelled 1985, 1995 and 2000 using the EMEP, GEIA (http://geiacenter.
org/) and Smith et al. (2004) inventories. They were able to reproduce the sulphate
10
trends to a large extent, although the model showed a slightly smaller decrease (–52%) than the observations (–59%) for the 1985 to 2000 period using the EMEP inventory. Sulphur dioxide was increasingly overestimated over the years. Although the results for sulphate indicate that the trend in the emission data is reasonable, it is difficult to conclude more specifically on the quantity of the emission trend, as the trends in the
15
primary component SO2 (which are closely related to the emission changes) are not very well reproduced in their model simulations.
Evaluation of sulphur trends in air and precipitation using the EMEP Unified model have also been carried out using the EMEP inventory (Fagerli et al., 2003). In this study, 9 different years were calculated (1980, 1985, 1990, 1995–2000), taking into account
20
also the annual meteorological variability. The sulphate trends were well reproduced, with a deviation between model results and EMEP measurements (on average) be-tween -10 and 6% for the different years. Similar to Berglen et al. (2006), the decrease in SO2concentrations was somewhat too low. Whilst modelled SO2concentrations in 1980 were in good agreement with the observations (on average overestimated by 6%),
25
the model simulations overestimated SO2 by 39% in 2000. Fagerli et al., (in prepara-tion) demonstrate that the trends of SO2in Europe are better reproduced if the effect of co-deposition of NH3 and SO2is included in the parameterisation of dry deposition of SO2, indicating that in this case the trend in the EMEP SO2emission inventory indeed
ACPD
7, 5099–5143, 2007 Twenty-five years of continuous sulphur dioxide emission reduction in Europe V. Vestreng Title Page Abstract Introduction Conclusions References Tables Figures ◭ ◮ ◭ ◮ Back CloseFull Screen / Esc
Printer-friendly Version Interactive Discussion
correspond to the observed concentrations.
4 Results
4.1 Historical changes in sulphur emissions
The EMEP inventory’s twenty-five years of sulphur dioxide emission decreases are presented below in a long-term perspective. Emission data from Mylona (1996, 1997)
5
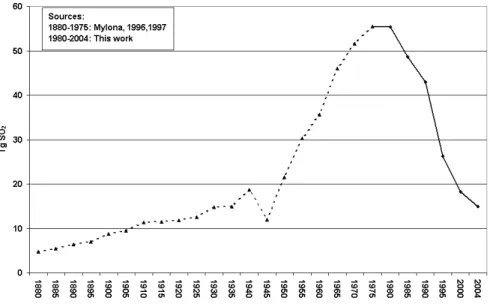
is included prior to 1980 since these emission where comparable with the EMEP in-ventory for overlapping periods. The historical development of sulphur emissions since 1880 are presented in Fig. 1, based on Mylona (1996,1997) for the period 1880 to 1975 and on the EMEP inventory which is based on official reported emission data, from 1980 and onwards. From the pre-industrial area to the outbreak of the Second
10
World War the European SO2 emissions were increasing slowly but steadily from 5 to 19 Tg SO2as a result of increase in power generation from solid fuels. The emissions decreased to World War I level during the World War II, but thereafter grew steeply to about 55 Tg SO2in the late 1970s due also to the availability of liquid fuel to satisfy the increase in energy demand. During the last twenty-five years, European SO2
emis-15
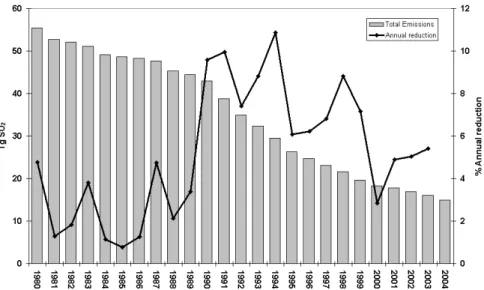
sions have decreased rapidly to 15 Tg SO2, and in 2004 have reached the same level as 70 years ago. Figure 2 (grey bars) presents a closer look at the last twenty-five years of sulphur reduction in Europe. The reduction since 1980 has been significant (73%). The reasons for these considerable reductions are a mixture of the economic situation, implementation of abatement technologies, restructuring of energy sources at national
20
level and increased awareness of the need to reduce sulphur emission through ex-isting international instruments as the Protocols to the LRTAP Convention discussed in some detail below. The emission trends per country as tabulated in Table 1 indi-cate that while the European SO2 emission trend has been continuously decreasing during the whole period 1980–2004, the emission trends vary considerably between
25
ACPD
7, 5099–5143, 2007 Twenty-five years of continuous sulphur dioxide emission reduction in Europe V. Vestreng Title Page Abstract Introduction Conclusions References Tables Figures ◭ ◮ ◭ ◮ Back CloseFull Screen / Esc
Printer-friendly Version Interactive Discussion
countries with constant emissions, countries which increase their emissions and others with emission decreases. There are also large variations in the size and location of the emission changes, and these differences are analysed here.
The key sources for SO2are the sectors Combustion in energy and transformation industries, Non-industrial combustion plants, Combustion in manufacturing industries
5
and Production processes. In Fig. 3 we have plotted the trends in emissions from these sectors from 1990 to 2004. The sector trends are gradually decreasing and flattening out towards 2004. Largest reductions have been obtained from Combustion in energy and transformation industries, followed by Non-industrial combustion plants and Combustion in manufacturing industries. The relative contribution to total SO2
10
emission from the Combustion in energy and transformation industries has increased slightly on behalf of the Non-industrial combustion plants sector. However the key sectors remain the same during the whole period.
Figure 2 displays both absolute and relative annual European emission reductions. Largest relative reductions (black curve) took place in the beginning of the 1990s, with
15
a maximum in 1994–1995 (11%). Largest absolute reduction (grey bars) is seen be-tween 1990 and 1991. The annual reduction was smallest in absolute terms bebe-tween 2000 and 2001, while the relative reductions were only 1% between multiple years in the 1980s. Based on the annual relative emission reductions, we have identified three emission regimes. The annual sulphur reduction is shown to be below 5% in
20
1980–1989 (Low reduction regime) and largest (up to 11%/year) for 1990–1999 (High reduction regime). The downward emission trend has flattened out from 2000 onwards, and annual reductions for the five year period, 2000–2004, are almost back to 1980s level (medium-low reduction regime). In the first reduction regime, 1980–1989, the to-tal European reduction was 11 Tg or about 20%. Toto-tal reduction in the second ten year
25
period was more than twice as large (23 Tg or about 54%). In the last 5 year period a reduction of only 3 Tg could be observed.
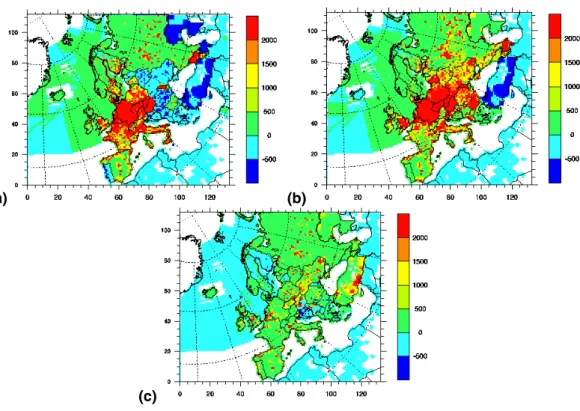
The spatial disaggregation of emissions for the three reduction regimes is presented in the difference maps 1980–1990, 1990–2000, 2000–2004 in Fig. 4. The picture
ACPD
7, 5099–5143, 2007 Twenty-five years of continuous sulphur dioxide emission reduction in Europe V. Vestreng Title Page Abstract Introduction Conclusions References Tables Figures ◭ ◮ ◭ ◮ Back CloseFull Screen / Esc
Printer-friendly Version Interactive Discussion
shows that the countries responsible for the emission reduction during the low reduc-tion regime (Fig. 4a), were mainly Western European, notably Germany, France, Italy, United Kingdom and Spain. Some of the Eastern European countries’ like the Russian Federation, Poland, Hungary and Czech Republic, did also reduce their emissions, but characteristic for this period is the Eastern European increase of emissions (Fig. 4a).
5
Western European countries were responsible for about 75% of total European emis-sion reduction in this reduction regime. During the high reduction regime (Fig. 4b), most Eastern European countries decreased their emissions considerably, notably the Rus-sian Federation, Ukraine, Czech Republic, Poland, Bulgaria and Belarus. The Eastern European countries were responsible for about 80% of total European reductions
dur-10
ing the high reduction regime. Only Turkey continued to substantially increase the sulphur emissions in this period. Finally, the most recent reduction regime reflects the unified Europe with about equal, and medium to small reductions in both Western and Eastern Europe as shown in Fig. 4c. Slight increases are seen also in this period in the Former Yugoslavia, Greece, the Republic of Moldova, Bulgaria and Finland.
15
The three reduction regimes defined above are closely connected to the individual countries political and economical development. In the early 1980s, when the environ-mental problems connected to acidification were confidently highlighted, no suprana-tional instruments were in place to help policy makers forming long-term strategies to abate emissions. In addition few countries had the economical and technological ability
20
to implement the required measures, and this is reflected in the relatively low European reductions between 1980 and 1999. This situation was dramatically changed in the fol-lowing ten year period where one sulphur protocol already was in place, the second Protocol was adopted, and work was ongoing in order to prepare for the Gothenburg Protocol. While the Western European countries continued to implement new
tech-25
nologies and fuels in order to meet Protocol targets and reduce the identified envi-ronmental problems, the economic recession in Eastern Europe, resulting in a drop in activity level, had a larger overall effect on the emission reductions. From 1995 the activity level in many Eastern European countries stabilized and started slowly to
in-ACPD
7, 5099–5143, 2007 Twenty-five years of continuous sulphur dioxide emission reduction in Europe V. Vestreng Title Page Abstract Introduction Conclusions References Tables Figures ◭ ◮ ◭ ◮ Back CloseFull Screen / Esc
Printer-friendly Version Interactive Discussion
crease. However the emissions kept dropping as measures, in particular Flue Gas Desulphurization (FGD), but also extensive fuel switches from solid/liquid to gaseous fuels were implemented. Lately, the tendency is towards an increase in activity level in both East and West, but the total emissions have not increased yet due to the high penetration of emission control technology.
5
We have analyzed further our three reduction regimes by comparing trends in fuel consumption with emission trends. It should be noted that, while Parties to the LRTAP Convention are reporting activity data which is linked to the reported emissions on a 5 yearly basis from 1990 onwards, fuel consumption data post 1990 consistent with the reported emissions have not been readily available for this study. For the period
1980-10
1990 we have studied trends in 5 yearly international statistics of solid fuels (UNECE, 1983, 1985b, 1990, 1992). Neither of these sources of fuel consumption data is as complete in terms of temporal resolution and coverage as are the emission data, and a comprehensive analysis by country and sector of the causes for the emission reduction pattern data is not attempted here.
15
In Eastern Europe, we find that the changes in solid fuel consumption and emissions follow each other closely between 1980 and 1990, while the picture is more dispersed in Western Europe. In Western Europe, emission reductions have been possible also thanks to policy regulations already from the early 1980s, leading to implementation of advanced emission control technologies such as Flue Gas Desulphurization (FGD),
20
together with fuel switch (e.g. from coals with a high sulphur content to gas and the introduction of nuclear power) and increased sulphur removal from refined petroleum products, and not because the demand for sulphur producing activities (energy and heat production, industrial and residential combustion) has ceased. Hence, a clear decoupling of SO2emissions from the trend in activities has been observed already in
25
the first reduction regime in Western Europe.
The period between 1990 and 2000 was dominated by the Eastern Europe socio-political changes and resulting in the transition from a centrally planned economy to a free-market economy. The structural changes were accompanied by a significant drop
ACPD
7, 5099–5143, 2007 Twenty-five years of continuous sulphur dioxide emission reduction in Europe V. Vestreng Title Page Abstract Introduction Conclusions References Tables Figures ◭ ◮ ◭ ◮ Back CloseFull Screen / Esc
Printer-friendly Version Interactive Discussion
in industrial production, hence also energy consumption. The resulting decrease in energy production is directly reflected in corresponding emission reductions of sulphur in countries with the largest reductions during this period like Poland and the Czech Republic, as is also pointed out by Mill (2006). Both in Eastern and Western Europe, the reduction in solid fuel consumption were compensated by increased consumption
5
of gas, renewable and nuclear energy particularly in the last part of this period.
The emission abatement strategy in Former East Germany (GDR) and Former West Germany (FRG) is a good example on how policies, implementation of measures and structural changes are closely linked to the emission reduction pattern and how it has been possible to decrease German (GDR and FRG) emissions by 18% in the 1980s
10
(1980–1989) and by 85% in the ten year’s period (1990–1999) following the reunifica-tion. In the FRG the reduction of SO2 emissions was forced by the implementation of the Federal Emission Pollution Control Act in year 1974 and by several following Federal Emission control ordinances. These regulations caused a wide spread imple-mentation of highly efficient emission control technologies, as well as a switch from
15
solid fuels like coal and lignite to oil and gas, and increased use of low-sulphur heat-ing oil, and resulted in a gradual drop in FRG sulphur dioxide emissions already from 1974 onwards. On the opposite side, and due to financial restrictions, the economy in the GDR was based to the extent possible on the use of domestic lignite (e.g. in 1989 more than 70% of the total primary energy consumption was based on the combustion
20
of lignite). In the years leading up to 1990, there was no specific regulation for the use of domestic lignite and – besides a few very small tentative facilities and, started in 1987, one power plant in Berlin – no advanced emission control technologies were in place in the GDR. Hence, the sulphur dioxides emissions in the three largest sectors in GDR, Combustion in energy and transformation industries, Combustion in
manufac-25
turing industries and, Non-industrial combustion plants, increased until the end of the 1980s. Since the German reunification in 1990, the reduction of SO2 emission has been dominated by the replacement of old facilities by new ones with the best avail-able technology and regulation for desulphurisation of flue gases in large combustion
ACPD
7, 5099–5143, 2007 Twenty-five years of continuous sulphur dioxide emission reduction in Europe V. Vestreng Title Page Abstract Introduction Conclusions References Tables Figures ◭ ◮ ◭ ◮ Back CloseFull Screen / Esc
Printer-friendly Version Interactive Discussion
plants in the eastern part of Germany together with a fuel switch from solid to gaseous and liquid fuels. Since 2001 the national government encouraged the consumption of low-sulphur fuel in the road transportation by a tax discount.
Many countries have already taken necessary steps to substantially decrease their emissions of sulphur. Table 2 shows that by 2004, more than half of the countries
5
have reduced their emissions by 60% or more of the 1990 values, and one quarter of the countries have reduced emissions by more than 80%. Only two countries report increases in the emission level (Turkey and Greece), which can be explained by growth rates of their economies and the related increasing demand for energy. The absolute reductions obtained between 1990 and 2004 are largest for Germany, the Russian
10
Federation, United Kingdom and Ukraine. Reductions estimated for these countries are larger than the reductions from all the other European countries together and has a pronounced impact on the sulphur deposition pattern in Europe as shown in Fagerli et al. (2006).
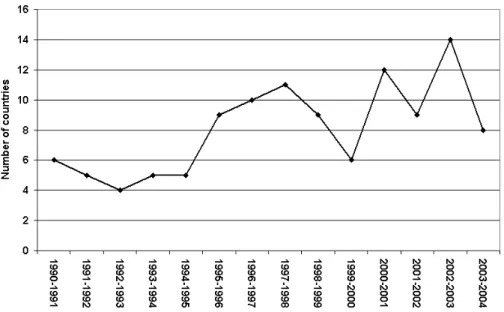
It should be noted, however, that there is now an increasing number of countries
15
reporting increased emissions from one year to another to EMEP. The development from the early 1990s when the reductions were largest, and up to present is shown in Fig. 5. The overall trend is clearly increasing, despite some fluctuation. More than 30 percent of the European countries reported increased emissions of sulphur from 2002 to 2003. This is more than three times as many as ten years earlier. Some of
20
Europe’s largest emitter countries have increased their sulphur emissions from 2000 onwards for the first time since the mid eighties. For most countries, notably the East-ern European countries in which the economy is now recovering, the increase is due to increased public electricity and heat production. The Scandinavian countries, however, report increases in emissions from national shipping. The stabilization of the European
25
emission trend (Figs. 2 and 4), the large reductions already achieved by many coun-tries (Tables 1 and 2) and the growing number of councoun-tries reporting annual emission increases (Fig. 5), is a worrying development of the sulphur emission trend in Europe, and it needs to be closely monitored and further assessed.
ACPD
7, 5099–5143, 2007 Twenty-five years of continuous sulphur dioxide emission reduction in Europe V. Vestreng Title Page Abstract Introduction Conclusions References Tables Figures ◭ ◮ ◭ ◮ Back CloseFull Screen / Esc
Printer-friendly Version Interactive Discussion
4.2 Comparison of 2004 SO2 emission data with targets given by the Gothenburg Protocol
Table 2 shows the level of attainment in 2004 of the Gothenburg Protocol 2010 emis-sions ceilings. Officially reported emisemis-sions for 1990 and 2004 completed as outlined in Sect. 4.1 are listed, together with the 2010 emission ceilings, the percentage reduction
5
from 1990 attained by 2004, and in the last column, the percentage emission reductions between the 1990 base year emissions and the 2010 ceilings as listed for information purposes in the Protocol. The table groups the European countries in three different groups depending on their status relative to the Gothenburg Protocol (UNECE, 2004) and presents the reductions obtained by Parties to the Protocol (i.e. those eighteen
10
European countries which had ratified the Gothenburg Protocol by summer 2006), Sig-natories and “Other” countries. While Parties and SigSig-natories to the Protocol together with Belarus and Cyprus have 2010 emissions ceilings listed in the Protocol, we have included in Table 2 the 2010 estimates from the RAINS model (Amann et al., 2005b) for remaining countries, including the Russian Federation which only has ceilings for
15
its Pollutant Emissions Management Area (PEMA) listed therein.
On a European level the target for SO2 reduction set by the Gothenburg Protocol has apparently been attained in 2004. As shown at the bottom of Table 2, the total European emissions in 2004 were about 15 Tg SO2, while the sum of 2010 emission targets is 16 Tg SO2. Reductions by individual countries are however still expected
20
to be achieved, as half of the Protocol Parties have to reduce their emissions further to attain the 2010 target established by the Gothenburg Protocol (Table 2). Likewise, both the Signatories and “Other” countries groups have already attained their total 2010 targets of 3.9 and 7.3 Tg SO2 respectively. Based on a comparison between 2004 emissions and Protocol Parties’ targets for 2010, the largest near future
Euro-25
pean reductions should take place in the Western part of Europe, notably in Spain and the United Kingdom since these two countries alone must reduce their emissions by 794 Gg SO2. A closer look at those countries with remaining reduction obligation
to-ACPD
7, 5099–5143, 2007 Twenty-five years of continuous sulphur dioxide emission reduction in Europe V. Vestreng Title Page Abstract Introduction Conclusions References Tables Figures ◭ ◮ ◭ ◮ Back CloseFull Screen / Esc
Printer-friendly Version Interactive Discussion
wards 2010 reveals that individual Parties to the Gothenburg Protocol are further away from attaining their emission ceilings than the Signatory countries and countries with-out commitments towards the Protocol. The total emission reductions required by the Parties (956 Gg) is more than five times higher than the sum of the reductions still re-quired by the Signatories (176 Gg) as indicated in Table 2. “Other” countries will also
5
have to reduce their emissions substantially towards 2010 in order to obtain the targets as listed in Table 2 (553 Gg), but we must take into account that neither these countries nor the Signatories have firm binding obligations under the Gothenburg Protocol.
5 Discussion
5.1 Evaluation of uncertainties
10
In general, the uncertainty of SO2 emissions in the Eastern European countries is larger than for Western European countries because the level of reporting and re-sources available for in-country quality control is more limited. An additional factor to consider when determining the uncertainty of the emission trends presented in this paper is that the quality of the data varies also in time as some countries only
recalcu-15
late their time series back to 1990 when improvements in estimation and measurement methodologies become available. In addition, the review and the work on completing the time trends has up to now mostly focussed on post 1990 emissions. Emissions before 1990 might therefore be attributed higher uncertainty than more recent data.
The increased reporting by countries on air pollutant uncertainties in their
Informa-20
tive Inventory Reports (IIR) in combination with uncertainty analysis of LRTAP gases published elsewhere, encouraged a first tentative quantification of the uncertainty in the EMEP SO2 inventory. Uncertainty assessments of green house gases (GHG) for the EU-15 countries were combined (based on Tier 1 estimates from 13 Member States) for the first time in the European Commission National Inventory Report (NIR) 2005
25
(EC, 2005). The overall uncertainty for all GHG was shown to be 4–8%. Lowest un-5121
ACPD
7, 5099–5143, 2007 Twenty-five years of continuous sulphur dioxide emission reduction in Europe V. Vestreng Title Page Abstract Introduction Conclusions References Tables Figures ◭ ◮ ◭ ◮ Back CloseFull Screen / Esc
Printer-friendly Version Interactive Discussion
certainty was found for stationary fossil fuel combustion (1%). The EMEP inventory is also a compilation of emissions from different sources as pointed out in Sect. 2. The largest part of the EMEP inventory consists of emission data officially reported under the Convention on LRTAP complemented by RAINS emission estimates. We do not have as good coverage of individual countries’ uncertainty analysis of air pollutants
5
as is available for the GHG, and are not attempting to provide a complete uncertainty analysis of the EMEP inventory. We present here a compilation of relevant published uncertainty estimates of both officially submitted data (Vestreng et al., 2006b and ref-erences therein) and of RAINS estimates (Sch ¨opp et al., 2005). Uncertainty estimates of air pollutants calculated by Parties rely on the IPCC Good Practice Guidance (IPCC,
10
2000) adopted for LRTAP gases by Pulles and Van Aardenne (2001). Two different methods for uncertainty quantification are recommended therein; a Tire 1 error prop-agation approach and a Tier 2, stochastic simulation (Monte Carlo) analysis. A Tier 2 approach would make more sense for the quantification of uncertainty in SO2 emis-sions as significant dependencies and correlations may exist particularly for fossil fuels
15
(IPCC, 2000). However, Van Gijlswijk et al. (2004) show that for the Netherlands there were no differences between Tier 1 and Tier 2 results for SO2. Seven Parties have
published their uncertainty estimates. Finland, Norway and United Kingdom have ap-plied Monte Carlo analysis while Denmark, France and Czech Republic rely on the Tier 1 approach. The Netherlands provide both Tier 1 and Tier 2 estimates. The
offi-20
cially reported uncertainty estimates in total SO2emissions in the Western European countries is rather low and of the order of 3–7%. Uncertainty in the Czech Repub-lic however was estimated to be about five times larger (Vestreng et al., 2006b). In order to complete the EMEP inventory, modelled emission estimates from the RAINS model (http://www.iiasa.ac.at/rains/) are included, particularly for some of the Eastern
25
European countries. The uncertainty in the modelled SO2 RAINS emission estimates are calculated based on methods specifically developed to analyse the uncertainties in RAINS estimates, considering also the uncertainties in the model parameters them-selves. Generally higher uncertainties are found for RAINS estimates than for the
ACPD
7, 5099–5143, 2007 Twenty-five years of continuous sulphur dioxide emission reduction in Europe V. Vestreng Title Page Abstract Introduction Conclusions References Tables Figures ◭ ◮ ◭ ◮ Back CloseFull Screen / Esc
Printer-friendly Version Interactive Discussion
officially reported data, and with a typical range of 10 to 15% (Sch ¨opp et al., 2005). According to Sch ¨opp et al. (2005), data for some Central and Eastern European coun-tries are more uncertain than for the EU-15 councoun-tries, and for several councoun-tries the uncertainties amount above 20%. Since inclusion of non-official emission estimates is typically required for the latter countries, the uncertainty in the EMEP inventory total
5
emissions is indicated to be between 3% and 25% for individual countries after 1990. Emission data before 1990 might be subject to higher uncertainties as indicated above. Uncertainty in RAINS sector emissions is about twice as large as for the national total due to the more limited potential for error compensation (Sch ¨opp et al., 2005).
In recent years, the lowermost uncertainty level is equally large to the annual
Euro-10
pean sulphur reduction (Fig. 5). Still, even with their inherit uncertainty, the twenty-five years trends presented here are supported by both models and measurements, and has been accompanied by reported improvements and recovery of adverse effects. Fagerli et al. (2006) shows that there has been a major reduction in the risk damage of acidification to ecosystems all over Europe from 1990–2004. While 40% of Parties
15
to the Gothenburg Protocol had their ecosystems at risk in 1990, the unprotected area has decreased to 20% in 2004 (Fagerli et al., 2006). Skjelkv ˚ale et al. (2005) report also widespread improvement in surface water chemistry since 1990. Last but not least, the increased effort by the Parties to the LRTAP Convention to develop good in-country QA/QC systems, followed by enhanced transparency in emission estimation methods
20
and uncertainties documented in the IIRs, together with the ongoing emission review process, allows for an improved confidence in the officially reported emissions used for air quality and health impact modelling.
5.2 Comparison with other anthropogenic emission estimates
The share of European emissions (EMEP inventory) to global anthropogenic emissions
25
has been reduced from 40% in 1980 to 18% in 2000. This implies that the European contribution to global anthropogenic sulphur emissions has more than halved over the last two decades. The global estimates referred to here are those compiled and
ACPD
7, 5099–5143, 2007 Twenty-five years of continuous sulphur dioxide emission reduction in Europe V. Vestreng Title Page Abstract Introduction Conclusions References Tables Figures ◭ ◮ ◭ ◮ Back CloseFull Screen / Esc
Printer-friendly Version Interactive Discussion
mated by Stern et al. (2006). It should be noted that while estimates of global sulphur emission estimates compare well in level and trend up to 1950, relatively larger differ-ences may occur particularly after 1980 (e.g. Lefohn et al., 1999; Olivier and Berdowski, 2001; Smith et al., 2001). A comparison between the most recent global total sulphur inventories by Smith et al. (2004) and Stern (2006) between 1980 and 2000 shows
5
however that they compare surprisingly well taken into account the differences in es-timation methodology applied in most areas. The global total estimates of sulphur emission differ by less than 5% between 1980 and 1992 while the differences increase to 12% (6.5 Tg SO2) in 2000, Stern (2006) estimating lower emissions than Smith et al. (2001).
10
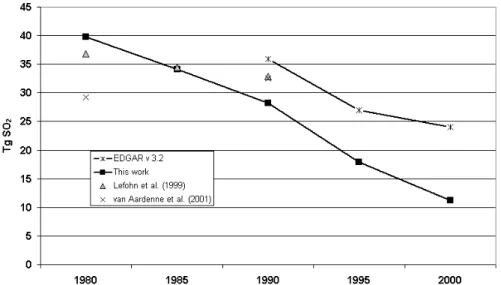
Our comparison is therefore focussed to the three inventories of Lefohn et al. (1999), van Aardenne et al. (2001) and EDGAR version 3.2 inventory (Olivier and Berdowski, 2001) as presented in Fig. 6. The EMEP inventory is the only of these inventories covering the whole time span of interest (1980–2004), so the comparison is carried out there where data from the other inventories is available. For the period 1980 to 1990 the
15
annually resolved inventory from Lefohn et al. (1999) and the ten yearly resolved data per region from van Aardenne et al. (2001) are included in the comparison. Between 1990 and 2000, the five yearly resolved EDGAR inventory (Olivier and Berdowski, 2001) were included. The two latter inventories are related as they are both based on the same constant 1990 SO2emissions factors provided by J. Berdowski as personal
20
communication (Aardenne et al., 2001) in addition to international statistics. Lefohn et al. (1999) base their calculation on national and international statistics for the extraction and production of sulphur bearing fuels and metals, sulphur content in those fuels and varying degree of Flue Gas Desulphurization (FGD) control. In contrast, the EMEP inventory is based on country specific technology dependent emission factors and both
25
national and international activity statistics. In order to make sure that we compare emissions from identical areas, we decided to exclude emissions from the territory of the Former USSR, Turkey and Cyprus, and concentrate the comparison on the areas “OECD Europe” and “Eastern Europe” as defined in EDGAR.
ACPD
7, 5099–5143, 2007 Twenty-five years of continuous sulphur dioxide emission reduction in Europe V. Vestreng Title Page Abstract Introduction Conclusions References Tables Figures ◭ ◮ ◭ ◮ Back CloseFull Screen / Esc
Printer-friendly Version Interactive Discussion
A year by year comparison between the EMEP inventory and Lefohn et al. (1999) inventories (not shown in Fig. 6) between 1980 and 1990 shows that these two invento-ries compare well in level and trend up to 1984, Lefohn et al. (1999) estimating around 5% lower emissions. Thereafter Lefohn et al. (1999) estimate an increase in emis-sions between 1984 and 1986 and coincide with the EMEP inventory in 1985. Lefohn
5
et al. (1999) emissions are relatively constant between 1986 and 1989 and decrease with the same gradient as the EMEP inventory between 1989 and 1990. Both Lefohn et al. (1999) and the EMEP inventory show an overall emission decrease between 1980 and 1990, but the Lefohn et al. (1999) emission reduction is rather small com-pared to EMEP (Fig. 6). The difference between the inventories is three times larger
10
in 1990 than in 1980, and might be attributed to difference in applied emission control, a factor which becomes increasingly important with time for the accuracy of emission estimates.
van Aardenne et al. (2001) indicate an increasing trend in sulphur emissions between 1980 and 1990, opposing the trend in both Lefohn et al. (1999) and the EMEP inventory
15
(Fig. 6). The reason for this is an increase in emissions in Eastern Europe. Since the emission factors are kept constant, this increase should be due mainly to increases in the consumption of solid fuels, as discussed in Sect. 4. The main difference between the inventories seems to be that the 1990 emission factors applied to estimate the van Aardenne et al. (2001) 1980 emissions were low compared to those applied in the
20
EMEP and Lefohn et al. (1999) inventory.
We see from Fig. 6 that for the year 1990 all the inventories included in the compar-ison have relatively similar emissions estimates. The difference between the EDGAR and the EMEP inventories is 28%, while the van Aardenne et al. (2001) and Lefohn et al. (1999) total European estimates for 1990 coincide. The comparison made
be-25
tween the van Aardenne et al. (2001) and Lefohn et al. (1999) global inventories in the paper by van Aardenne et al. (2001) show that the 1990 global estimates are also the same. Possible explanations for this similarity in emission estimates at both global and regional scale are not discussed in van Aardenne et al. (2001), and it is not possible


![[PDF] Apprendre la programmation Android avec base de données - Free PDF Download](data:image/gif;base64,R0lGODlhAQABAIAAAP///wAAACH5BAEAAAAALAAAAAABAAEAAAICRAEAOw==)